Correction (October 11, 2026): Washington's Office of Superintendent of Public Instruction republished its attendance files on September 30, 2026, with recalculated counts. In the restated data, Tacoma's 2024-25 increase is 2.1 points, not 2.3, and it erased most of the previous year's 3.4-point improvement, not 3.7. Vancouver's rate rose 0.3 points to 34.5%, not 1.6 points to 35.8%, so this article no longer describes Vancouver as following a pattern similar to Tacoma's. The article's other figures were restated to the new edition. Tacoma's increase is still the largest among the state's 10 biggest districts.
Correction (September 30, 2026): An earlier version of this article said Hispanic students in Tacoma had the largest one-year increase of any student group, rising 3.2 points to 42.8%, and that students experiencing homelessness rose by the same margin. In the state's current data, the Hispanic rate rose 3.1 points to 42.7%, and the rate for students experiencing homelessness rose 3.2 points, the largest increase of any group. The earlier version also called Tacoma the state's third-largest district (it is the fourth-largest in the state's 2024-25 attendance data), said Tacoma ran 7 to 10 points above the state average through the 2010s (the state's data before the pandemic covers 2015-16 through 2018-19, when the gap was 7.0 to 9.4 points), said the 2024-25 increase erased more than a year of progress (it erased most of the previous year's 3.7-point improvement), and described the recovery as three years long (it was two years of decline). Tacoma's overall rates and the comparison with the other large districts were not affected.
For two years, Tacoma↗ET Public Schools was one of Washington's attendance recovery stories. The chronic absenteeism rate dropped from a catastrophic 40.3% in 2021-22 to 37.5% in 2022-23, then 34.1% in 2023-24, a steady, encouraging trajectory that suggested the state's fourth-largest district was finding its way back.
The 2021-22 figure is the state's published district rate. That year the state listed nine Tacoma schools, including seven elementary schools and Tacoma Online, as above regular-attendance thresholds of 98.8% to 99.8% without publishing their counts. Across the Tacoma schools with published counts, the 2021-22 rate was 47.8%, so the peak was, if anything, higher than the published figure shows.
In 2024-25, that trajectory broke. Tacoma's chronic rate rose to 36.2%, a 2.1-point jump that erased most of the previous year's 3.4-point improvement. In all, 10,448 of the district's 28,834 students were chronically absent in 2024-25, 825 more than the year before.
The largest reversal among top districts
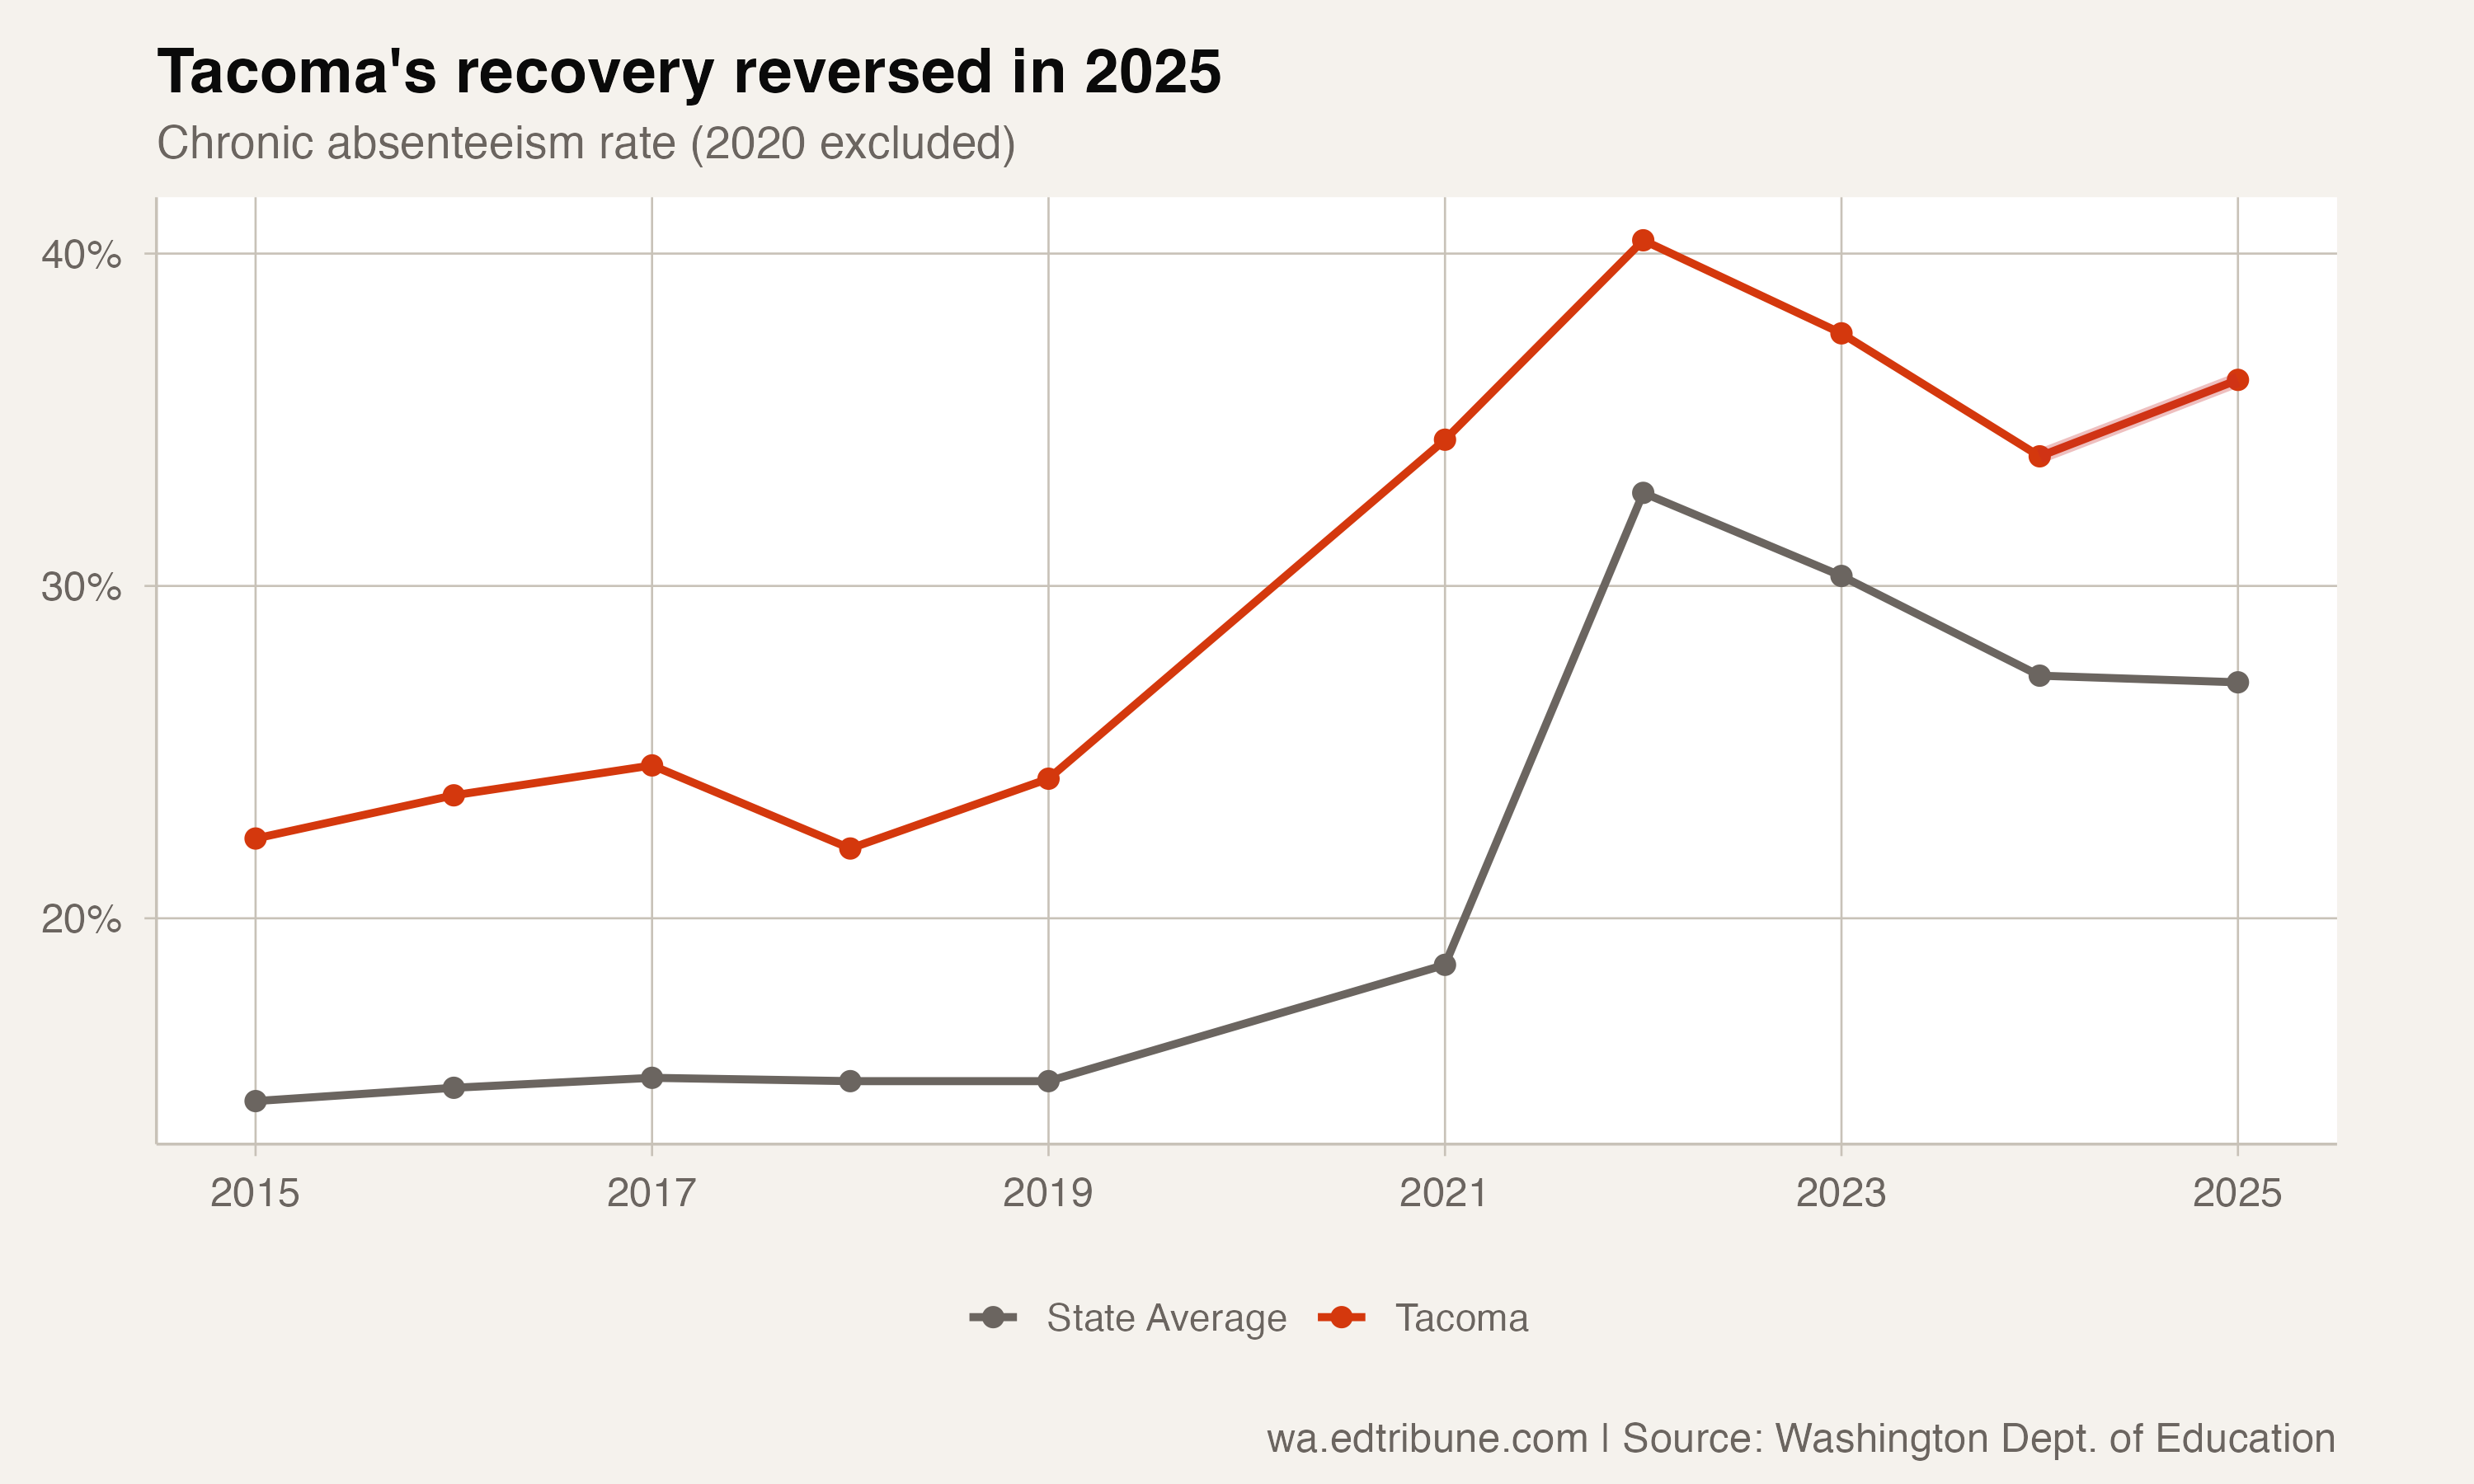
The 2.1-point increase is the largest among Washington's 10 biggest school districts. Kent (+0.9 points) also worsened, while Vancouver (+0.3) and Seattle (+0.1) were essentially flat, but Tacoma's reversal stands out both in size and because it interrupted what had been consistent progress.
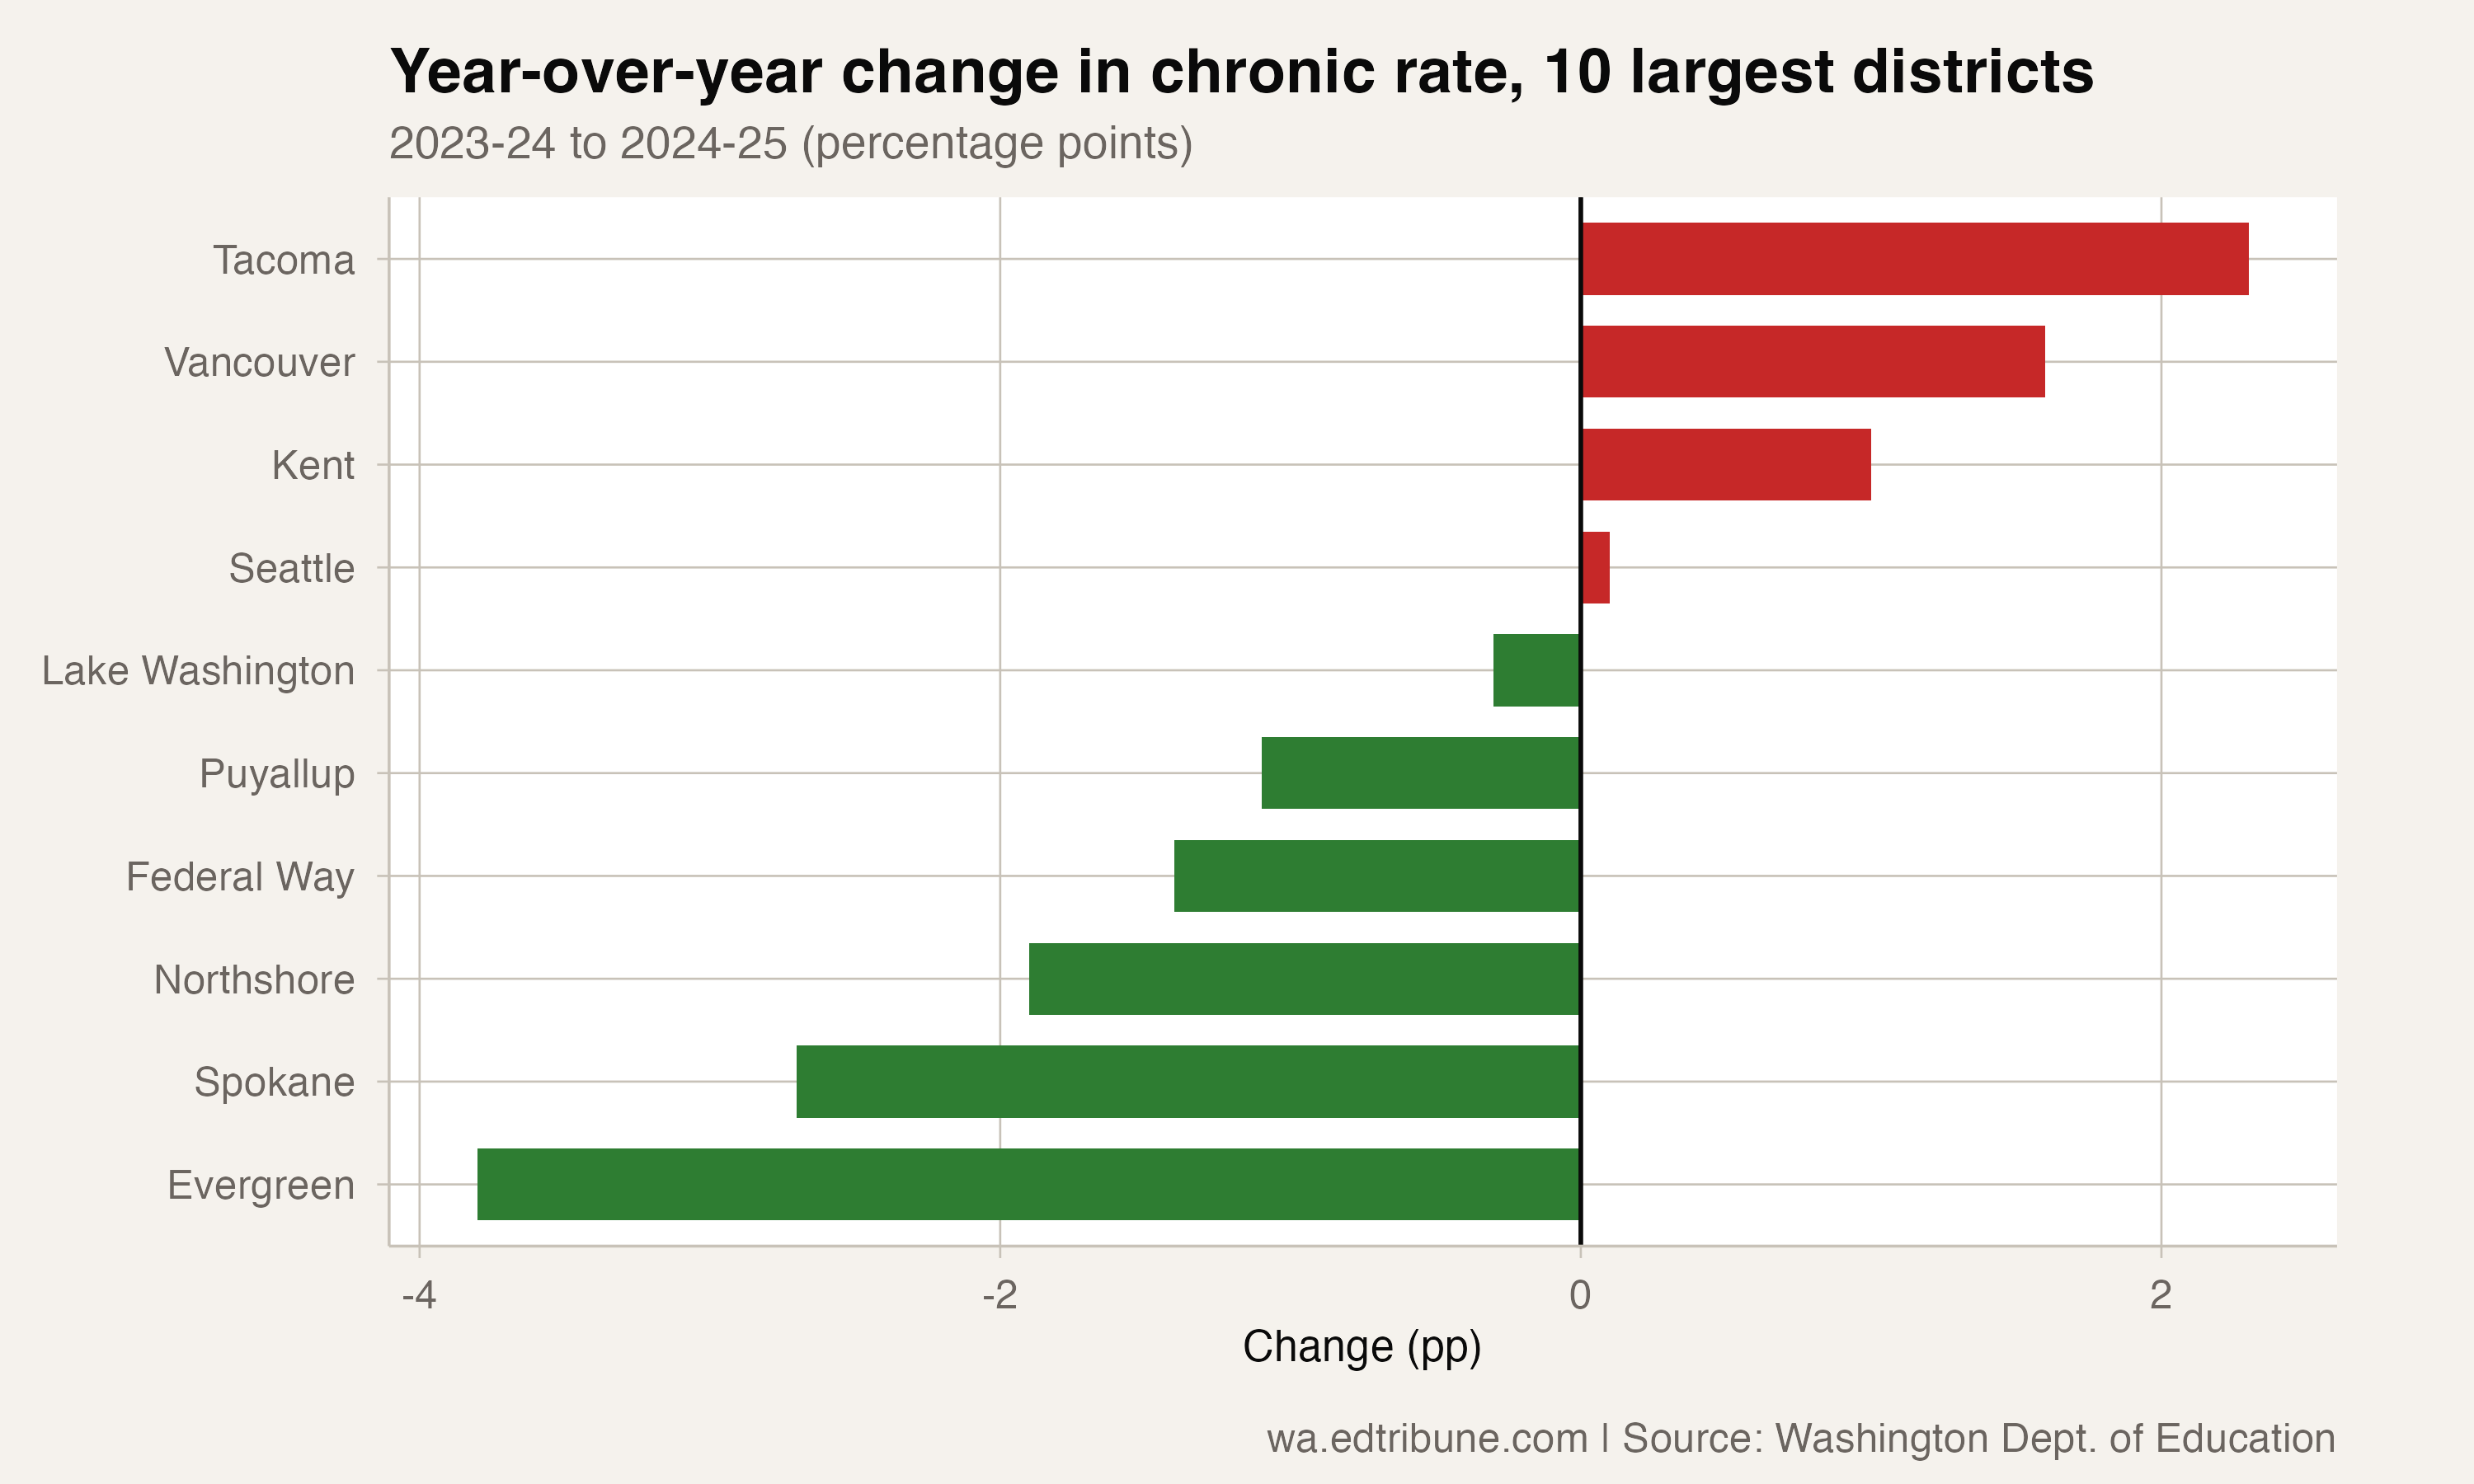
Other large districts continued improving. Spokane↗ET dropped 2.7 points to 29.6%. Evergreen (Clark County) fell 4.5 points to 34.4%. Puyallup shed 1.1 points. The split among large districts, some still improving and others reversing, suggests that the statewide stall is not a uniform phenomenon but the result of gains in some places being offset by losses in others.
Who got worse
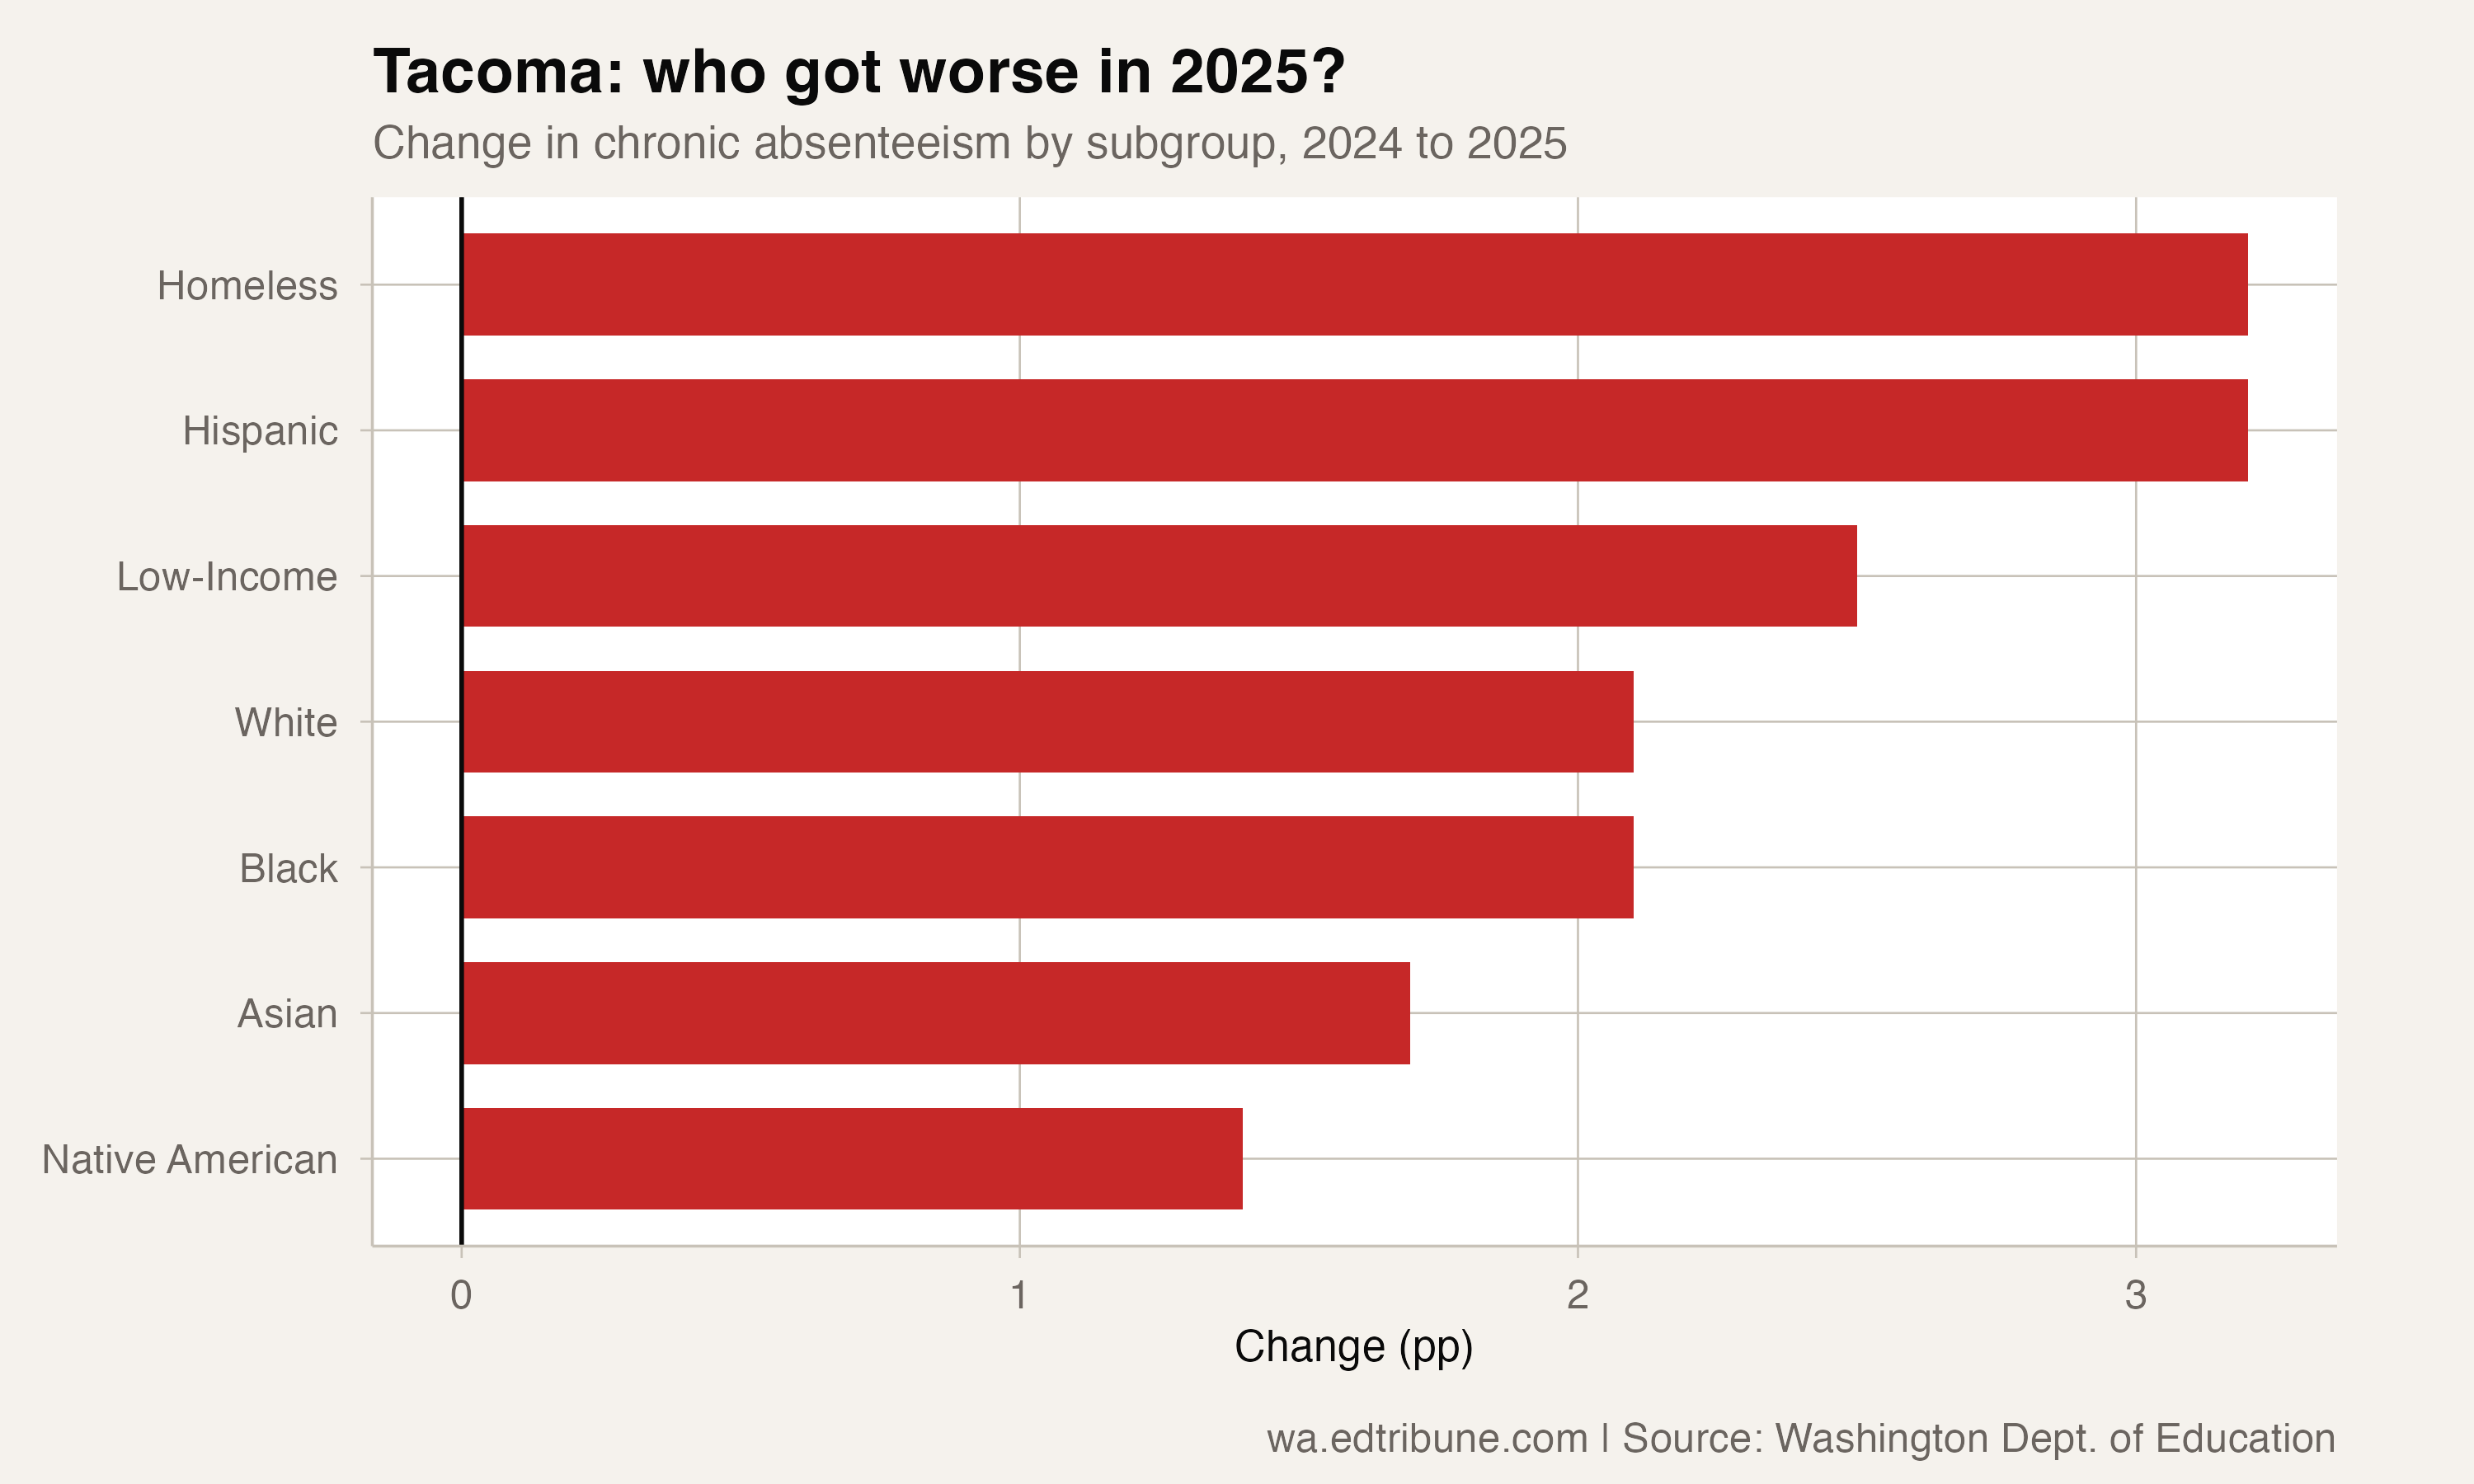
The reversal in Tacoma was broad-based. Every major student group saw its chronic rate increase. Students experiencing homelessness had the largest jump, from 53.0% to 56.2%, a 3.2-point increase. Hispanic students were close behind, rising from 39.8% to 42.8% (+3.0 points). Low-income students went from 41.1% to 43.5% (+2.4 points).
White students rose 1.9 points to 29.2%, and Black students rose 2.3 points to 39.4%. Asian students, typically the lowest-rate racial group, rose from 24.7% to 26.2%.
The across-the-board nature of the reversal suggests this was not driven by a single demographic shock. Whatever caused Tacoma's attendance to worsen, it affected every student group.
Still 12 points above pre-pandemic
Even before the reversal, Tacoma was far from recovered. The district's 2024-25 rate of 36.2% is 12.1 points above the 2018-19 rate of 24.1%, itself not a low number. Tacoma had elevated chronic absenteeism before COVID: in each year from 2015-16 through 2018-19, its rate ran between 7.0 and 9.4 points above the state average.
The pandemic pushed Tacoma from a district with a significant attendance problem to one where more than a third of students miss at least 10% of the school year. The brief recovery period brought the rate down but never approached the pre-pandemic level, and now the direction has reversed.
Those 10,448 chronically absent students each missed at least 10% of the days they were enrolled. That loss compounds: students who are chronically absent in one year are more likely to be chronically absent the next, and their academic outcomes tend to suffer.
The question of why
Tacoma's reversal does not yet have a clear single cause. The district serves a diverse, relatively high-poverty population, with 59% of students from low-income families (eligible for free or reduced-price meals), in a mid-size city grappling with housing costs, homelessness, and the ongoing effects of pandemic disruption.
The fact that the reversal was spread across all student groups argues against a targeted cause like an immigration-related enrollment shift or a change in how one population group engages with school. It is more consistent with a systemic factor: a housing-cost spike that destabilized families, a transportation disruption, a staffing shortage that affected school climate, or simply the exhaustion of the "easy" attendance recoveries.
Vancouver↗ET School District (22,076 students) also ticked up in 2024-25, but only by 0.3 points, to 34.5%, a far smaller move than Tacoma's. Both districts serve more low-income students than the state as a whole: 59% in Tacoma and 54% in Vancouver, against 50% statewide. Whether housing pressure plays a part is a question the attendance data alone cannot answer.
Data from the Washington Office of Superintendent of Public Instruction. Analysis covers 2015-16 through 2024-25. The 2019-20 school year is excluded because pandemic school closures cut that attendance year short.
Detailed code that reproduces the analysis and figures in this article is available exclusively to EdTribune subscribers.
Discussion
Sign in to join the discussion.
Loading comments...