Correction (September 30, 2026): An earlier version of this article said Quillayute Valley had the lowest chronic absenteeism rate for low-income students in Washington, 4.2% among 3,348 students. That figure is not a reliable measure. Quillayute Valley hosts Insight School of Washington, an online school that enrolls students from across the state, and the state reports its attendance as near-perfect without publishing its student counts. Across the district's schools that do publish counts, the low-income rate was 22.8%. We replaced that example with the lowest rates among districts whose own schools account for their students. The earlier version also gave Spokane's poverty gap as 20.0 points; it is 19.9. The statewide figures were not affected.
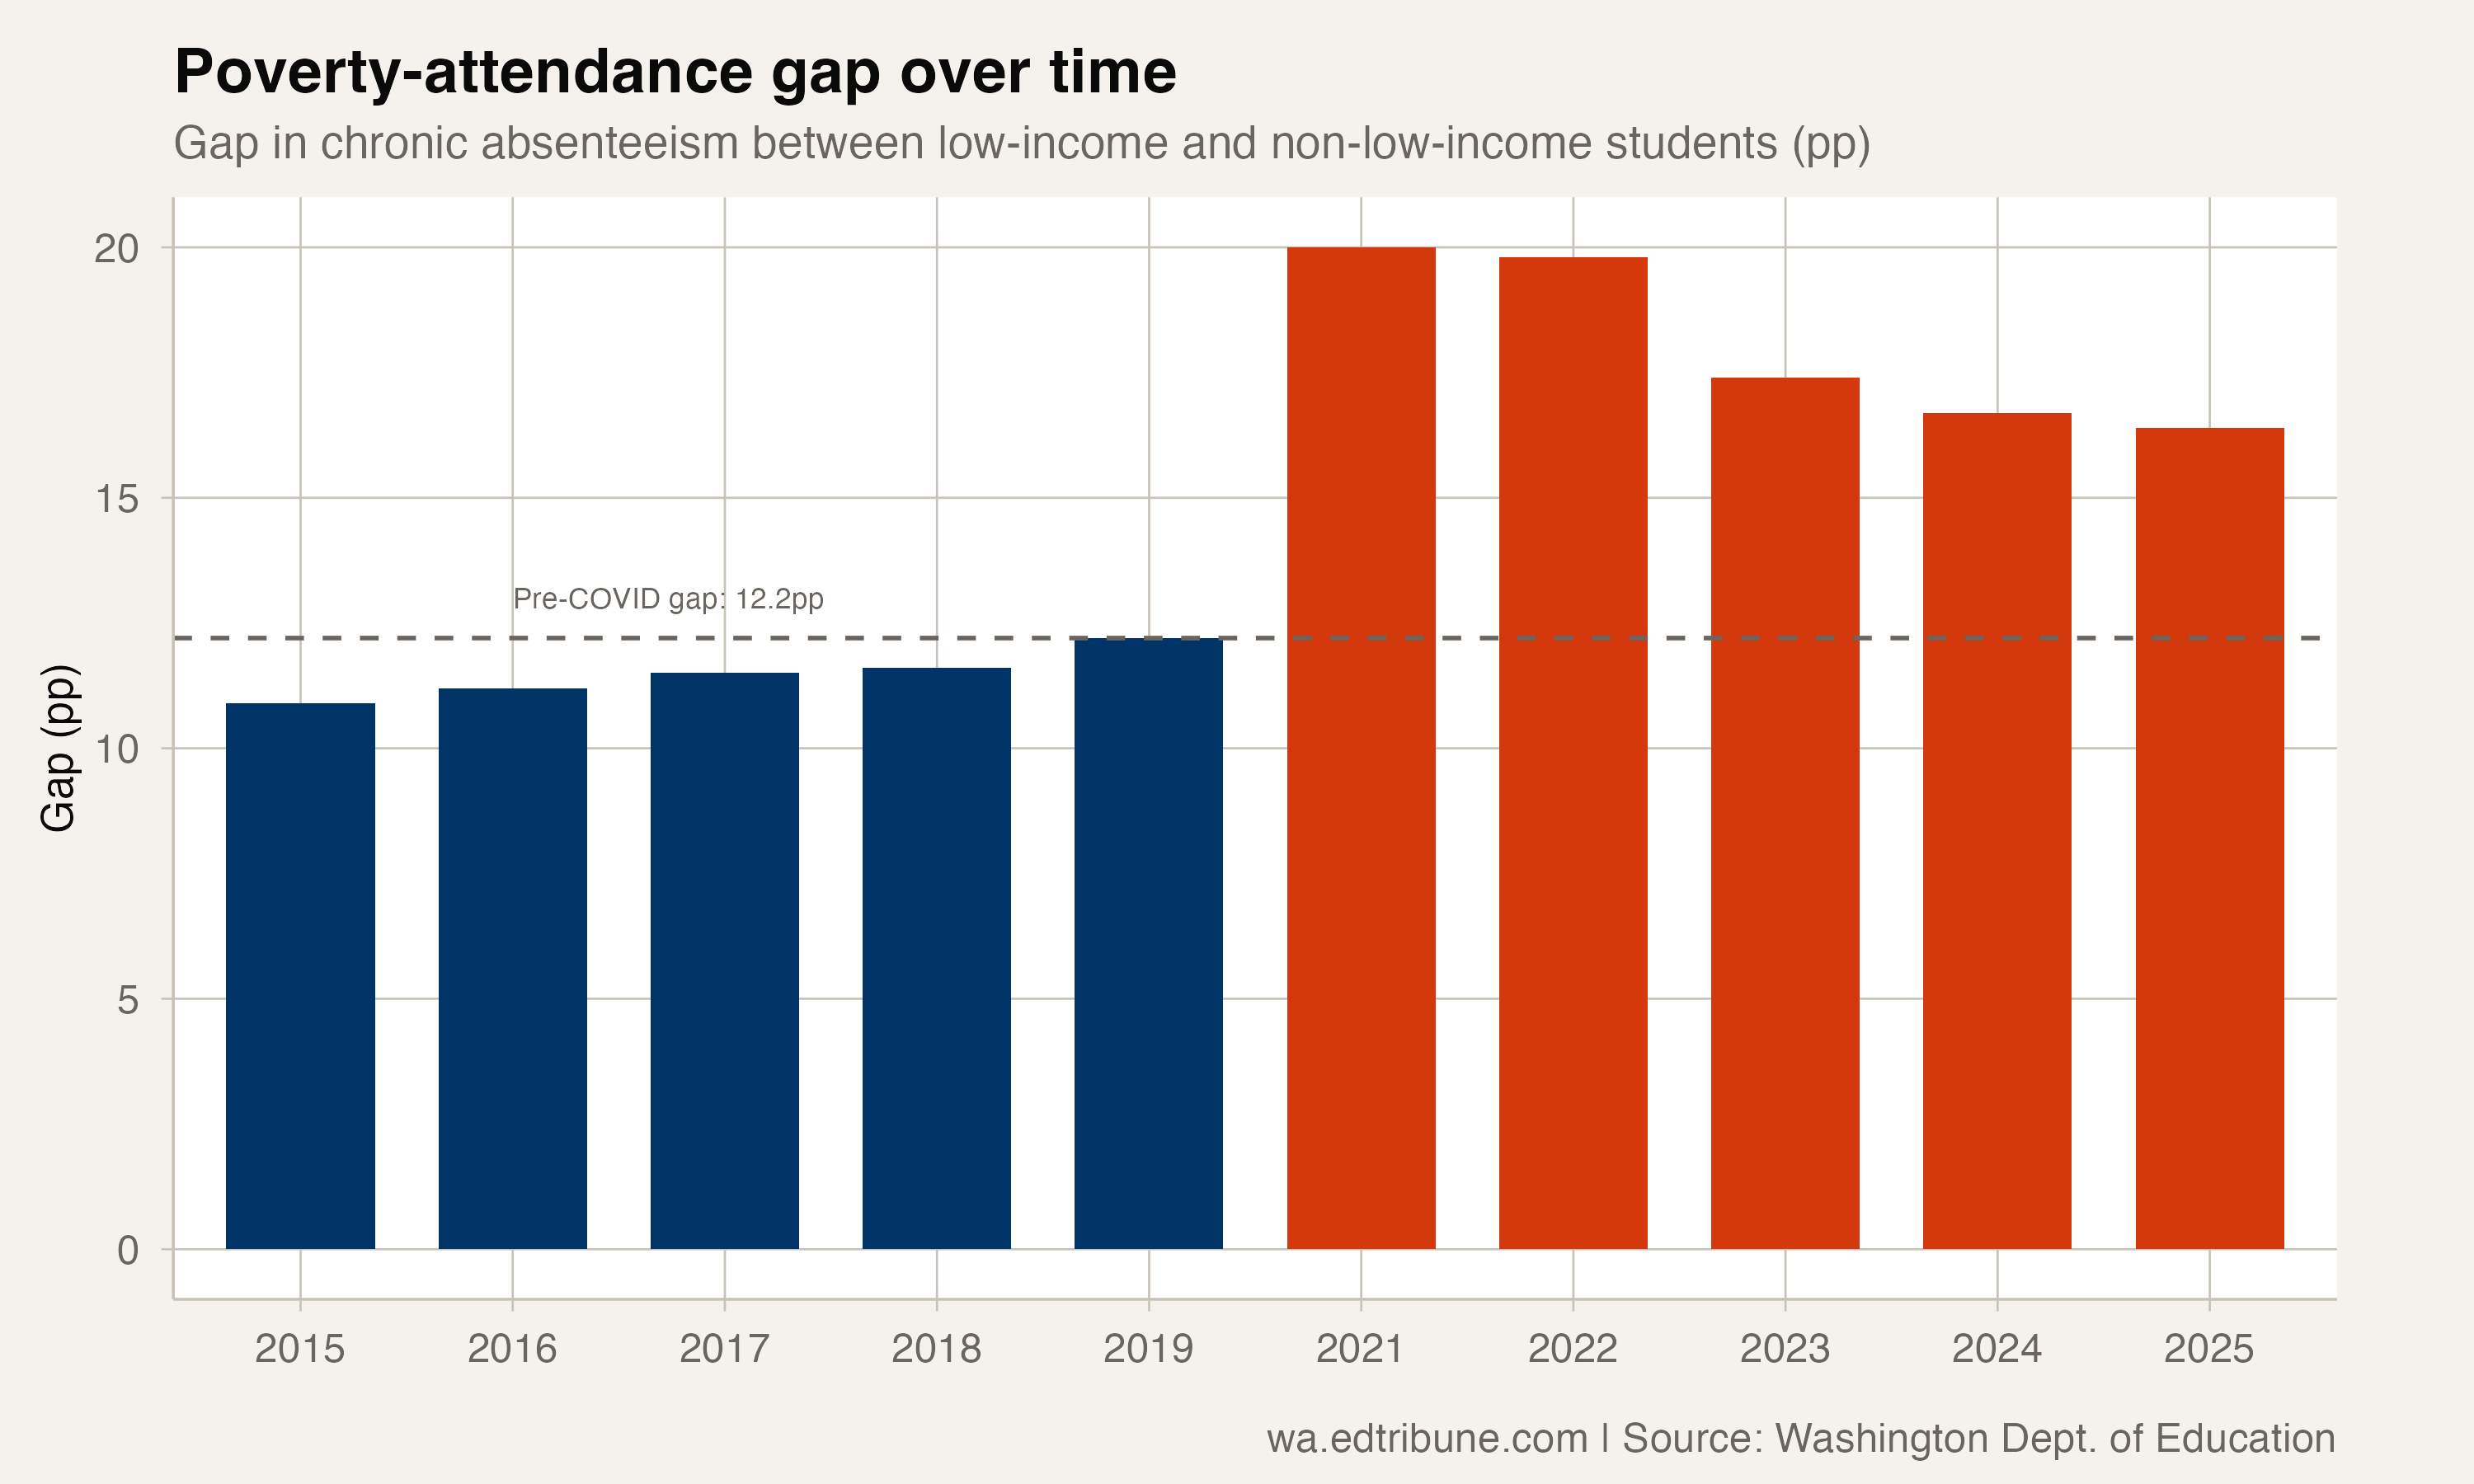
Before the pandemic, the attendance gap between low-income and non-low-income students in Washington was 12.2 percentage points: 21.5% of economically disadvantaged students were chronically absent, compared to 9.3% of their peers. That gap had been slowly growing, from 10.8 points in 2015, but the increase was gradual enough that it attracted little urgency.
COVID blew it open. In 2020-21, as schools reopened, the gap surged to 19.9 points: low-income chronic absence jumped to 29.3% while non-low-income barely moved at 9.4%. The pandemic's attendance impact fell almost entirely on poor families.
A gap that peaked and has not closed
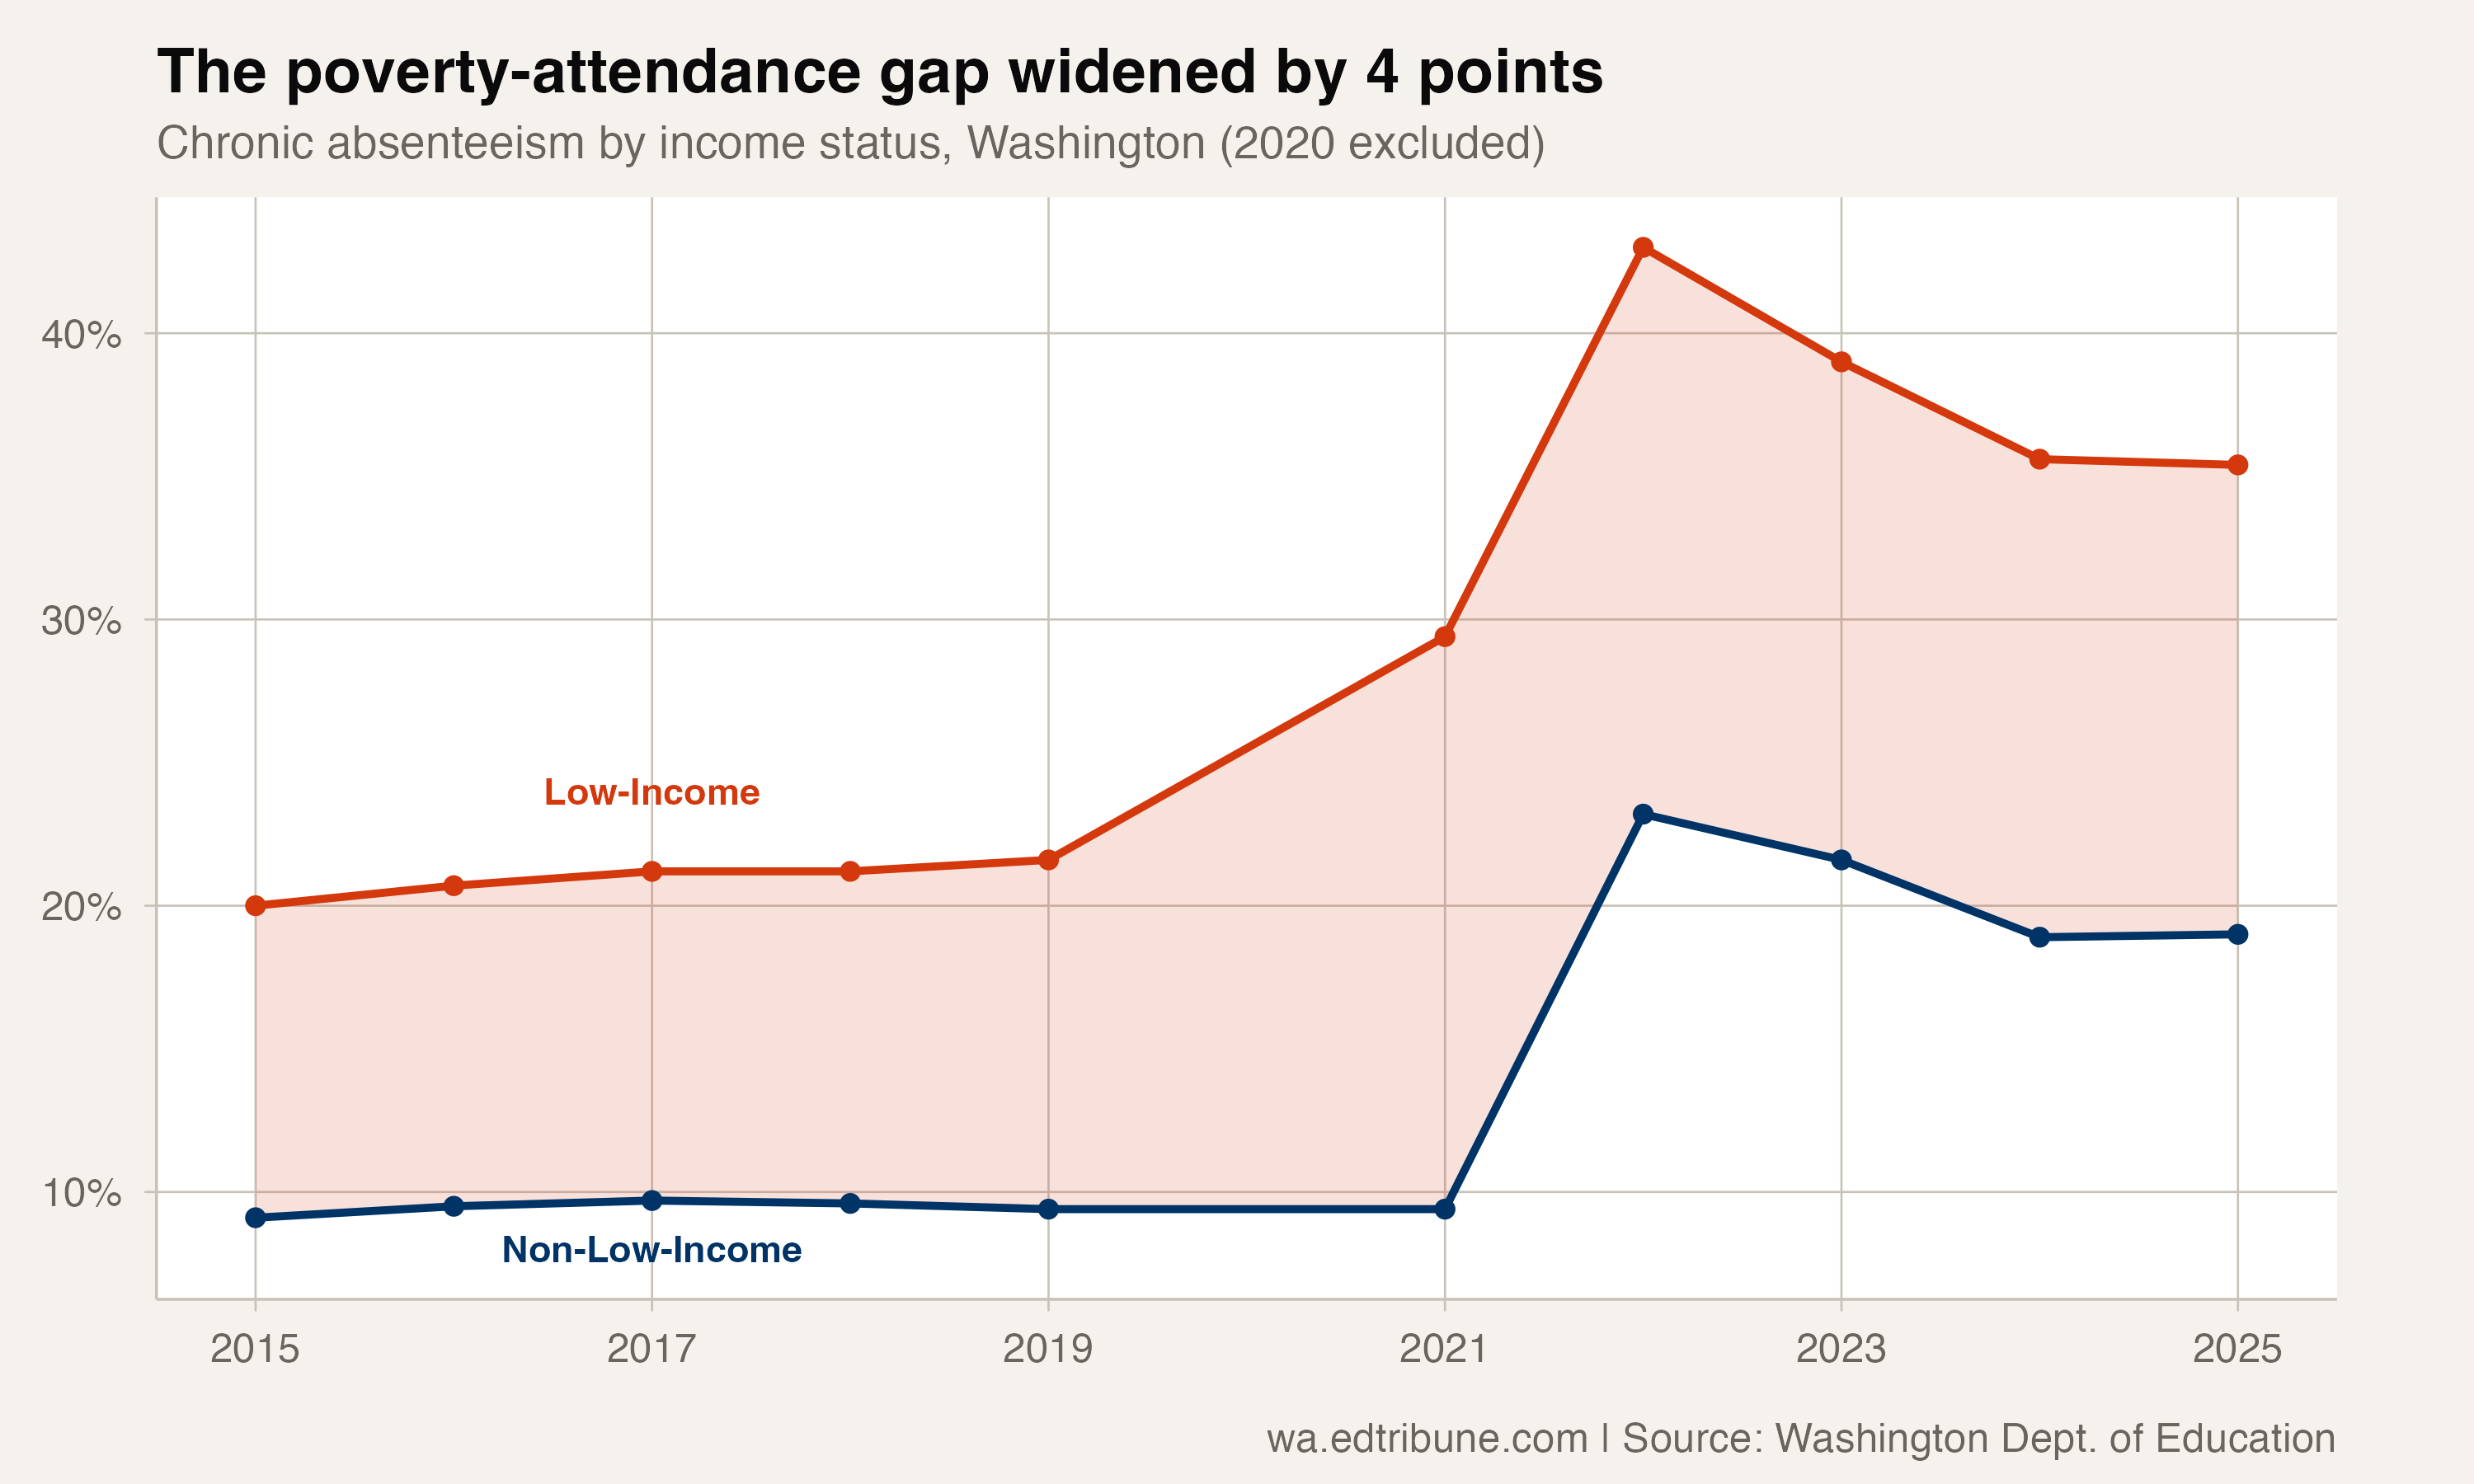
The gap has narrowed since 2021, but only because non-low-income students finally caught up in the 2021-22 spike year, pushing their chronic rate to 23.2% before settling back to 19.2%. Low-income students dropped from their 42.9% peak to 35.4%. The gap in 2024-25, the most recent year the state has published, is 16.2 points, 4.0 points wider than before COVID, a 33% increase.
The trajectory of the narrowing tells an uncomfortable story. The gap went from 19.7 points in 2022 to 17.4, then 16.7, then 16.2. That is a deceleration: the gap has closed by about one point per year on average, which would mean returning to the pre-pandemic gap of 12.2 points around 2028. But each year has closed less than the year before, and in 2025 the gap narrowed by only half a point.
More than double the rate
In 2024-25, more than one in three low-income students (35.4%) was chronically absent. For non-low-income students, the rate was closer to one in five (19.2%). The ratio, 1.84 to 1, means that a student from a low-income family is nearly twice as likely to miss a month of school.
Washington defines economic disadvantage using federal free and reduced-price lunch eligibility, supplemented by direct certification through SNAP, TANF, and foster care programs. In 2024-25, roughly 544,000 of the state's 1.09 million students, nearly half, qualified, meaning the 35.4% chronic rate applies to the largest student subgroup in the system.
The non-low-income rate of 19.2%, while substantially lower, is itself concerning. Before COVID, just 9.3% of non-low-income students were chronically absent. That rate has more than doubled and shows no sign of returning to its baseline, suggesting that the pandemic's attendance impact was not exclusively a poverty phenomenon, even if poverty magnified it.
The within-district divide
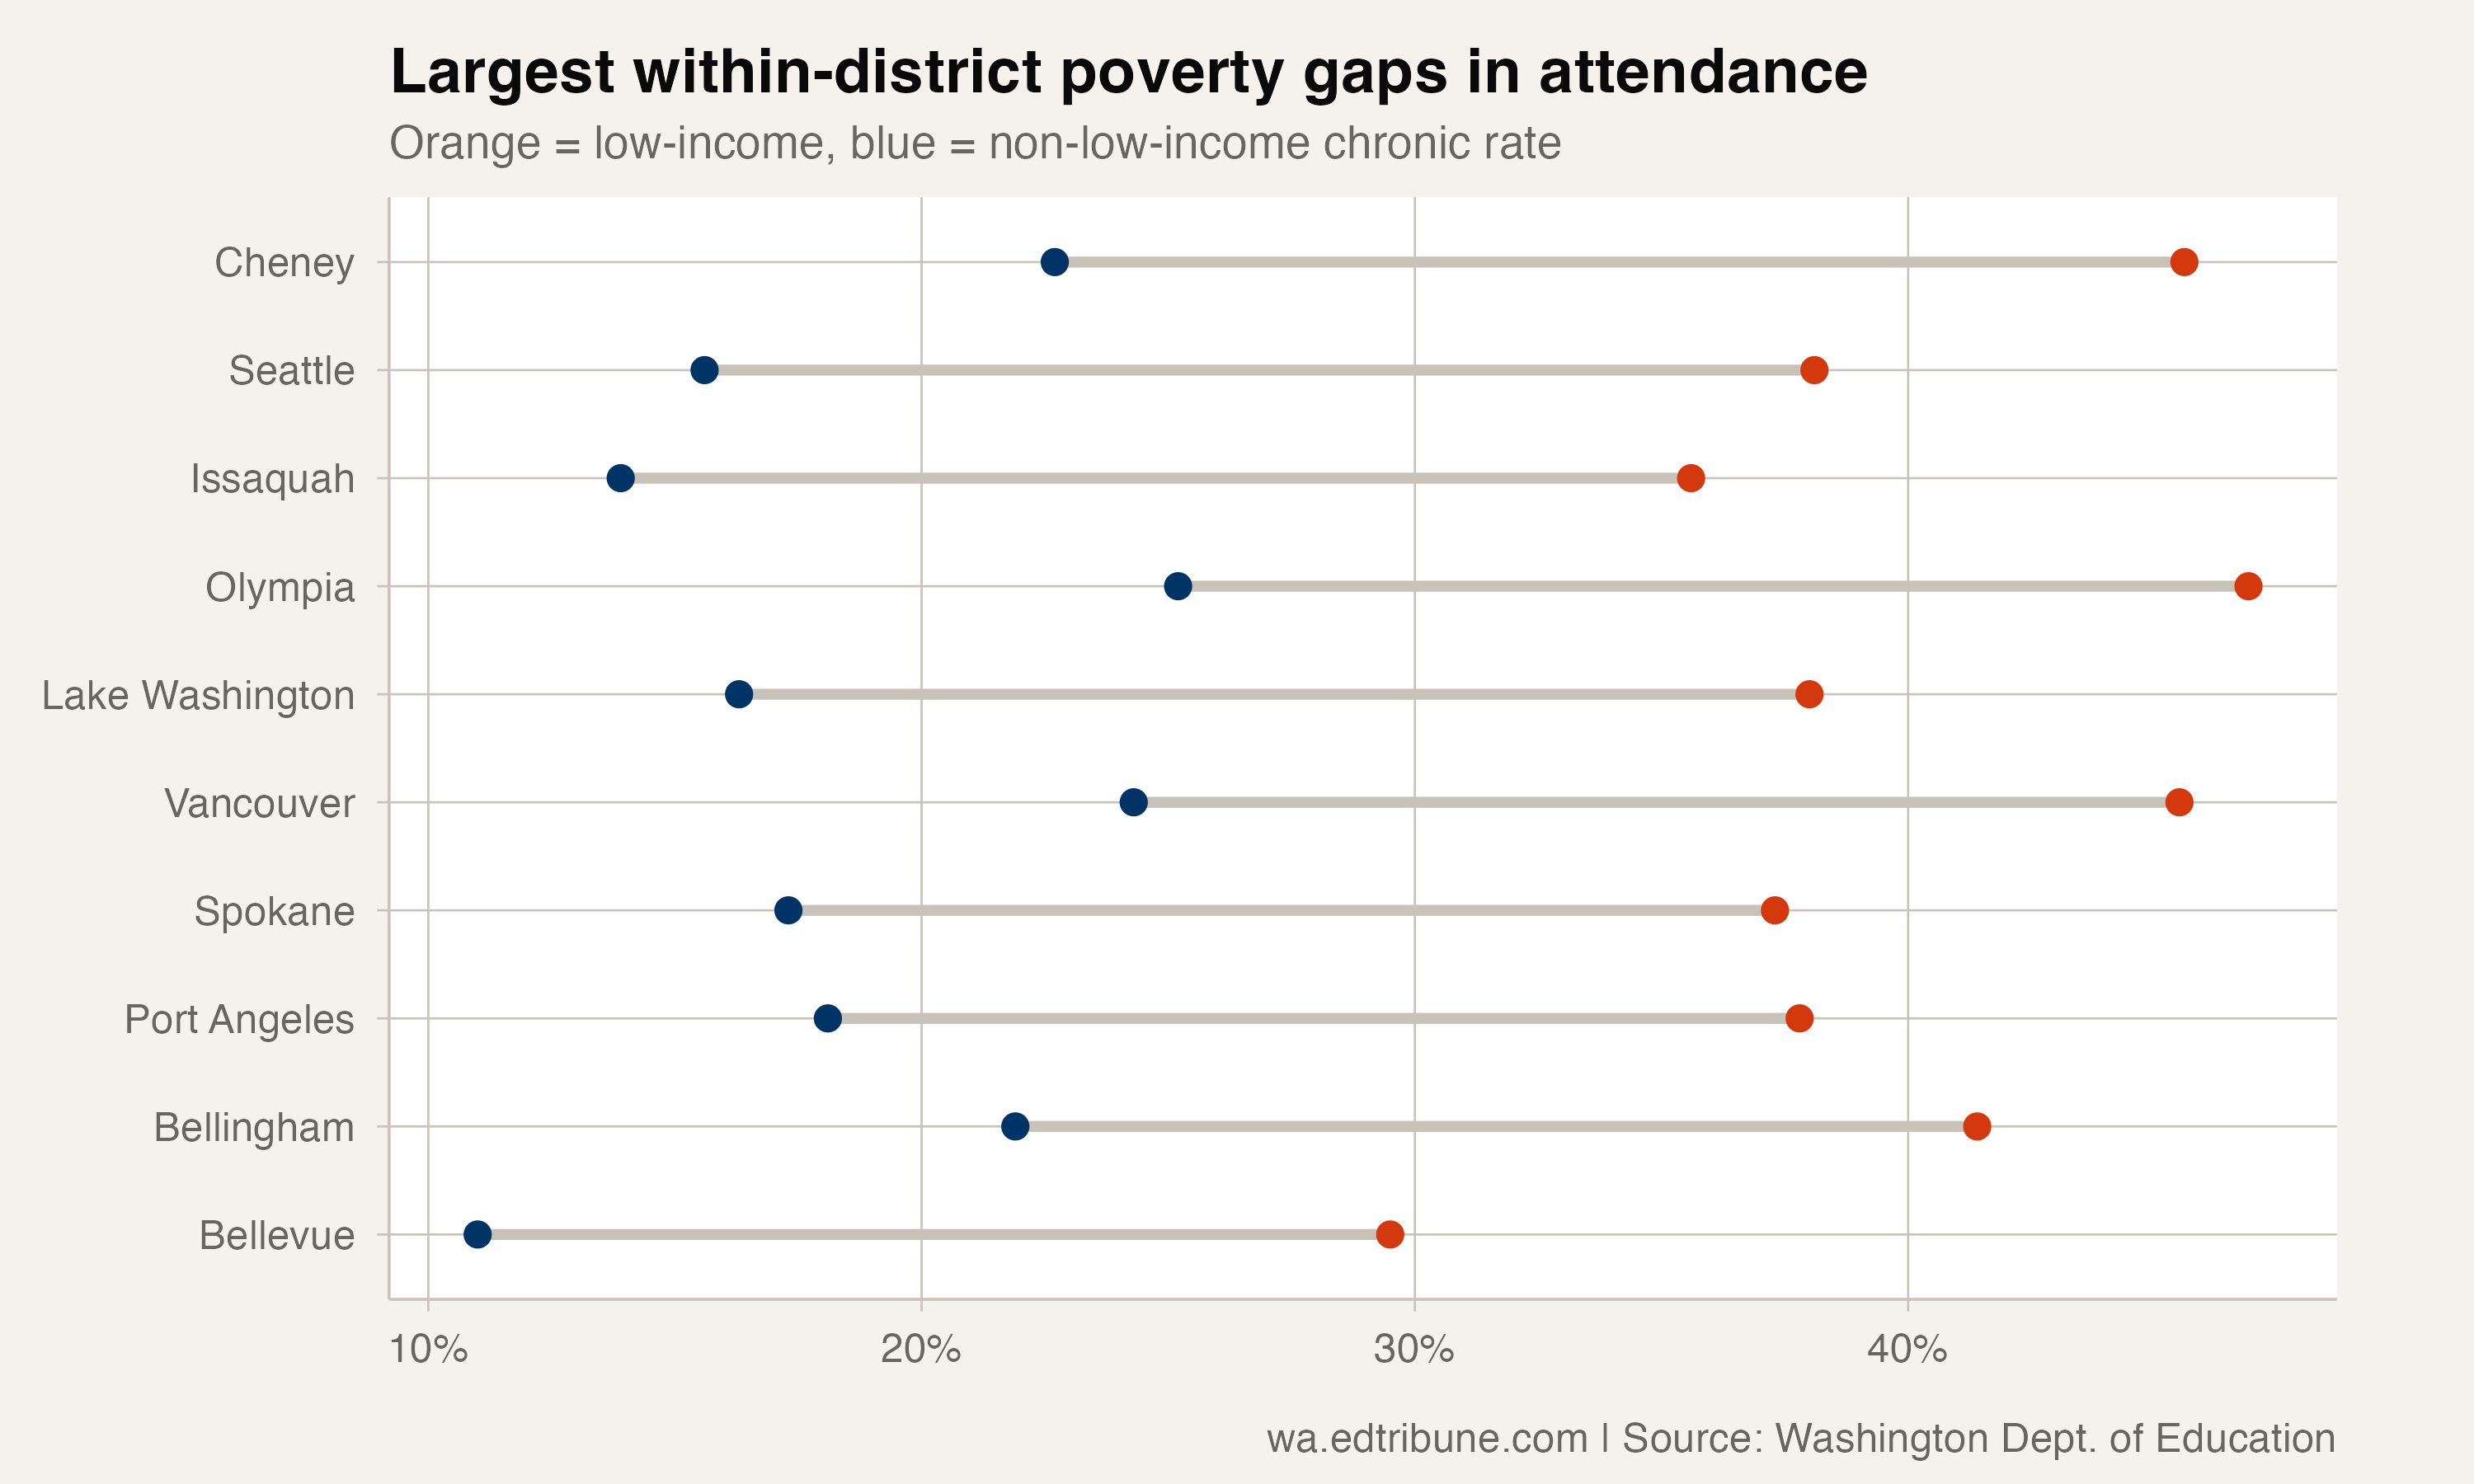
Within individual districts, the poverty-attendance gap can be enormous. In Cheney (5,688 students), low-income students are chronically absent at 45.6% while non-low-income students are at 22.7%, a 22.9-point gap. In Seattle↗ET (51,064 students), the gap is 22.5 points (38.1% vs. 15.6%). Issaquah (19,248 students) has a 21.7-point gap.
These are districts where two students sitting in the same classroom are experiencing fundamentally different attendance realities depending on their family's income. The low-income student is more than twice as likely to be missing a month of school.
At the other end, the lowest low-income chronic absence rates that districts' own schools can account for are in Cashmere↗ET (14.9% of 739 low-income students), Riverside (16.4% of 827) and Brewster (22.8% of 894). Some districts report lower rates, including Quillayute Valley↗ET at 4.2% of its 3,340 low-income students, but those districts host online schools whose attendance the state reports as near-perfect without publishing their student counts. Across Quillayute Valley's schools that do publish counts, the low-income rate was 23.3%. In Spokane↗ET (29,764 students), the gap between low-income students and their peers is 19.9 points.
What the gap means for recovery
Washington's overall chronic absenteeism rate will not return to pre-pandemic levels unless the low-income rate comes down dramatically. The math is simple: with roughly half the student body qualifying as economically disadvantaged, the low-income chronic rate of 35.4% pulls the statewide average up by about 8 percentage points above what it would be if only non-low-income students were counted.
The 16.2-point poverty gap is not just a measure of inequity. It is the primary structural barrier to statewide attendance recovery. Until the conditions that keep low-income families from getting their children to school consistently (housing instability, transportation gaps, healthcare access, childcare for younger siblings) are addressed, the statewide number will remain stubbornly high.
Data from the Washington Office of Superintendent of Public Instruction. Economic disadvantage defined by free/reduced-price lunch eligibility and direct certification. Analysis covers 2014-15 through 2024-25.
Detailed code that reproduces the analysis and figures in this article is available exclusively to EdTribune subscribers.
Discussion
Sign in to join the discussion.
Loading comments...