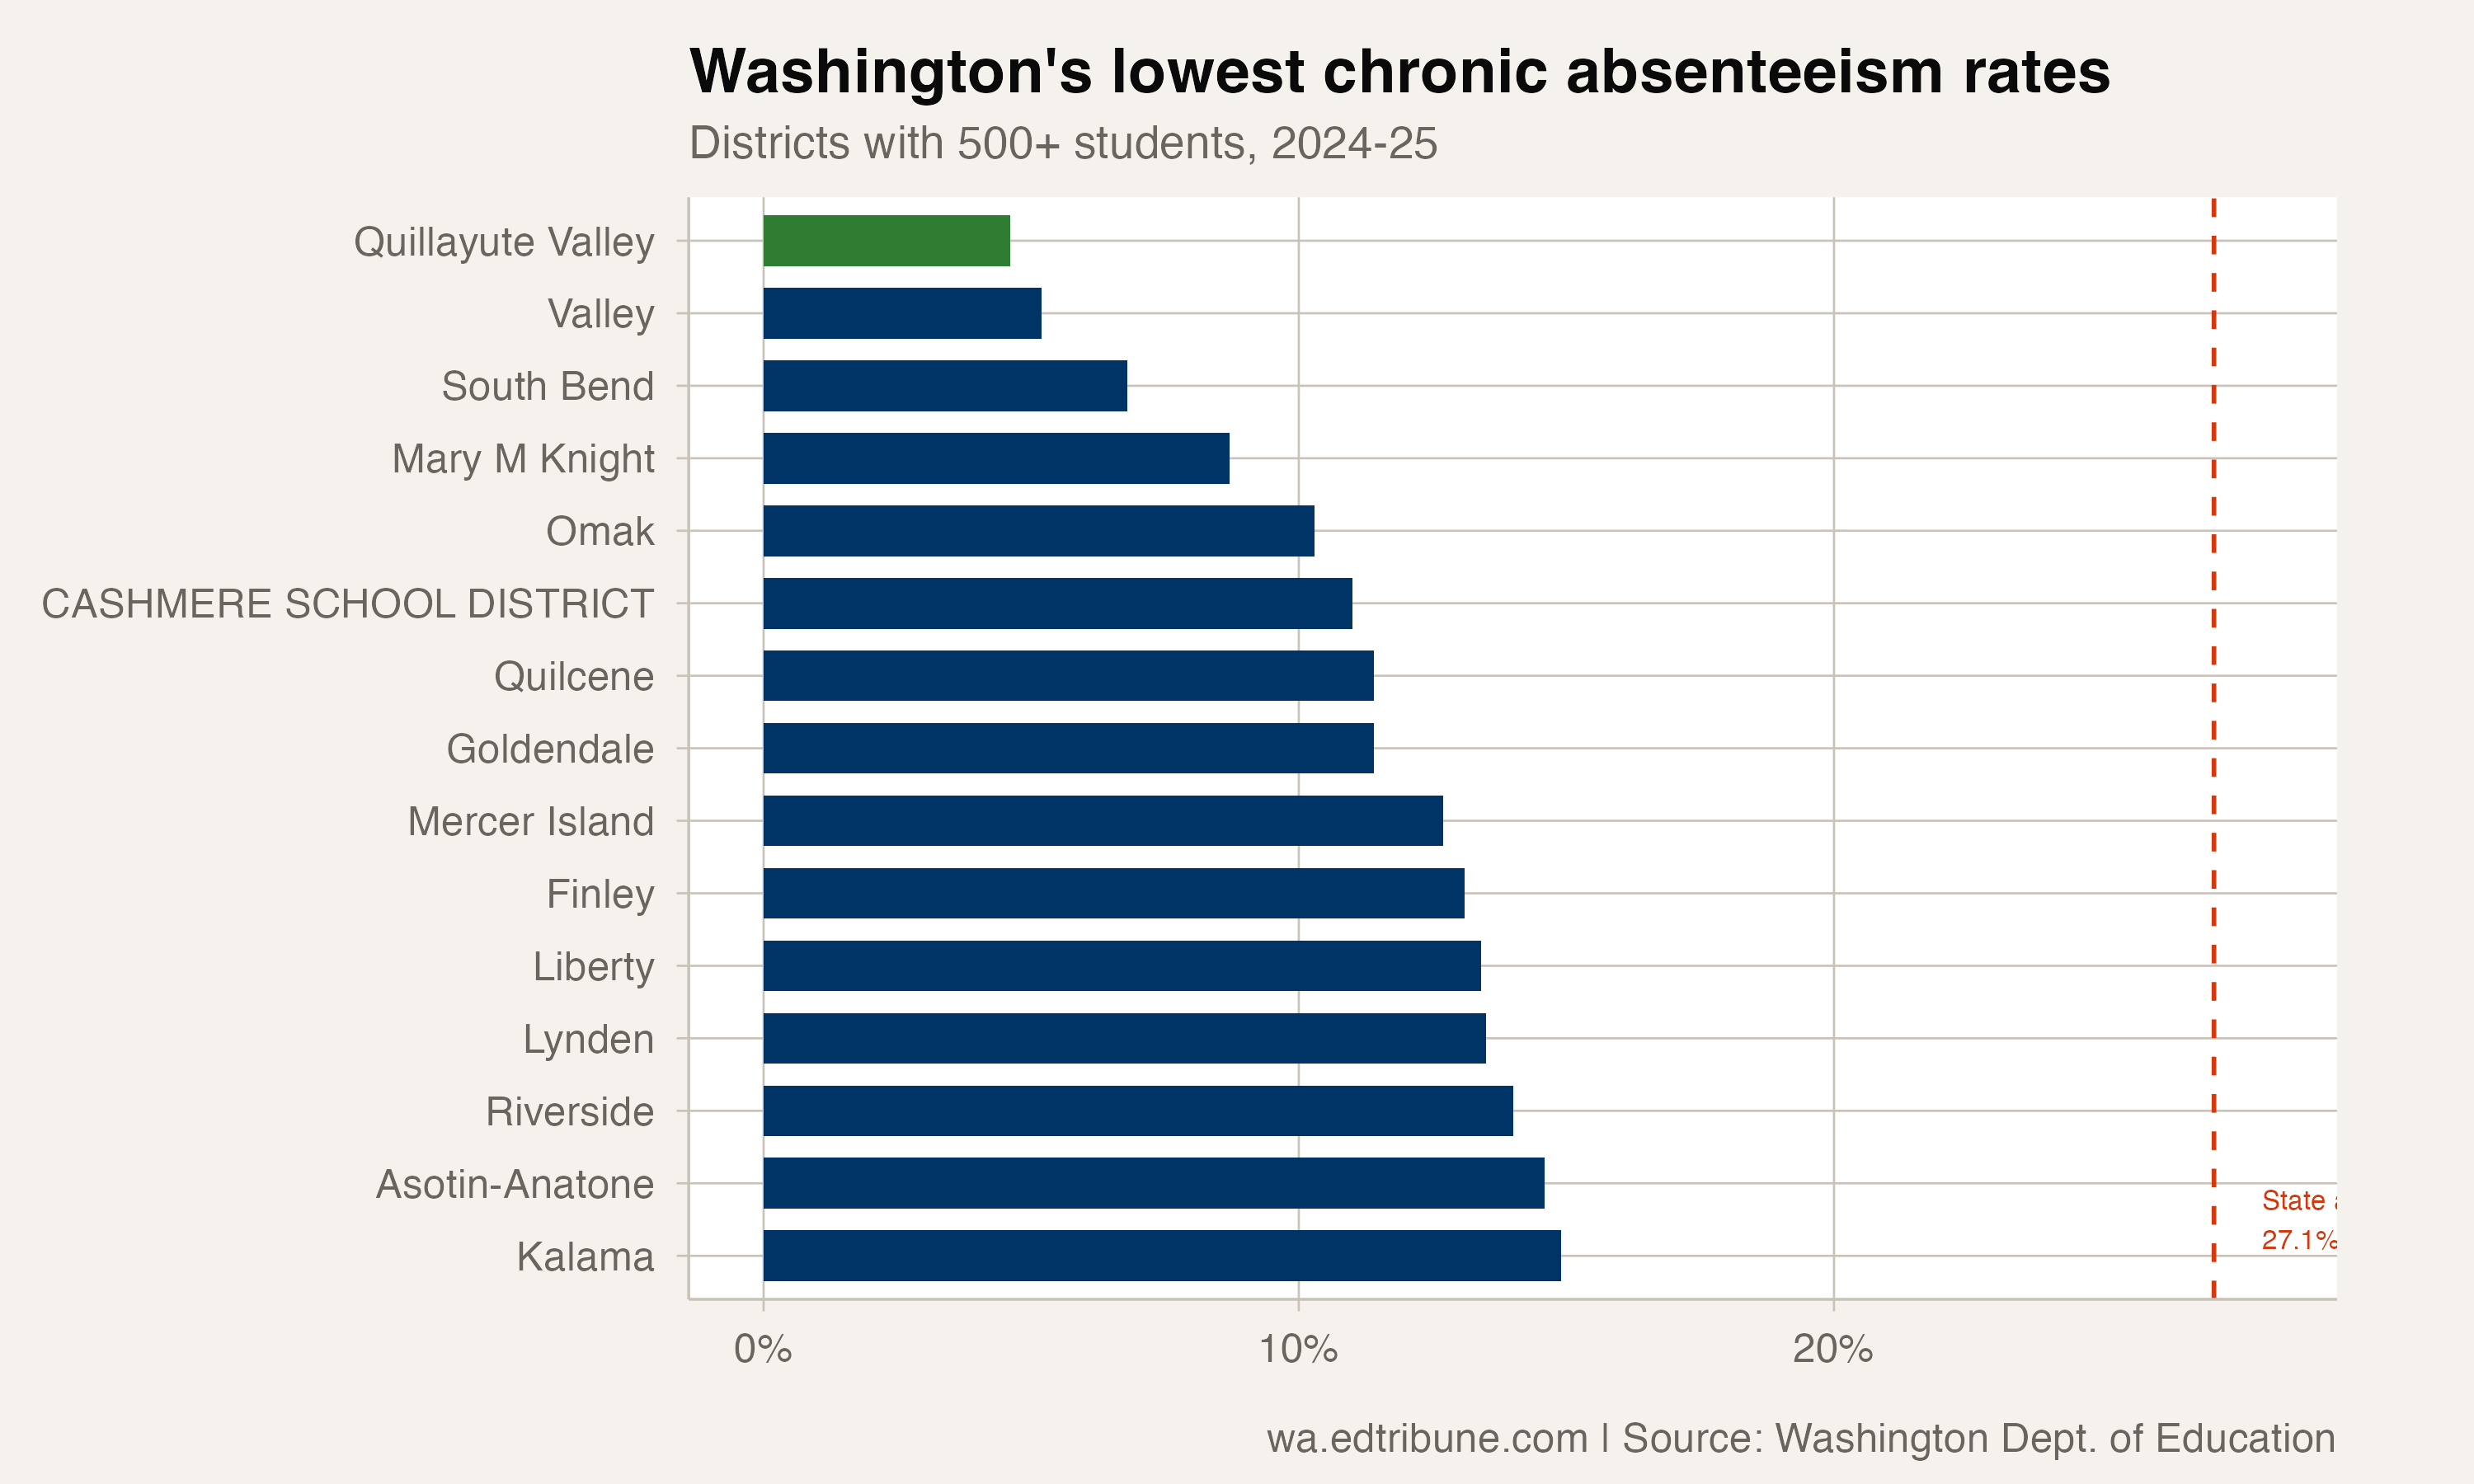
Correction (September 30, 2026): An earlier version of this article, headlined "Quillayute Valley's 4.6% Chronic Rate Is the Lowest in Washington," reported that Quillayute Valley had the lowest chronic absenteeism rate in the state and had stayed below the state average for 11 straight years. That district-wide rate mostly measures Insight School of Washington, a statewide online school the district hosts. In 2024-25 about 3,550 of the district's 4,480 students were enrolled there. The state reports Insight's attendance only as "above 99.9%" and prints no student counts for it, so those students count in the district total while adding almost nothing to its chronically absent count. The district's in-person schools in Forks had a 21.9% rate that year: below the state's 27.1%, but not the lowest in Washington, and above the state rate in every year before 2023-24. We rewrote the article around the in-person schools and replaced the charts. We also removed a list of the state's lowest-rate districts, which included two other districts that host online schools, and district-wide subgroup rates that had the same problem.
In 2024-25, 188 of the 870 students at the three in-person schools of Quillayute Valley School District↗ET in Forks were chronically absent. That is 21.6%, 5.7 points below Washington's statewide rate of 27.3%.
Three years earlier the same schools were well above the state. In 2021-22, 40.8% of their students were chronically absent, against 32.8% statewide. Since then the Forks schools have cut their rate by 19.2 points. The state cut its rate by 5.5.
From above the state rate to below it
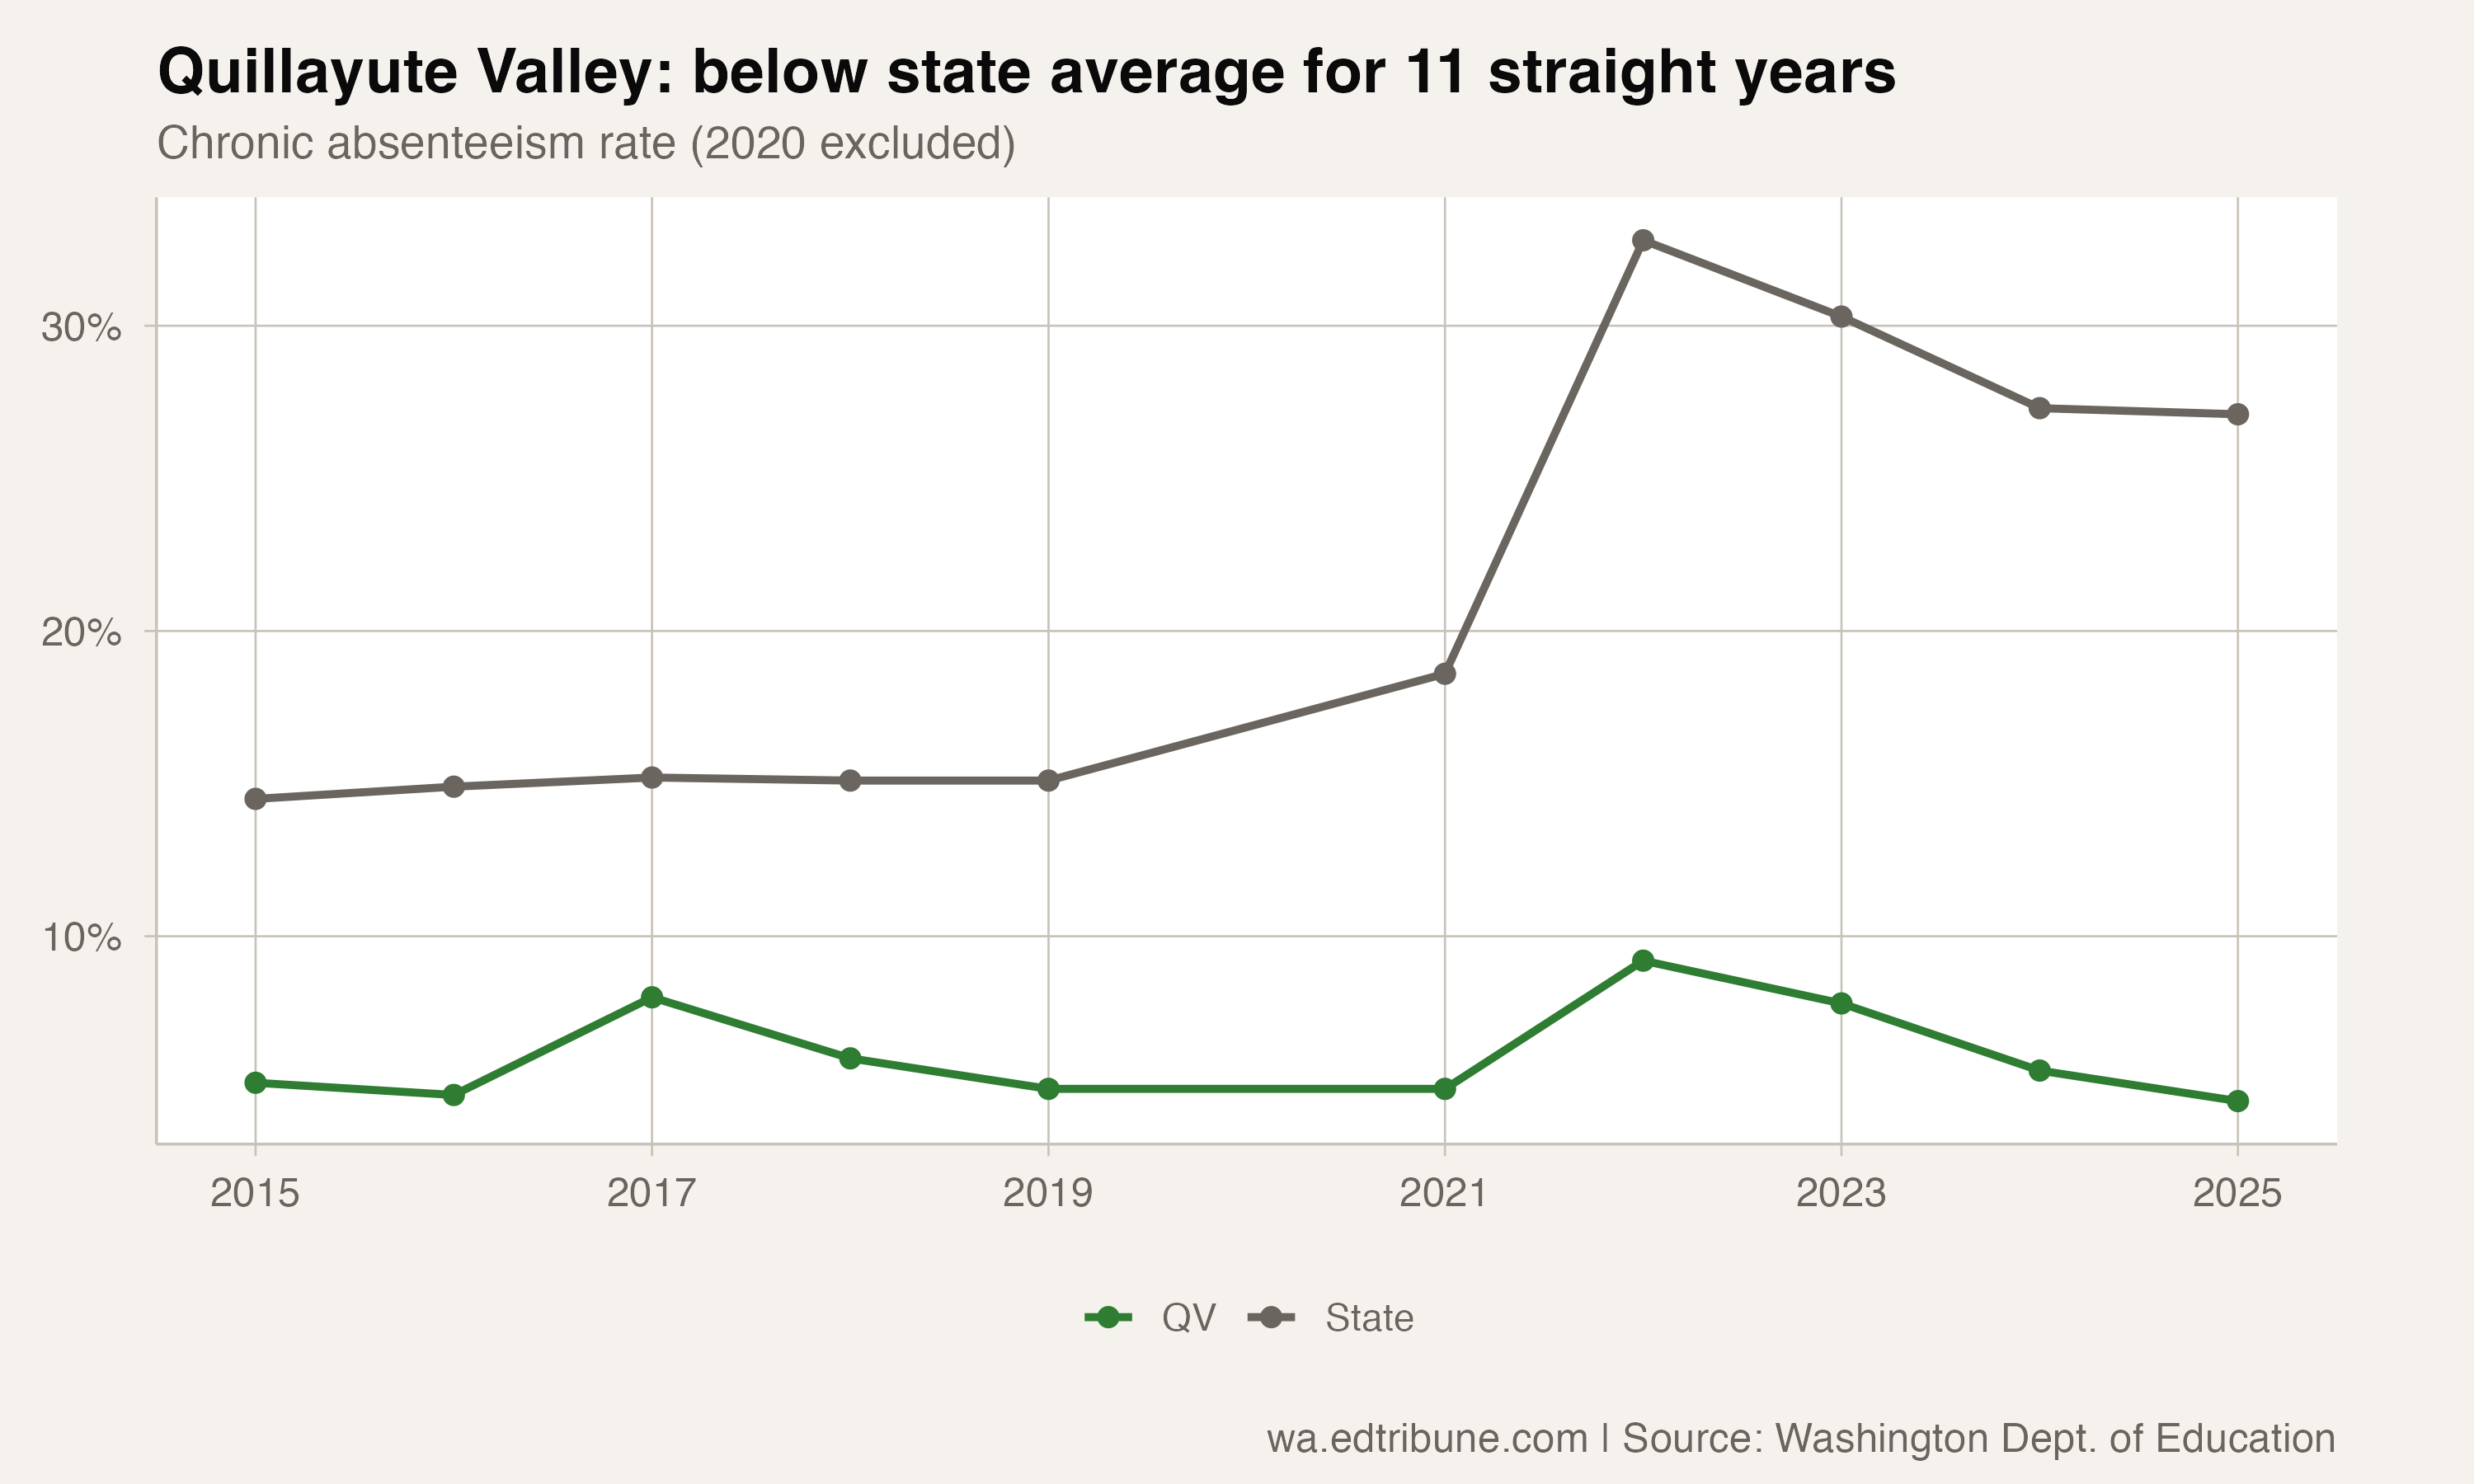
Before the pandemic, Forks ran a little above the state. In 2018-19 its in-person schools had an 18.0% chronic rate, compared with 15.1% statewide. Both rates jumped after schools reopened, and Forks jumped further.
The turn came afterward. In 2022-23 the Forks schools were at 31.3%, close to the state's 30.1%. By 2023-24 they had dropped to 23.9%, below the state's 27.4%, and they fell again to 21.6% in 2024-25 while the state barely moved.
Why the district-wide number is so much lower
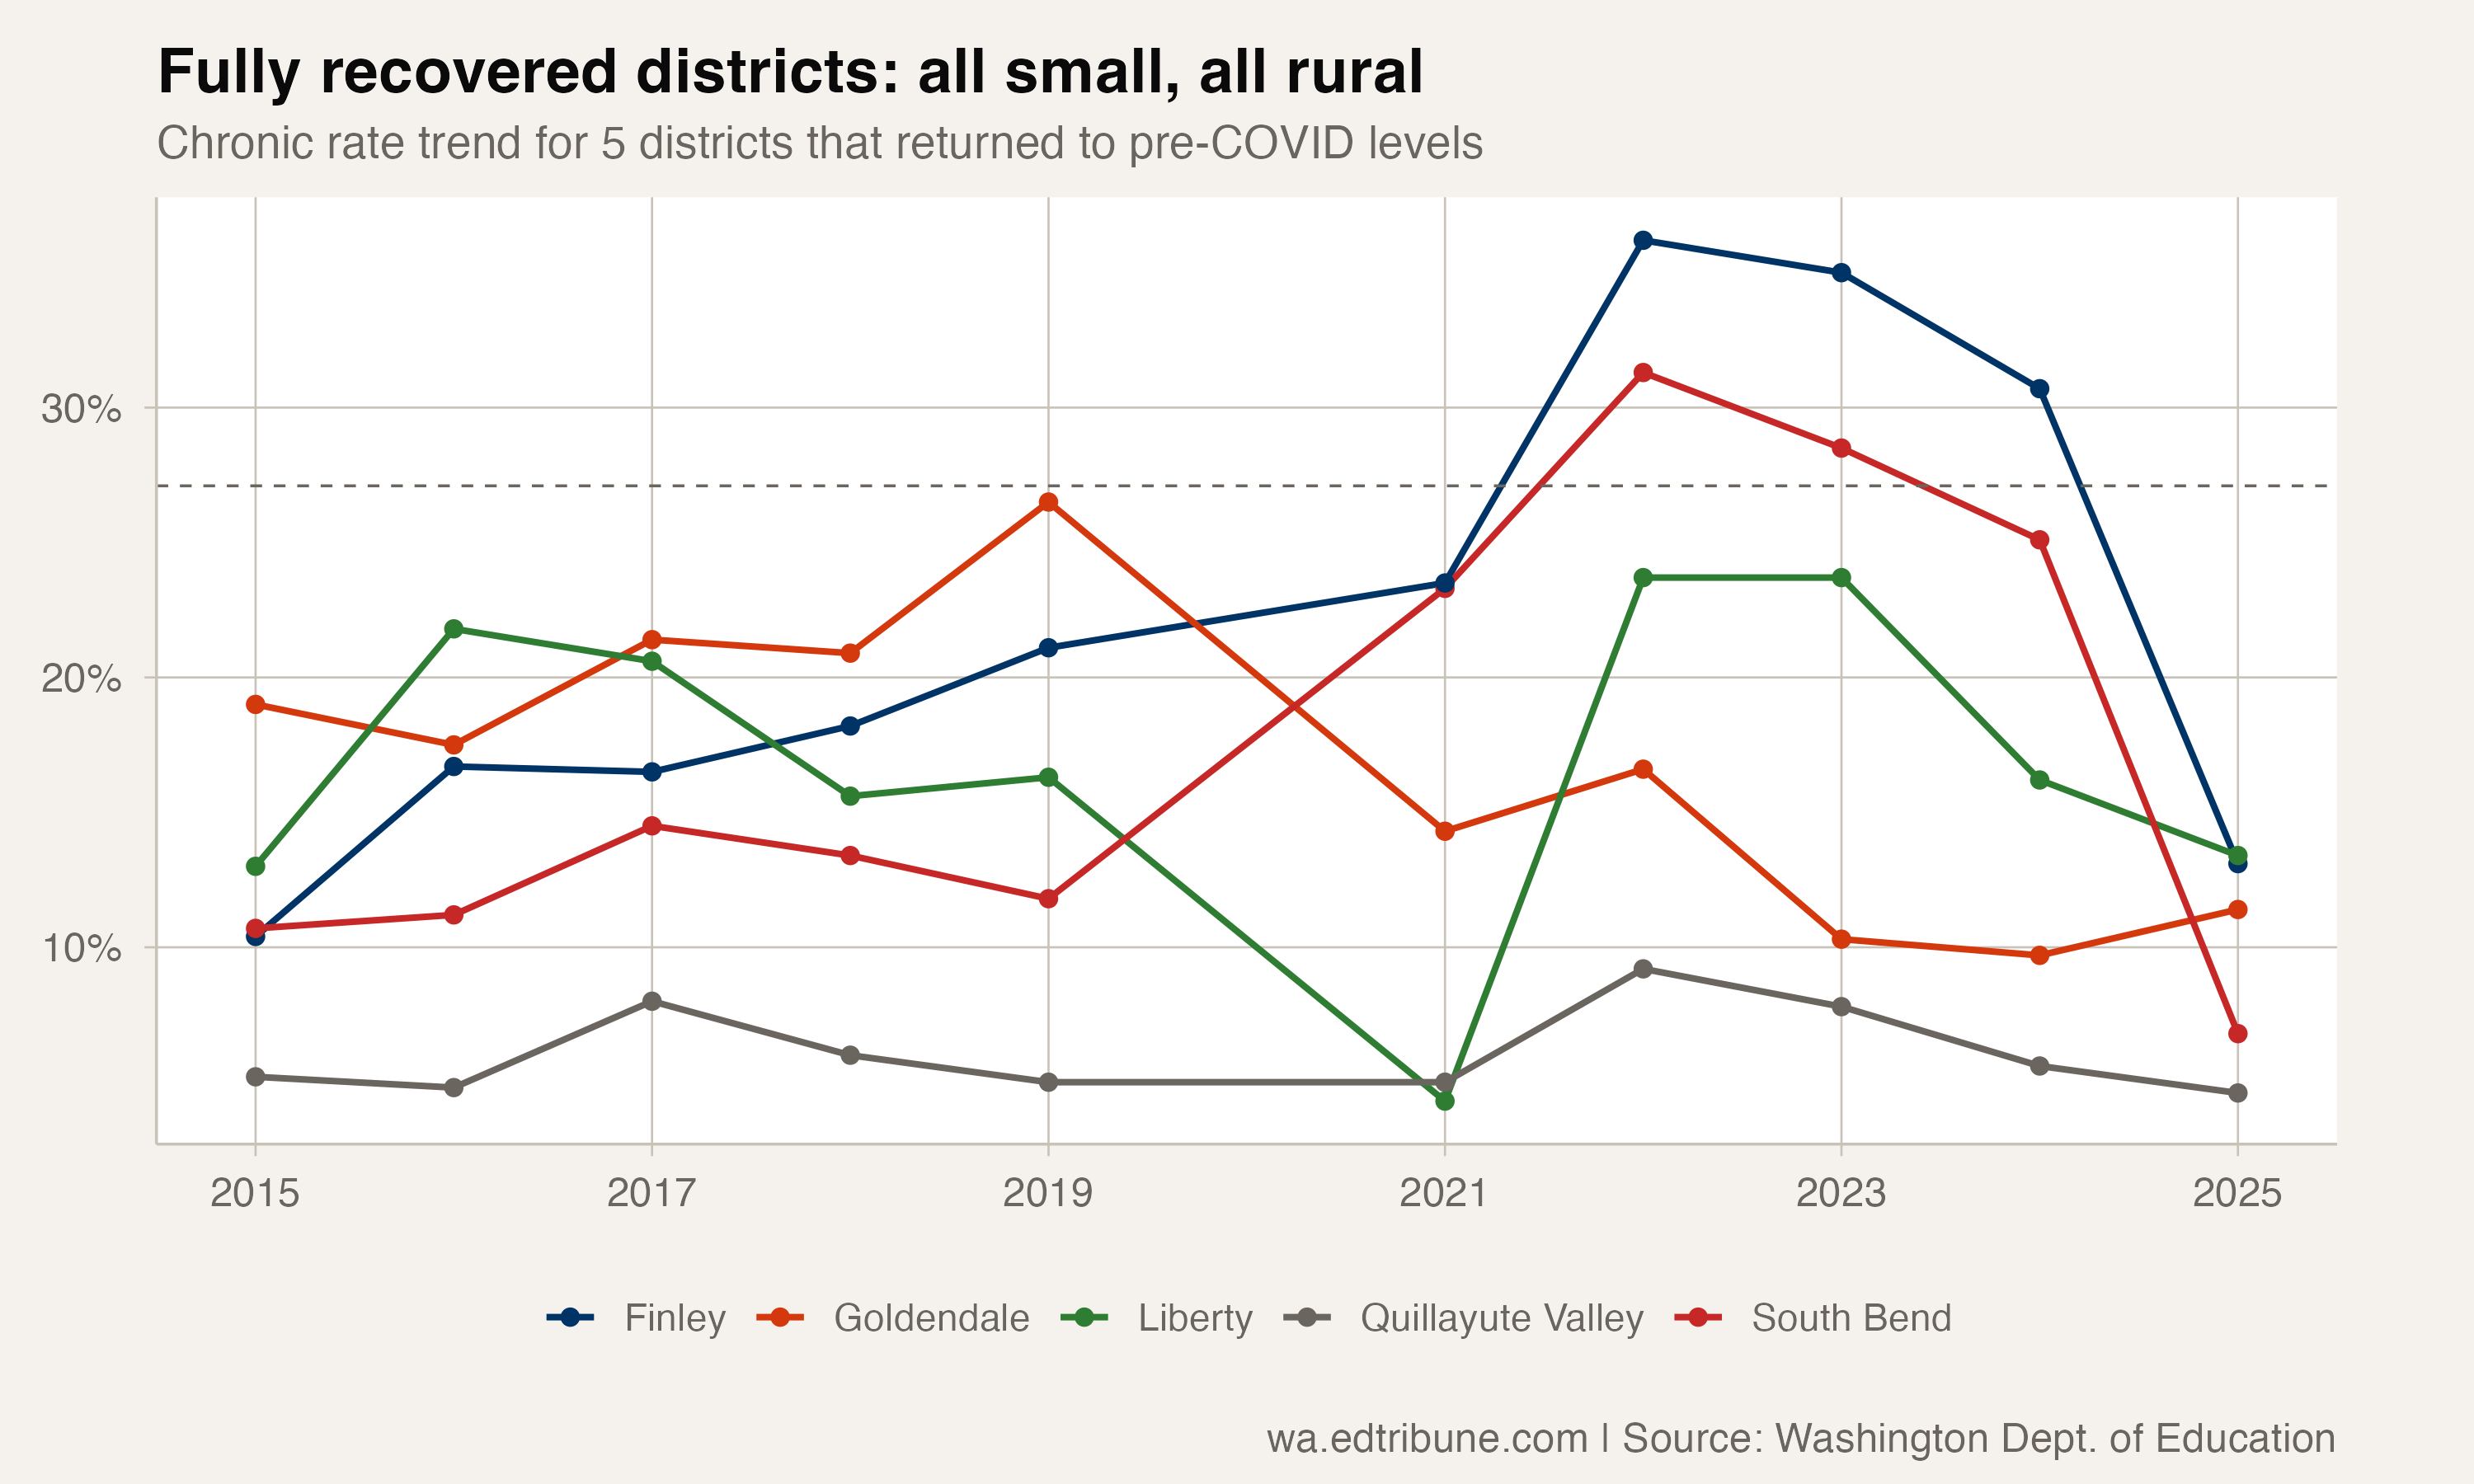
Quillayute Valley's own district-wide rate for 2024-25 is 4.5%, and that figure is the one that shows up in state rankings. It is not a good measure of attendance in Forks.
The district hosts Insight School of Washington, an online school that enrolls students from across the state. Of the district's 4,467 students, about 3,550 (79%) were not in any of its printed school rows, all of them in Insight's two programs. The state does not publish student counts for Insight. It reports only that more than 99.9% of its students attended regularly. Those students still count in the district total, which pulls the district-wide rate far below what its in-person schools record.
The in-person schools print full counts every year, so their combined rate is the fairer way to see how often Forks students miss school.
Lower rates across student groups
The Forks schools are below the state in each of the four student groups we compared. Among their 558 low-income students, 23.3% were chronically absent, against 35.4% for low-income students statewide. Hispanic students were at 16.9% (33.2% statewide). English learners were at 13.4% (32.5% statewide). Students in special education were at 25.5% (34.4% statewide).
The gap for English learners is the widest of the four. Statewide, English learners are among the students most likely to be chronically absent. In Forks they were less likely to be chronically absent than the school population as a whole.
What the numbers do and do not show
The Forks schools are small, and a few dozen students can move a rate several points in a year. Two years below the state average is a real change from where these schools stood before and just after the pandemic, not yet a long record.
What the data does show is a steady, steep decline since 2021-22 in how many Forks students miss a month or more of school, faster than the state's. That decline belongs to the in-person schools themselves, not to how an online school's attendance is counted.
Data from the Washington Office of Superintendent of Public Instruction. In-person schools are the printed Quillayute Valley school rows, excluding Insight School of Washington, its Open Doors program, and the district's home-school program. Analysis covers 2014-15 through 2024-25; the partial pandemic year 2019-20 is excluded from comparisons.
Detailed code that reproduces the analysis and figures in this article is available exclusively to EdTribune subscribers.
Discussion
Sign in to join the discussion.
Loading comments...