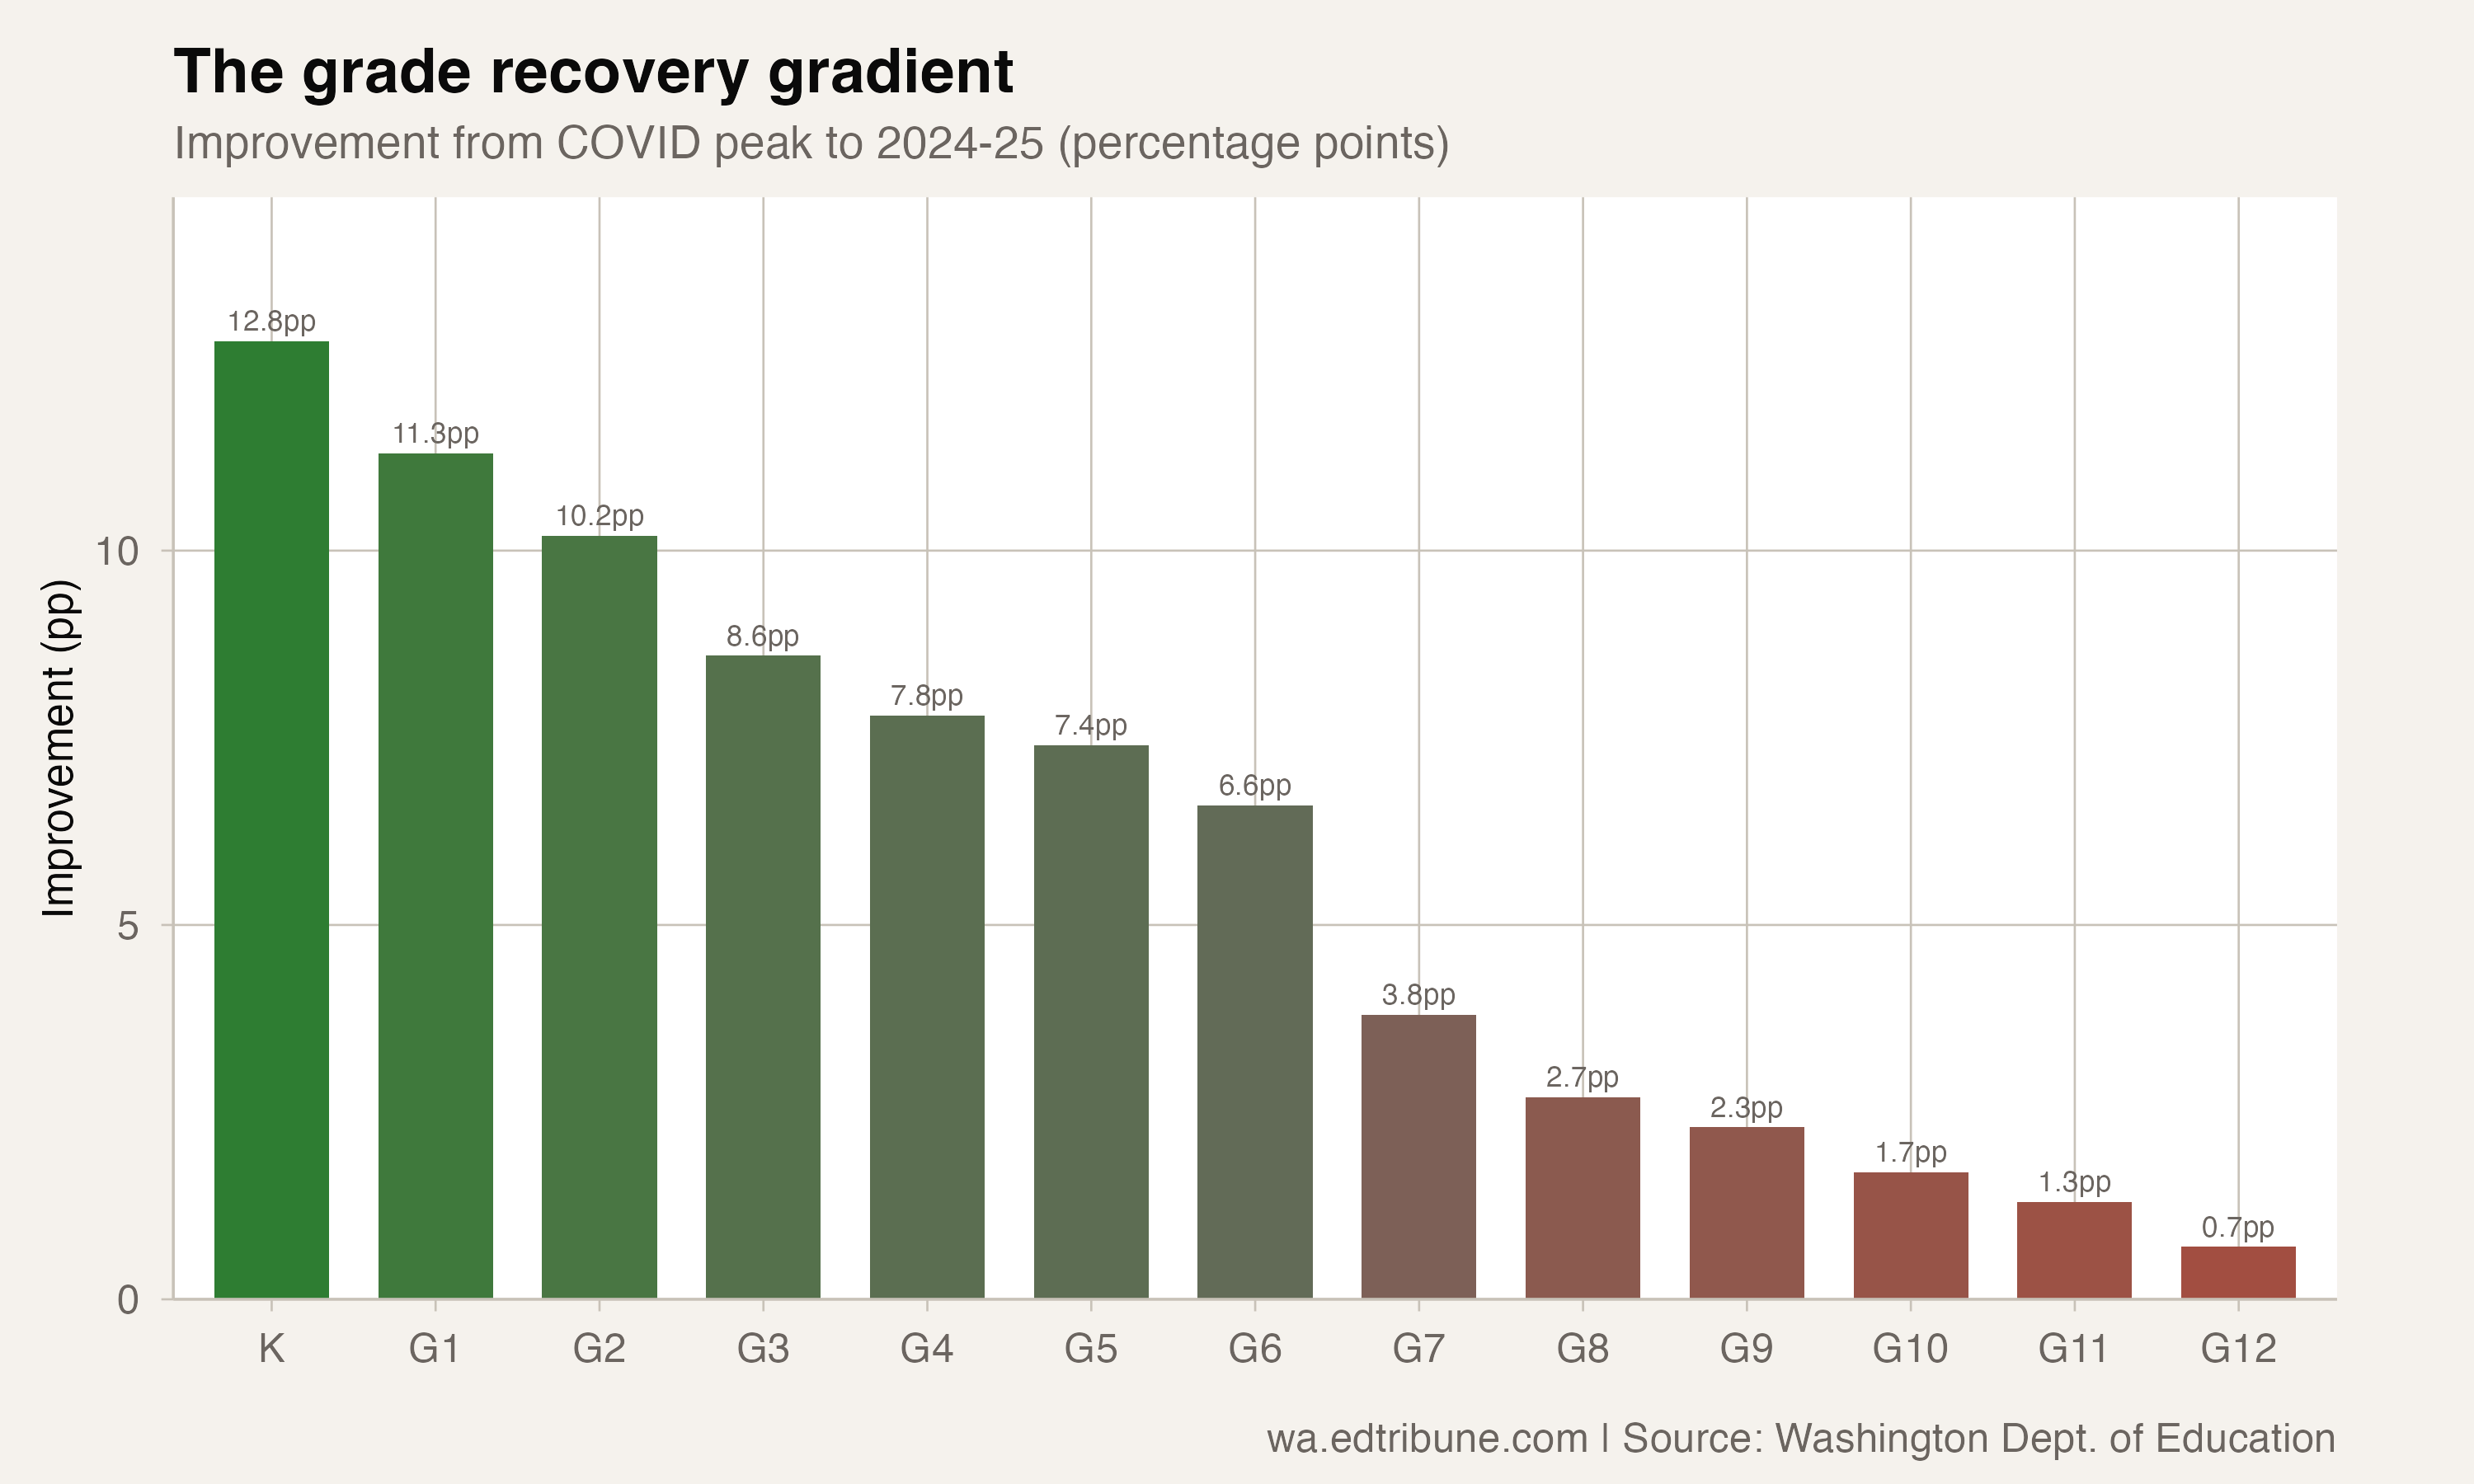
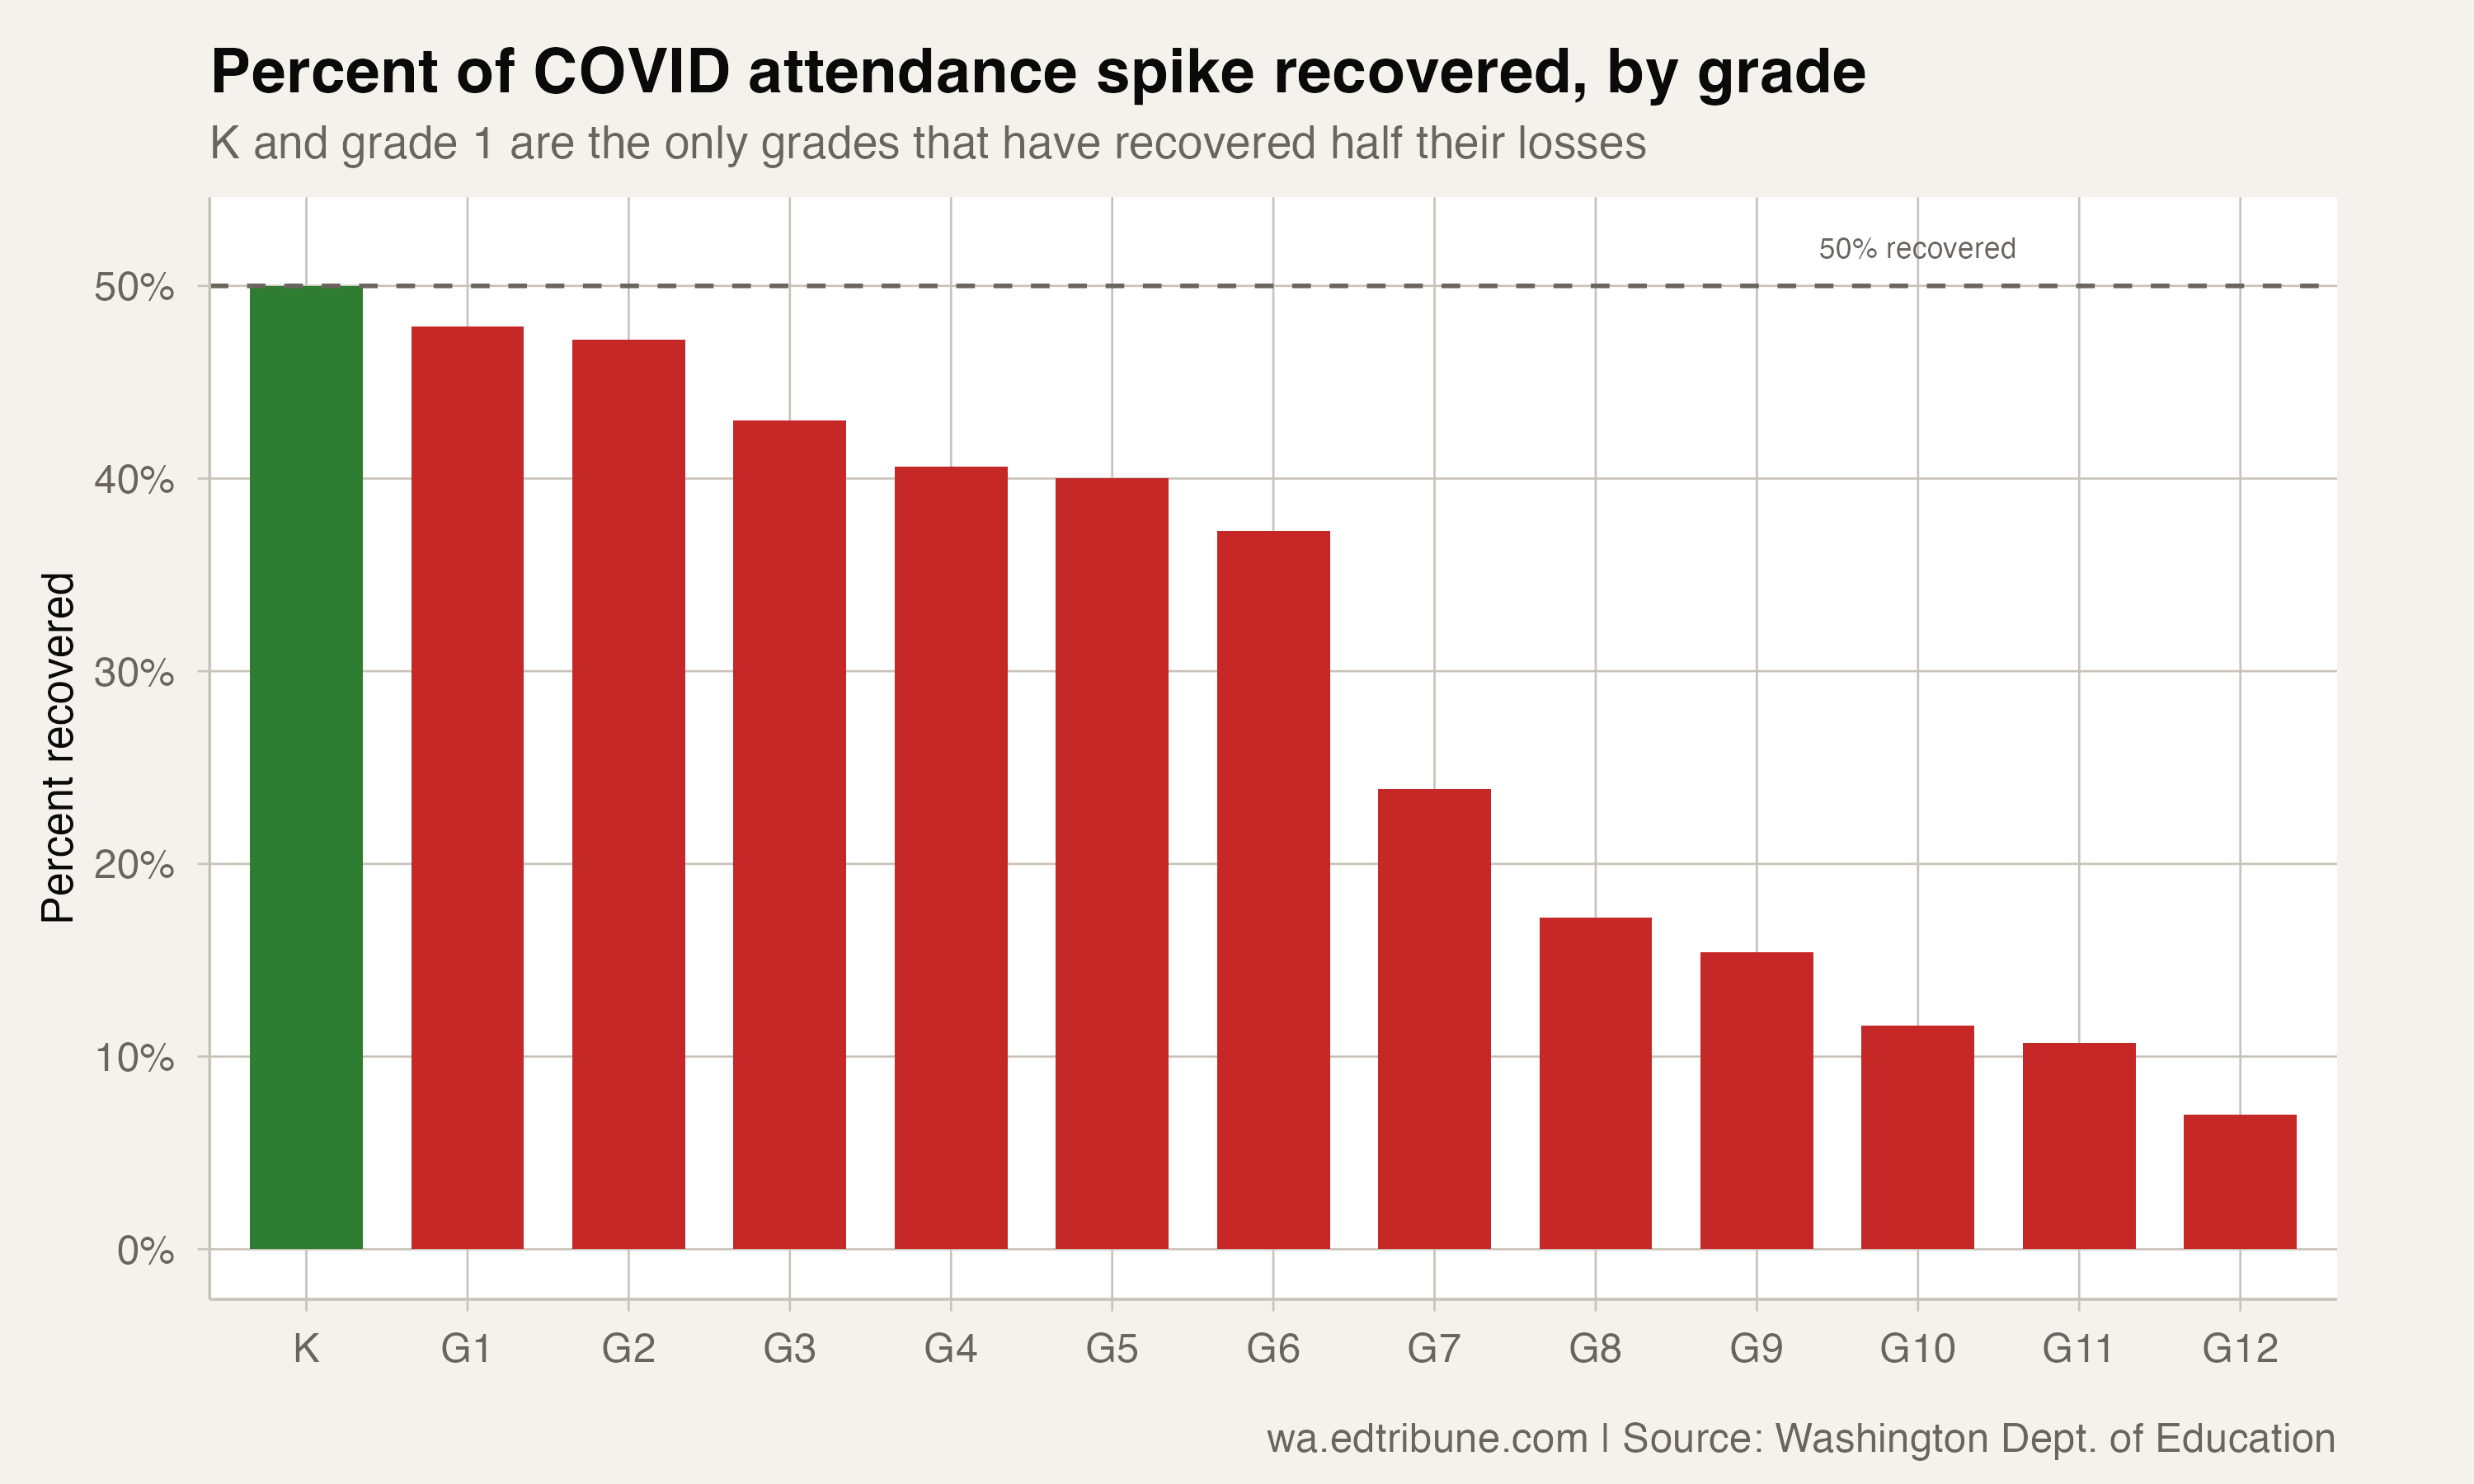
Correction (October 11, 2026): Washington's Office of Superintendent of Public Instruction republished its attendance files on September 30, 2026, with recalculated counts, and this article now uses the restated figures. Kindergarten's improvement from its pandemic peak is 12.4 points, not 12.8, and grade 12's is 0.8 points, not 0.7, measured from a peak of 38.4% in 2022-23 rather than 38.2% in 2021-22; the headline has been updated. An earlier version said kindergarten had recovered half the ground it lost. In the restated data it has recovered 48.4%, and no grade has recovered half. The grade-by-grade gradient itself is unchanged.
The recovery from Washington's attendance crisis follows a pattern so consistent it could be drawn with a ruler. Kindergarten has improved 12.4 percentage points from its COVID peak. First grade: 11.0. Second grade: 9.8. Each successive grade shows less recovery, descending in near-perfect steps until grade 12, where the chronic absenteeism rate of 37.6% has improved just 0.8 points from its 38.4% peak in 2022-23.
The gradient is not approximate. It is monotonic: every single grade recovered less than the grade below it, all 13 grades in order.
The staircase
No grade has recovered half the ground lost during the pandemic. Kindergarten comes closest, at 48.4%. First grade is at 46.6%. By fourth grade, recovery has dropped below 40%. Middle school grades (7th and 8th) have recovered less than a quarter of their spike. And the four high school grades, 9th through 12th, have recovered between 8% and 15%.
The gradient divides Washington's 1.09 million students into three tiers:
- Kindergarten (72,447 students): recovering, nearly half the way back
- Grades 1-6 (485,771 students): meaningful improvement, 37.5-46.6% recovered
- Grades 7-12 (527,599 students): barely improving, less than 25% recovered
The students in grades 7-12 represent nearly half of total enrollment. Their near-stalled recovery is the primary reason Washington's statewide rate has plateaued.
K and 12: diverging trajectories
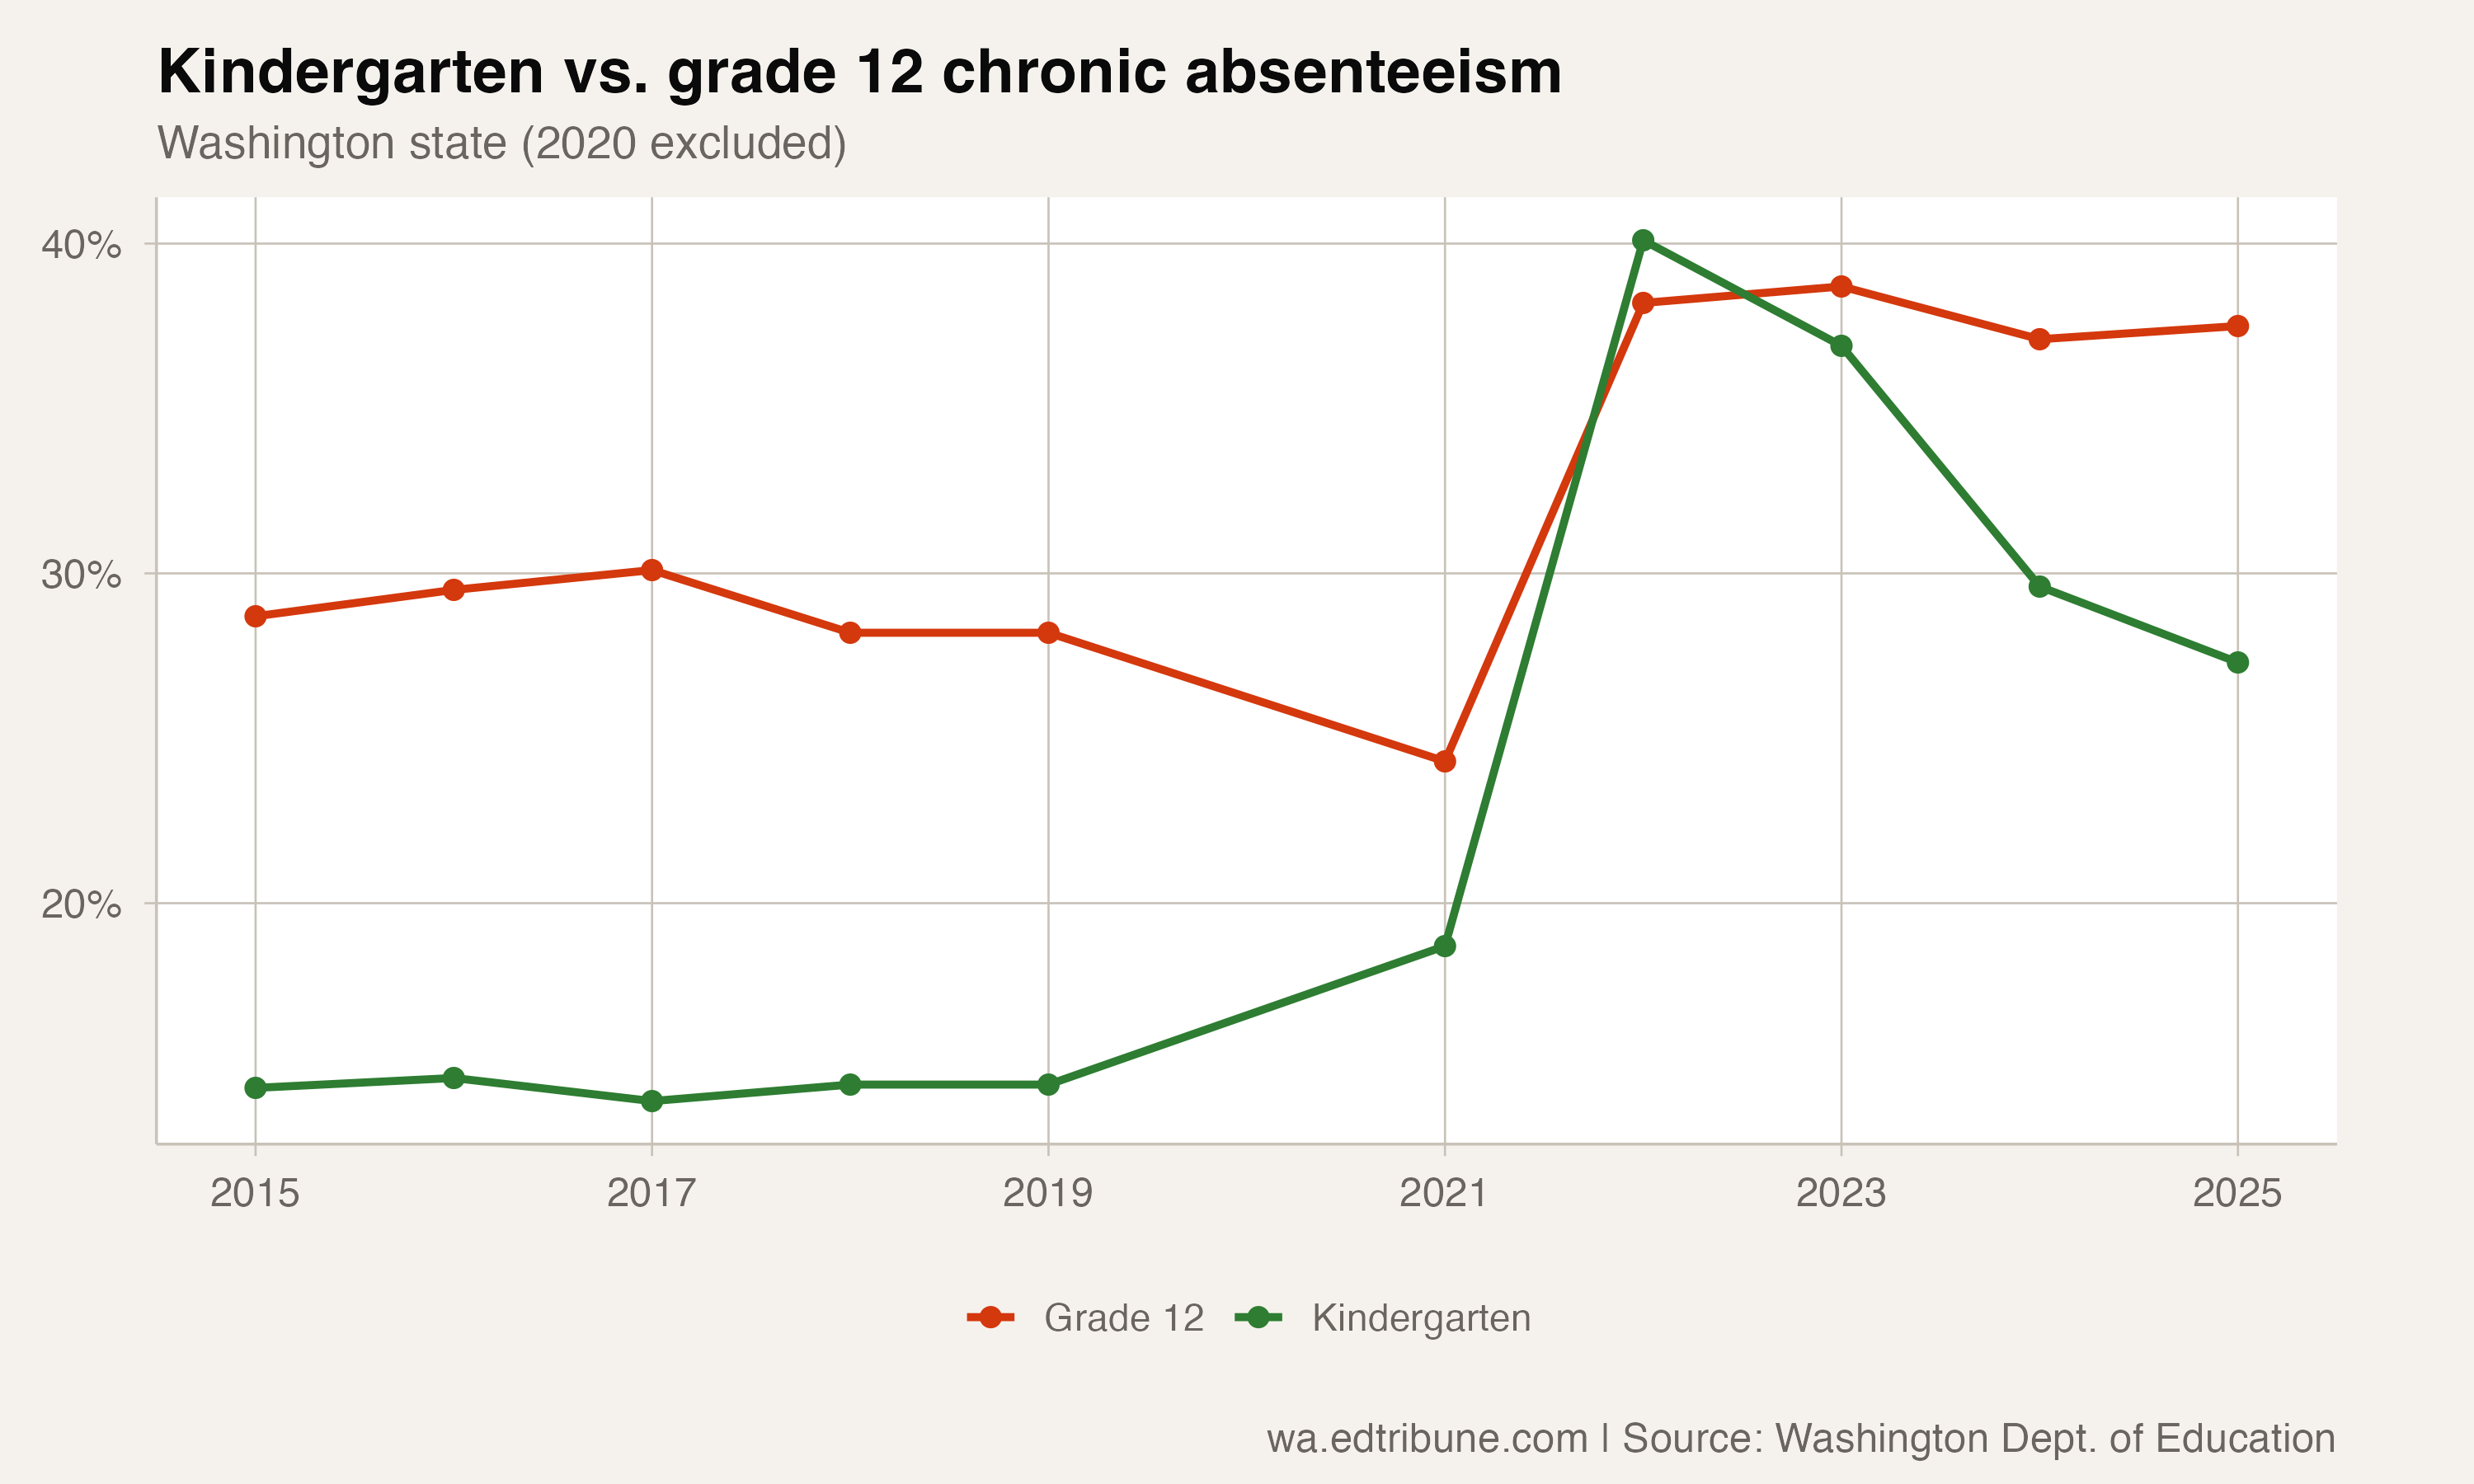
Before the pandemic, the chronic absenteeism gap between kindergarten and 12th grade was large but stable: kindergartners were at 14.4% and seniors at 28.1%, a 13.7-point spread that reflected the well-documented pattern of rising absenteeism through adolescence.
COVID temporarily compressed this gap. In 2021-22, kindergarten spiked to 40.0% and 12th grade to 38.2%, nearly identical rates. The pandemic, in effect, made every grade equally bad at attendance.
The recovery has pulled them apart again, but unevenly. Kindergarten dropped to 27.6% while 12th grade barely moved, to 37.6%. The gap is now 10.0 points, narrower than before the pandemic but for all the wrong reasons: it narrowed because kindergarten came down, not because 12th grade did.
What the gradient means
The monotonic gradient has several implications. First, it suggests that the ability to rebuild attendance habits is strongly related to developmental stage. A kindergartner who was remote during the pandemic and returned to in-person school had time to establish attendance norms in the early grades. A student who was in 8th grade when COVID hit spent their formative high school years without consistent attendance expectations and may never have established them.
Second, the gradient implies a cohort effect. The students now in 12th grade were in 8th or 9th grade when the pandemic began. They experienced maximum disruption during the transition to high school, which is already a vulnerable period for attendance. Younger cohorts have had more years of in-person schooling since COVID, but the early evidence from grades 7 and 8, with recovery rates under 25%, suggests that middle school is where the elementary gains start bleeding away.
Third, the gradient has workforce implications. Grade 12 students with 37.6% chronic absenteeism were the cohort entering the workforce or college after the 2024-25 school year. About 36,000 seniors were missing a month or more of school in their final year of education. The downstream effects on graduation rates, credential completion, and post-secondary readiness will be measurable.
Still 10-13 points above normal
Even the most-improved grades remain far from pre-pandemic levels. Kindergarten at 27.6% is still 13.2 points above its 2019 rate of 14.4%. Third and fourth grade, both at 20.8%, are 11.8 and 11.6 points above their baselines. The recovery gradient shows that younger grades are heading in the right direction, but none of them has arrived.
The total number of students still above pre-pandemic attendance norms spans every grade. Across all 13 grades tracked, the average gap from the 2019 baseline is 11.9 percentage points. Washington's attendance crisis is recovering from the bottom up, grade by grade, but the upper grades show no sign of following.
Data from the Washington Office of Superintendent of Public Instruction. Grade-level chronic absenteeism rates for K-12. Pre-K excluded (limited data). The 2019-20 school year excluded due to COVID-related attendance tracking anomalies.
Detailed code that reproduces the analysis and figures in this article is available exclusively to EdTribune subscribers.
Discussion
Sign in to join the discussion.
Loading comments...