In 2022, 42.0% of students in Castle Rock↗ET School District were chronically absent. Three years later, that rate had fallen to 19.3%, a 22.7-point improvement.
The drop was not a one-year anomaly. Castle Rock improved in each of the three years since its peak: 42.0% to 31.3% to 26.6% to 19.3%. That trajectory places the district 8.0 points below the state average of 27.3% and within striking distance of its pre-pandemic rate of 15.3%.
Five Major Groups Improved
The decline appears across each of the five major student groups examined here.
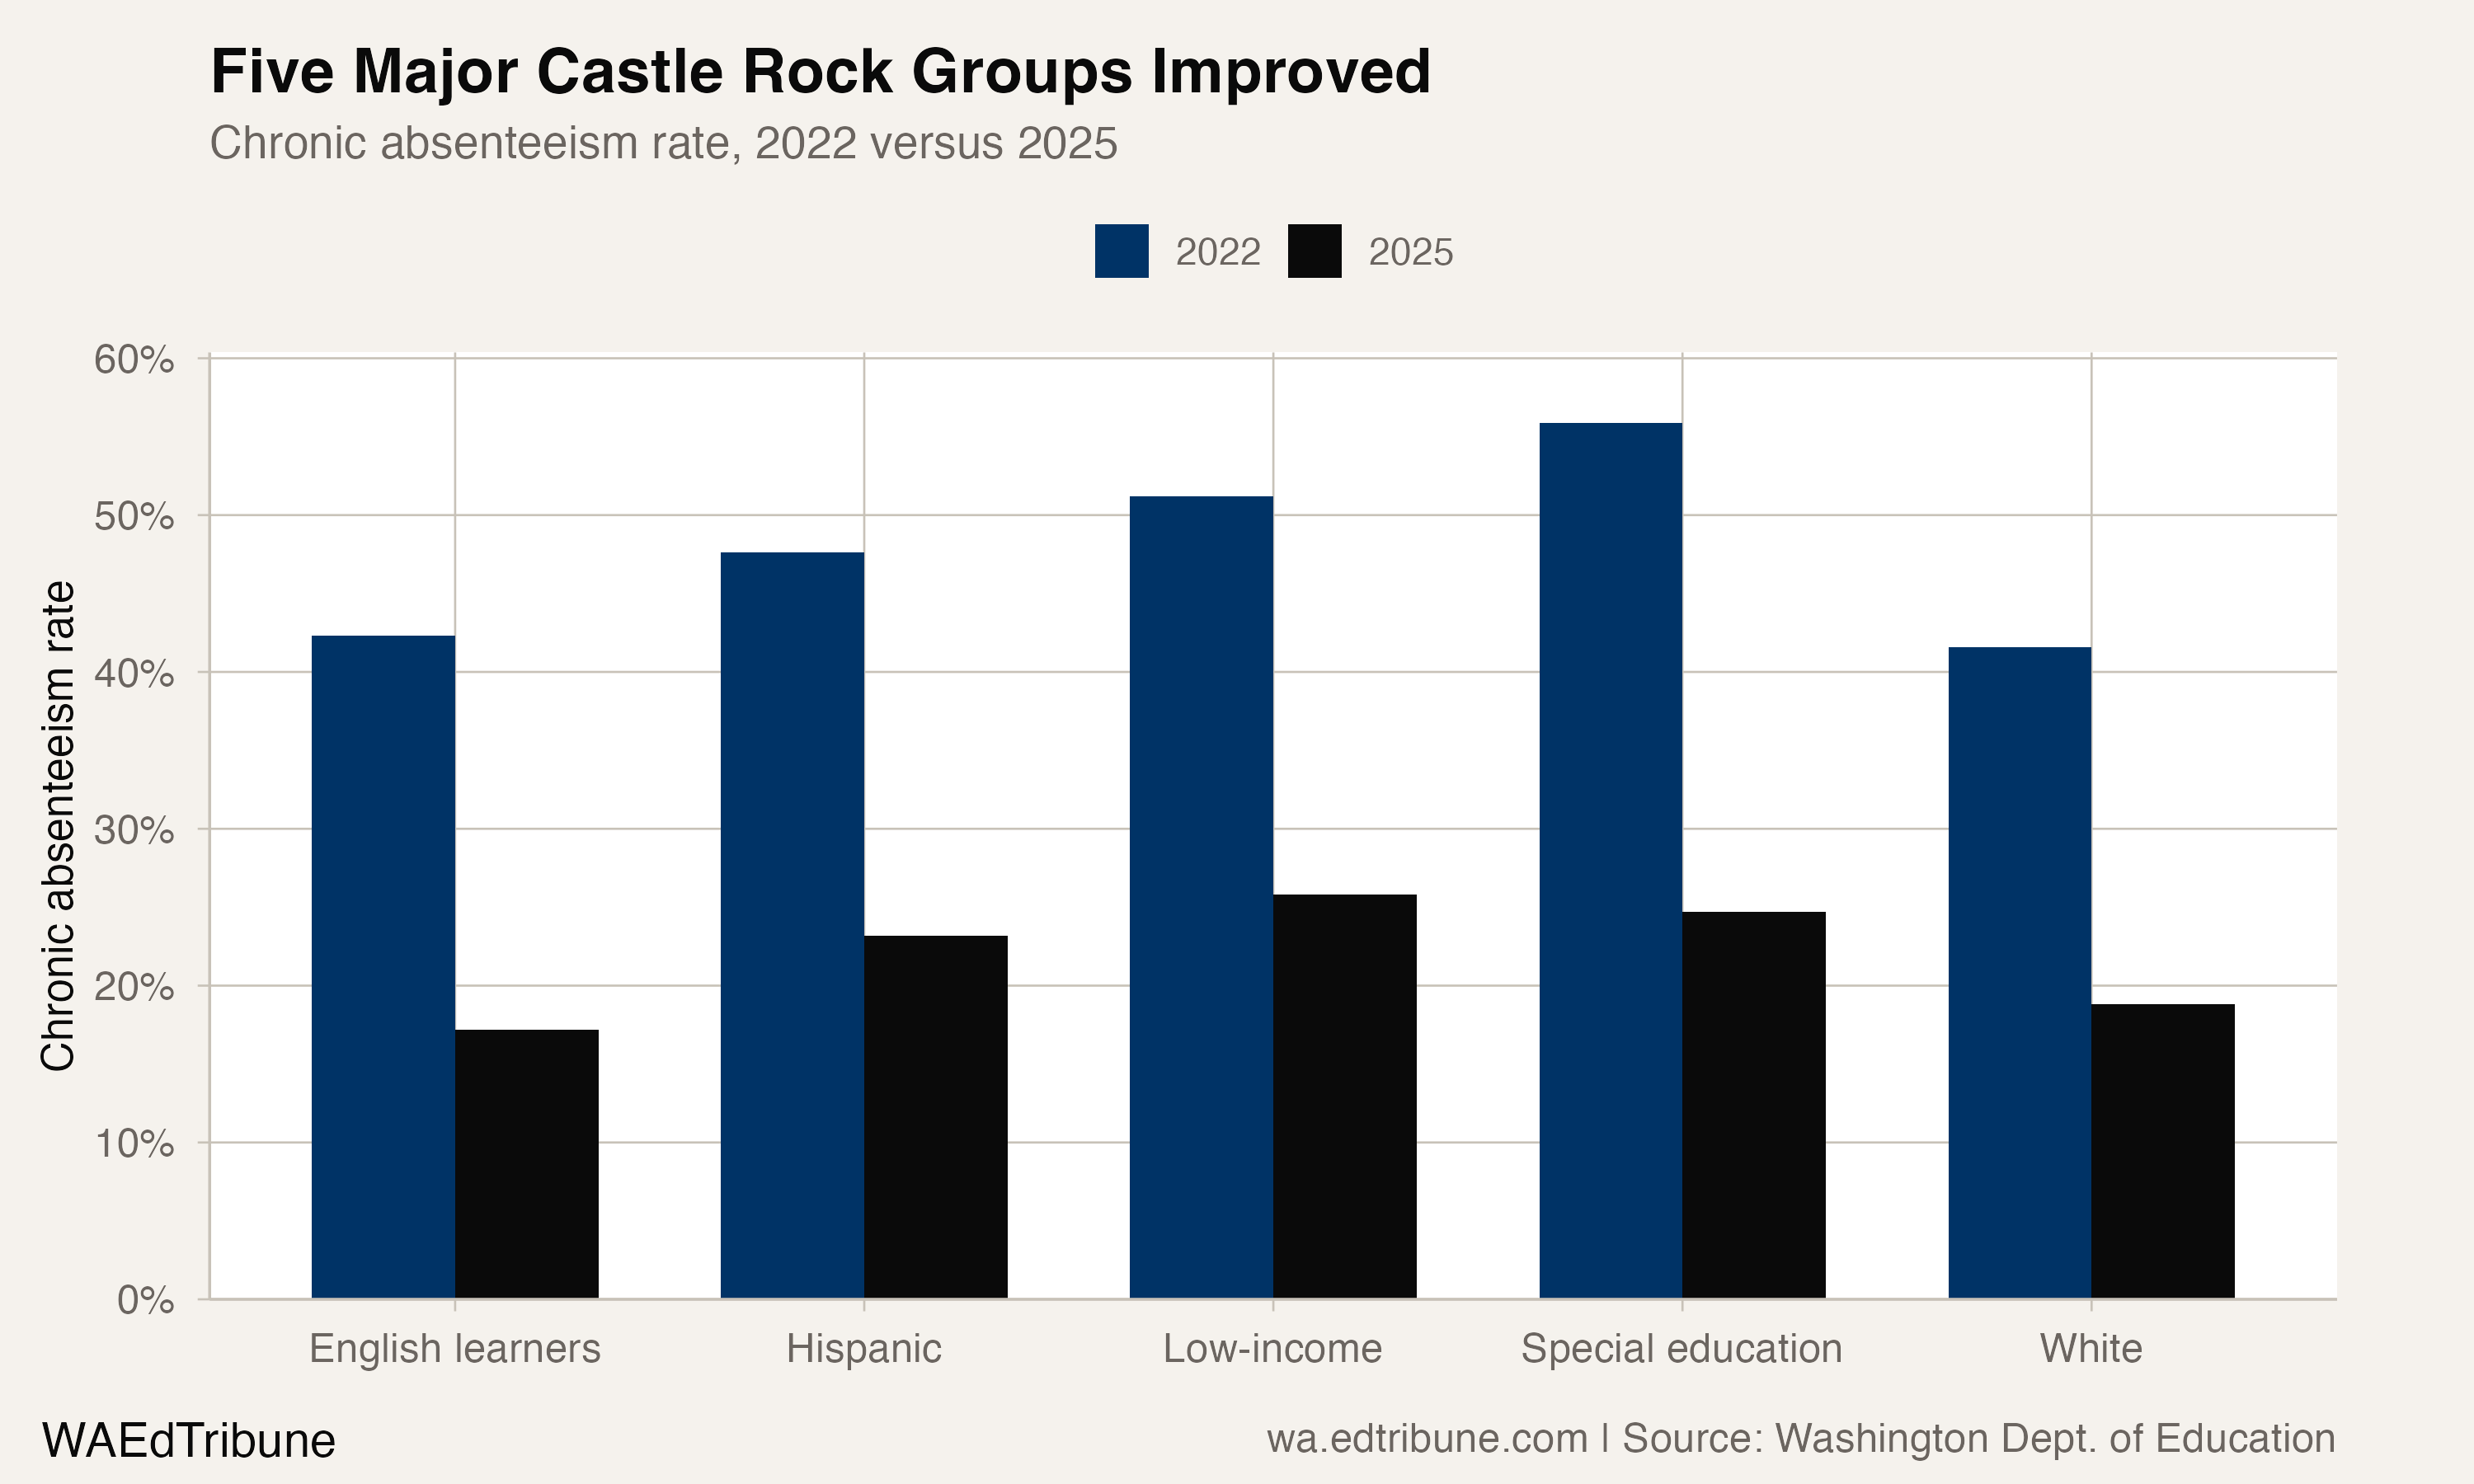
Low-income students saw their rate fall from 51.2% to 25.8%, a drop of 25.4 points. Special education students improved from 55.9% to 24.7%, a 31.2-point reduction. English learners went from 42.3% to 17.2%.
White students, 1,225 of the district's 1,458 students in 2025, dropped from 41.6% to 18.8%. Hispanic students fell from 47.6% to 23.2%.
A Three-Year Descent
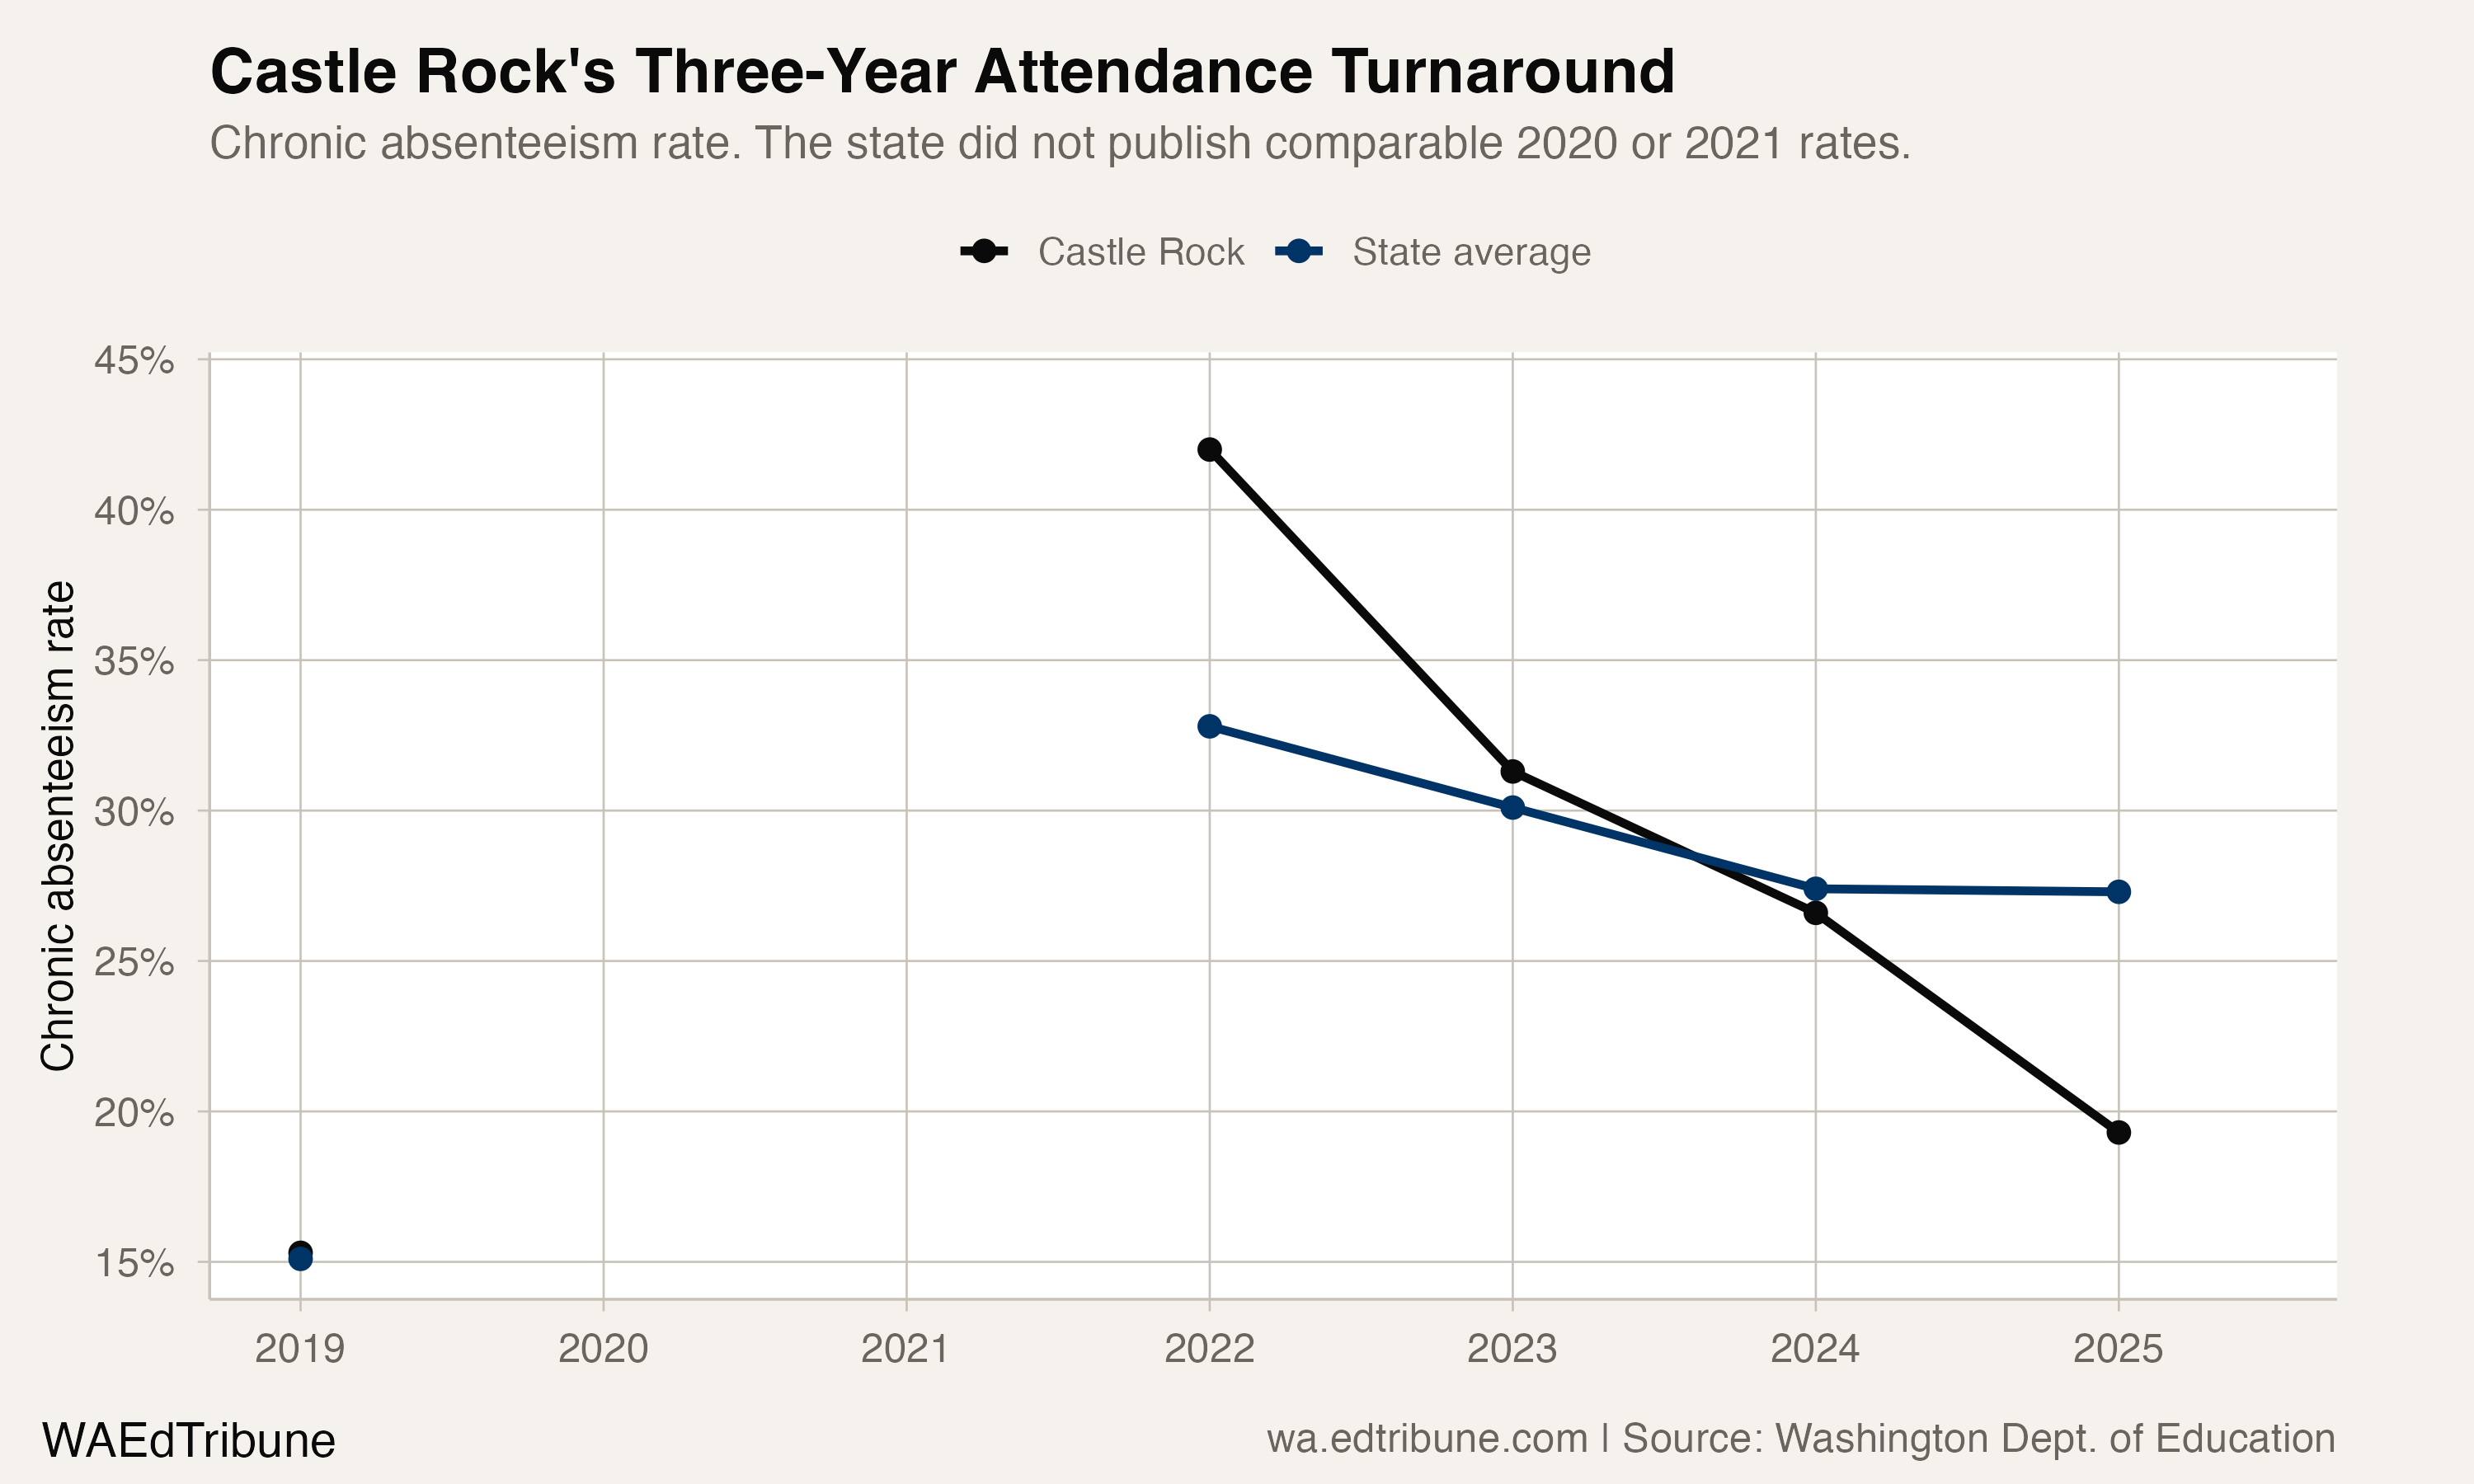
Castle Rock's pre-pandemic rate was 15.3% in 2019. By 2022, it had risen to 42.0%, a spike of 26.7 points. What followed was a year-by-year descent: a 10.7-point drop in 2023, another 4.7 in 2024, and 7.3 more in 2025.
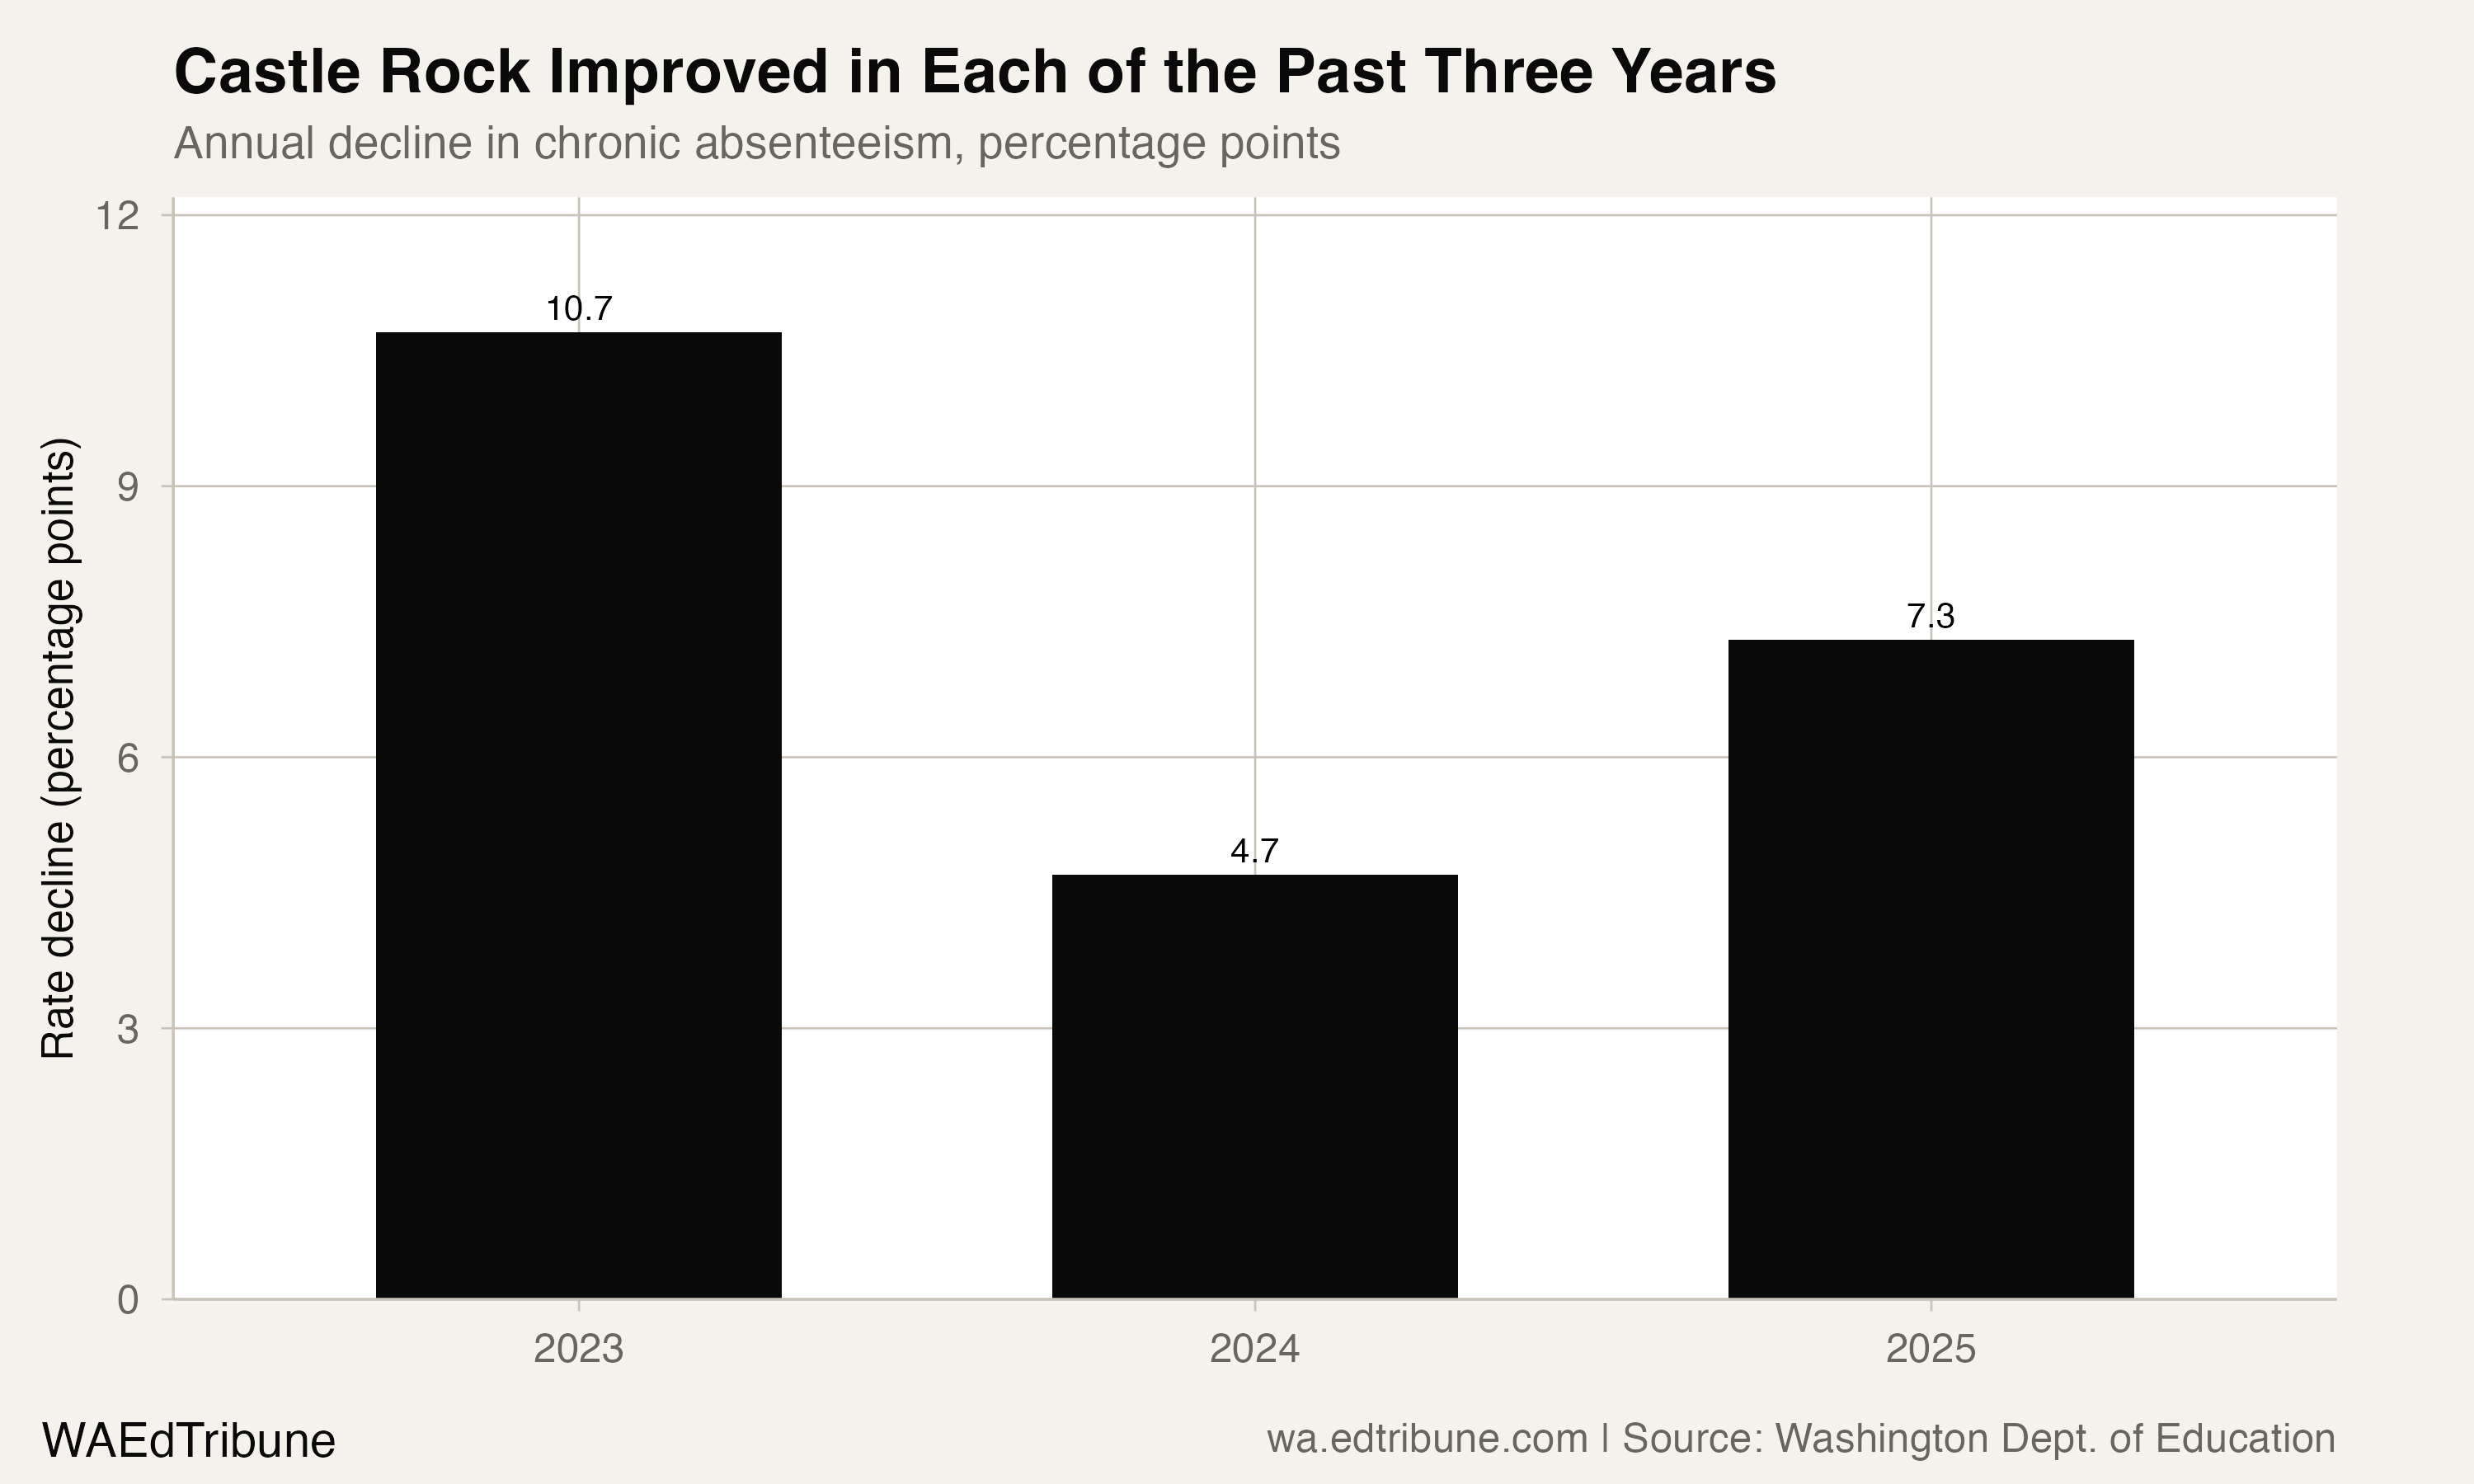
The 2025 improvement of 7.3 points was the second-largest of the three annual declines. Castle Rock's rate fell faster in 2025 than it had in 2024.
Context and Caveats
Castle Rock enrolled 1,458 students in 2025, up from 1,386 in 2022, a 5.2% increase. The falling absence rate therefore did not result from a shrinking published enrollment denominator.
In 2024-25, the most recent year the state has published, Castle Rock was 4.0 points above its pre-pandemic rate of 15.3%. The next few years will show whether this turnaround has a floor or whether the district can push back to where it was before COVID reshaped attendance patterns across rural Washington.
Detailed code that reproduces the analysis and figures in this article is available exclusively to EdTribune subscribers.
Discussion
Sign in to join the discussion.
Loading comments...