Washington's most recent published graduation results available for this analysis cover the Class of 2025, representing the 2024-25 school year. They are historical results, not current 2026-27 outcomes.
Tacoma↗ET Public Schools' four-year graduation rate was 91.4% for that class, 8.8 points above the state rate. The published cohort included 2,025 students, and 1,851 earned a diploma within four years.
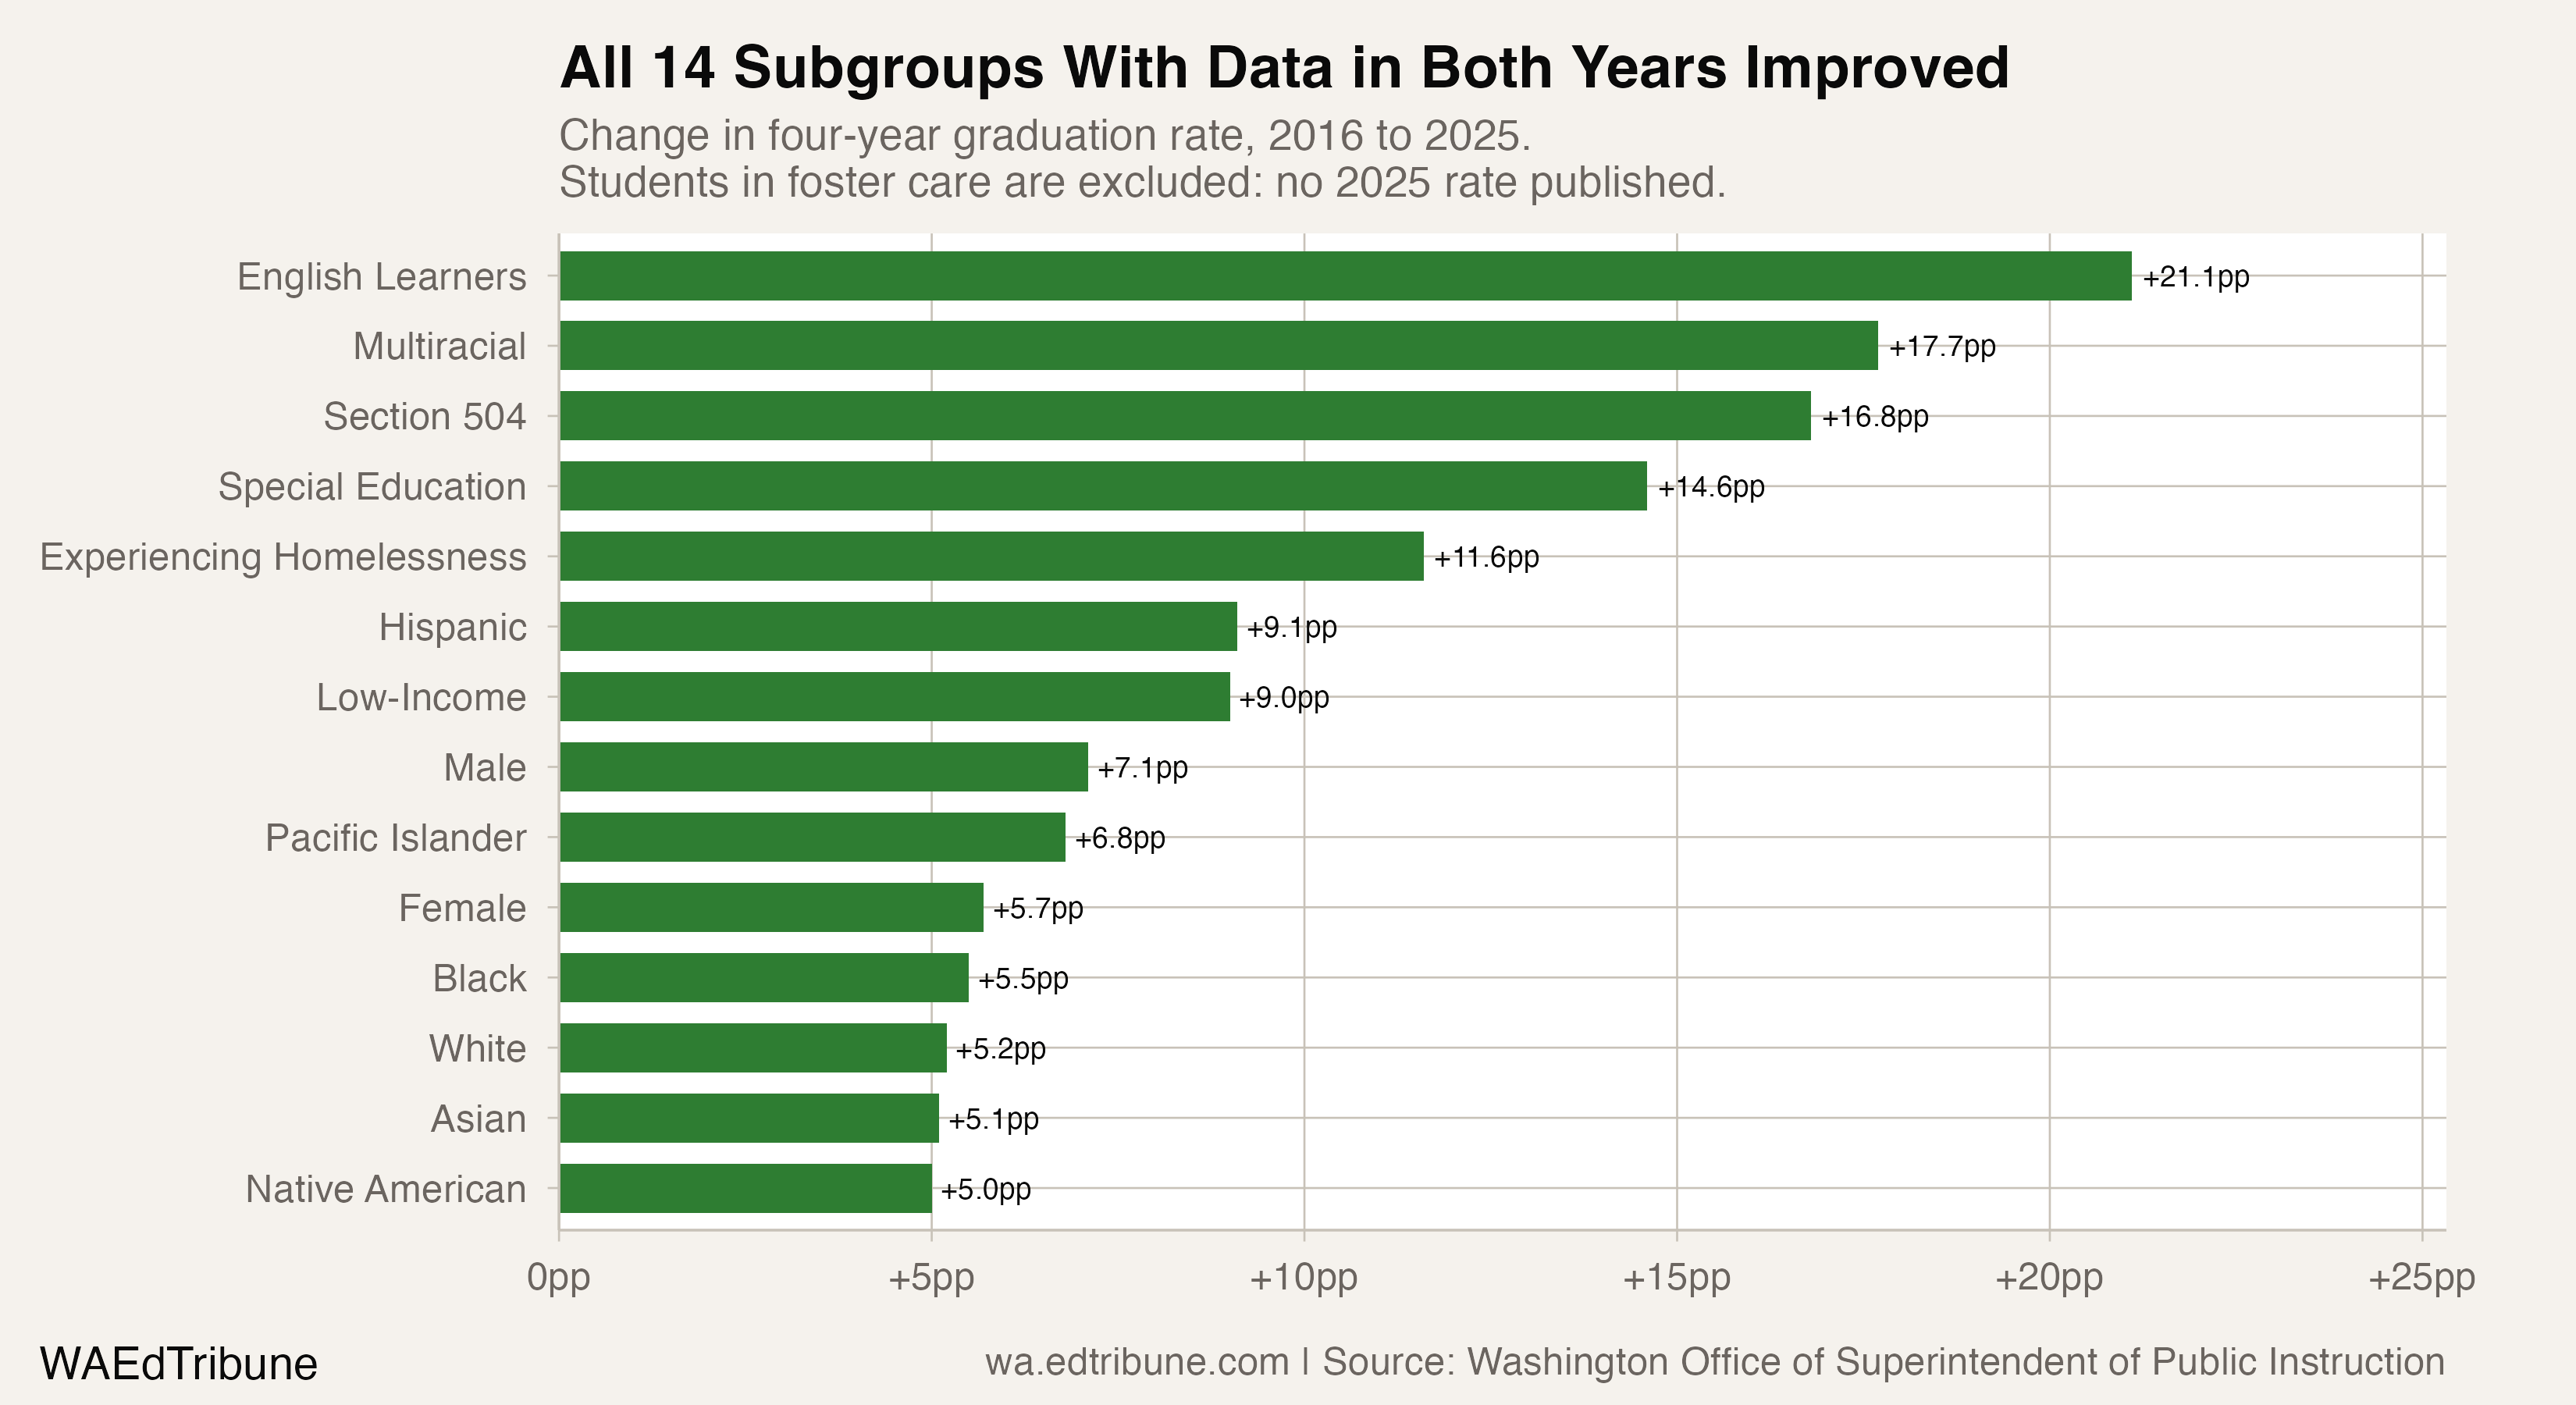
Fourteen student subgroups had a four-year rate published for Tacoma in both 2016 and 2025, and all 14 improved. English learners gained 21.1 percentage points. Students with accommodation plans gained 16.8 points. Students receiving special education services gained 14.6 points. Students experiencing homelessness gained 11.6 points. The smallest gain was 5.0 points for Native American students. The state published no 2025 Tacoma rate for students in foster care; their last reported figure was 62% for the Class of 2024, below the 64% reported in 2016.
The district outpaced the state by a widening margin
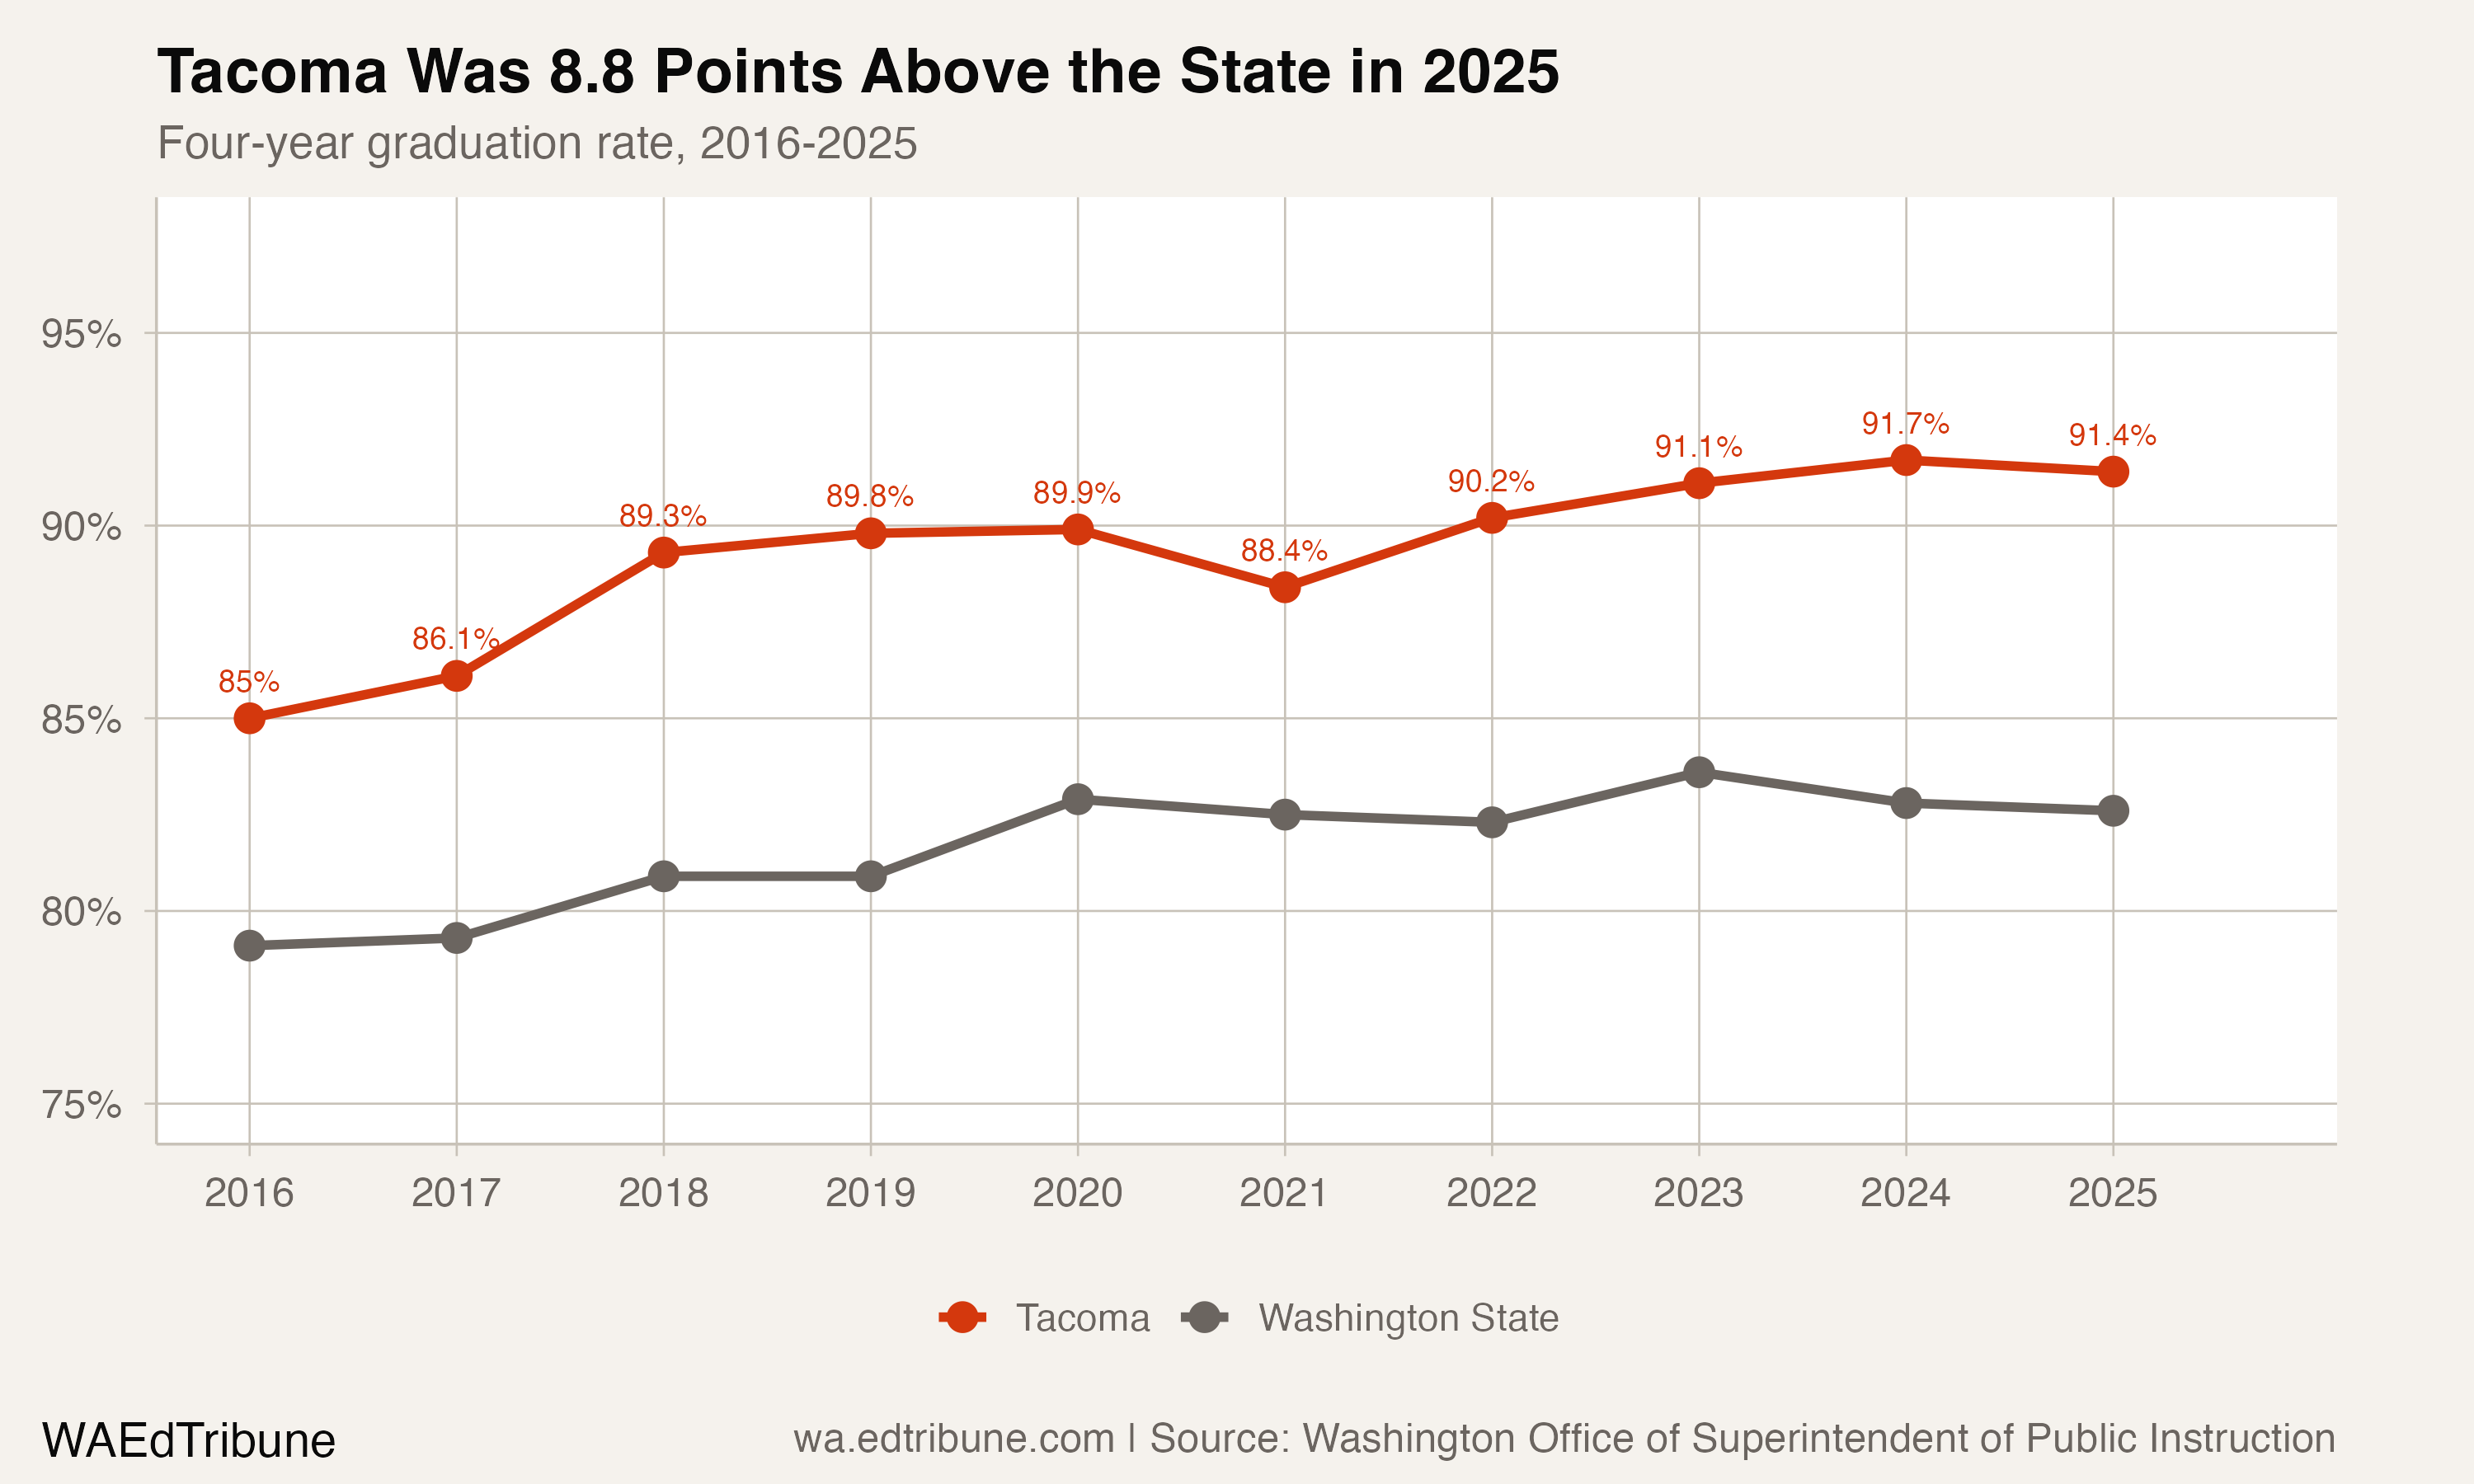
Tacoma's overall rate climbed from 85.0% in 2016 to 91.4% in 2025, a 6.4-point gain. Washington moved from 79.1% to 82.6% over the same endpoints, a 3.5-point gain. Tacoma's advantage over the state rate widened from 5.9 points to 8.8 points.
Among Washington's 10 largest districts by 2025 graduating-cohort size, Tacoma held rank 3 for improvement between 2016 and 2025. Seattle gained 8.6 points, from 77.5% to 86.1%, and Evergreen in Clark County gained 7.2 points. Kent gained 6.1 points. Puyallup and Bellevue declined by 2.1 and 1.8 points, respectively.
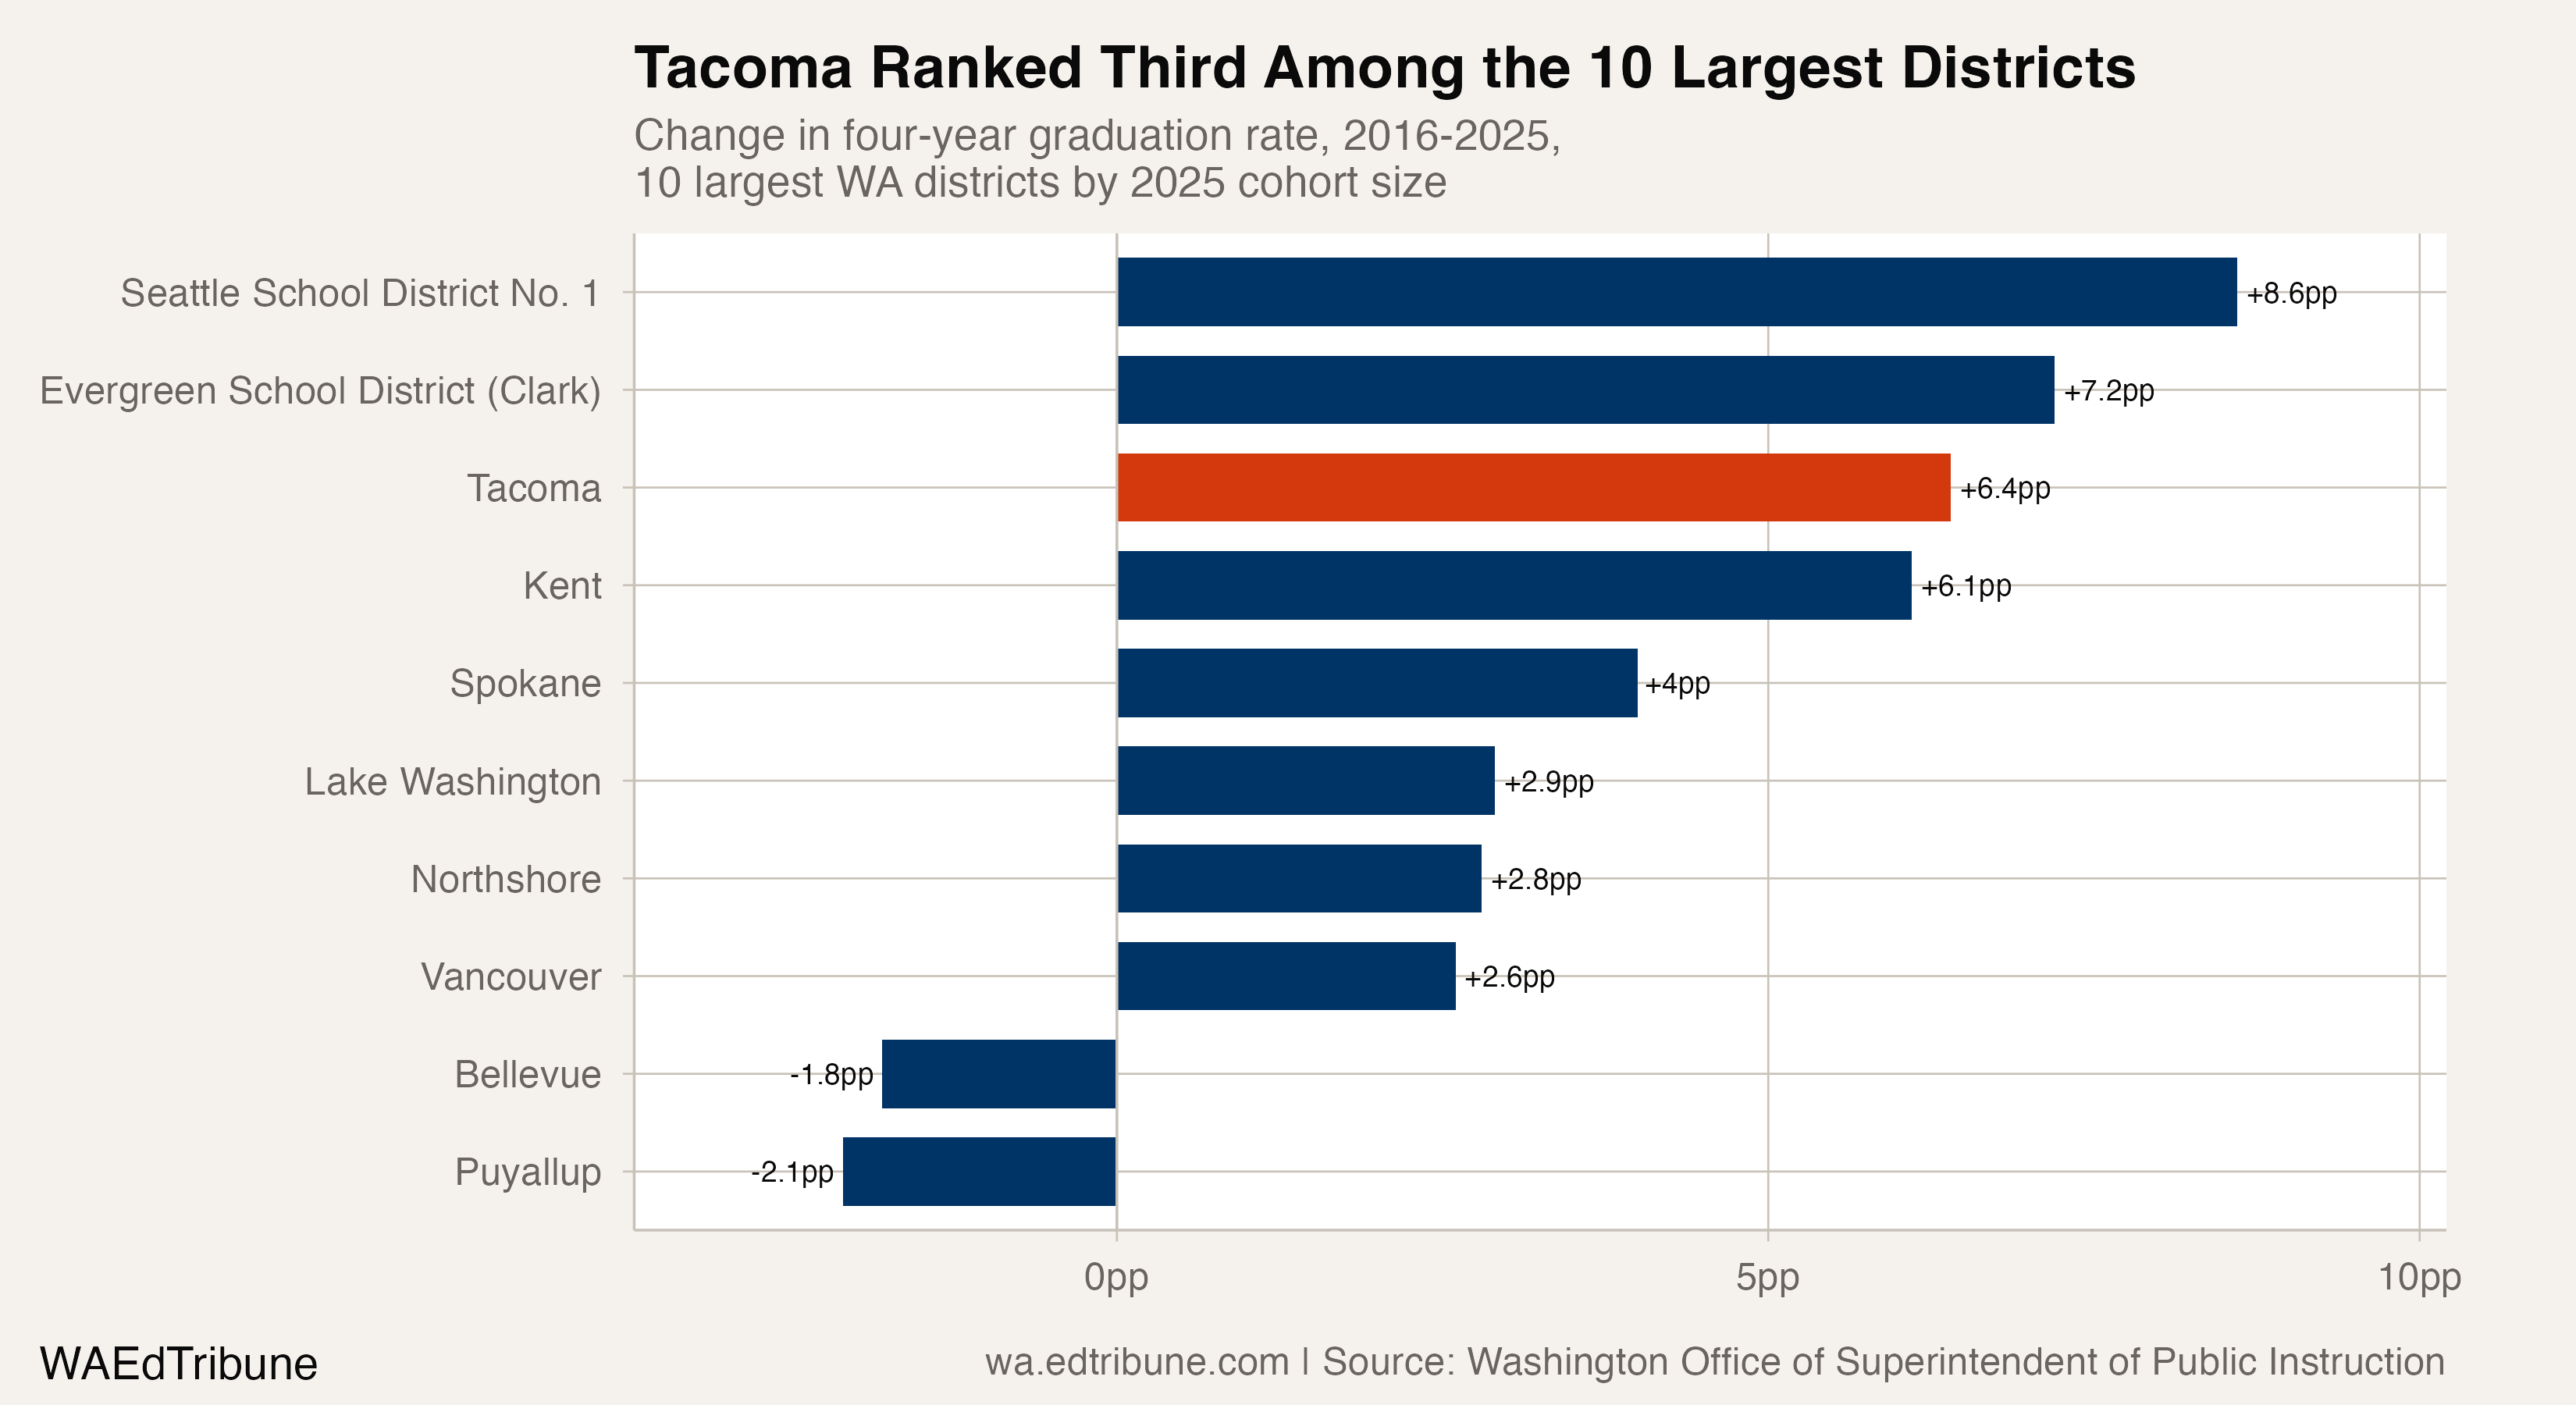
Lake Washington and Northshore had higher 2025 rates, at 94.2% and 94.5%, but their endpoint gains were 2.9 and 2.8 points. Tacoma started the period lower and improved by more.
Several Tacoma subgroup gains exceeded the corresponding statewide changes. English learners rose 21.1 points in Tacoma and 9.9 points statewide.
Students receiving special education services gained 14.6 points in Tacoma and 7.6 statewide. Students experiencing homelessness gained 11.6 points in Tacoma and 7.7 statewide.
Two comparisons went the other way. Black students gained 5.5 points in Tacoma and 7.6 statewide. Native American students gained 5.0 points in Tacoma and 10.3 statewide.
The equity math
Several gaps between student groups narrowed over the period, although not all did.
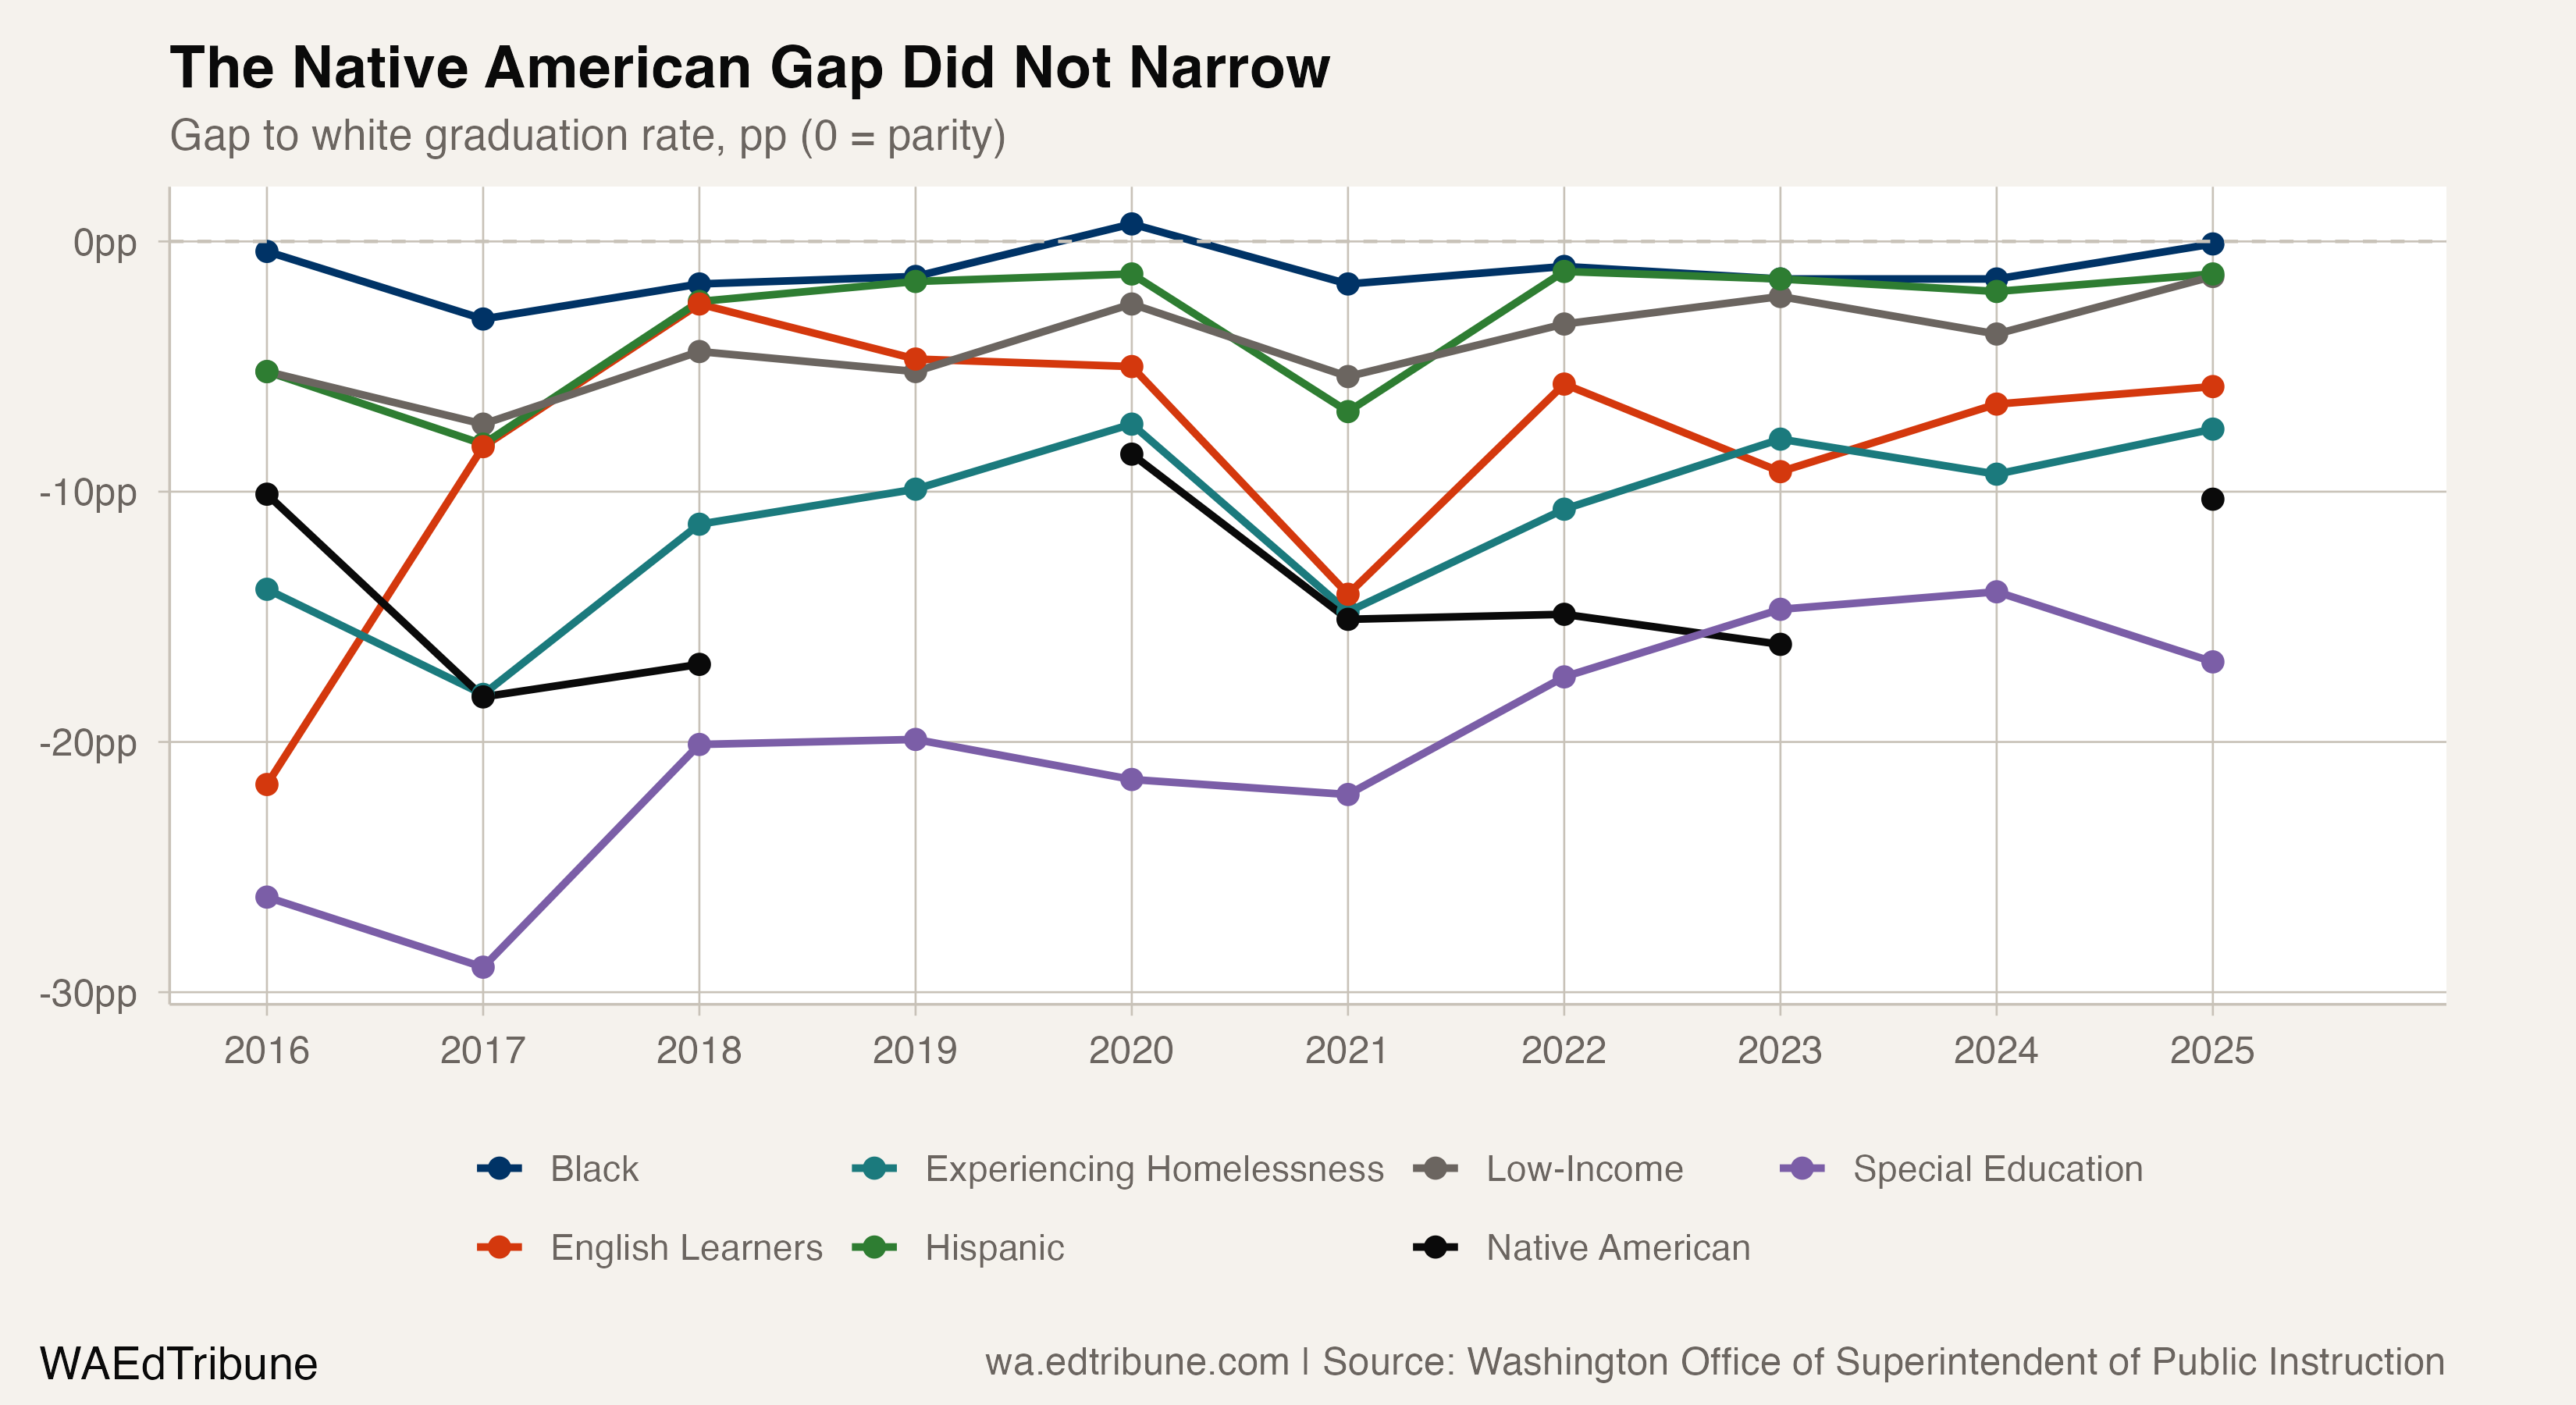
In 2016, Tacoma's published rate for Black students was 85.7%, 0.4 points below the rate for white students. In 2025, the rates were 91.2% and 91.3%, a 0.1-point gap.
The Hispanic-white gap narrowed from 5.2 points to 1.3 points. The gap between low-income and white students narrowed from 5.2 points to 1.4 points. In 2025, the published low-income graduation rate was 76.4% statewide and 89.9% in Tacoma.
The English learner-white gap shrank from 21.7 points to 5.8 points. The special education-white gap narrowed from 26.2 points to 16.8 points, the widest of the 7 gaps tested in the analysis for 2025. The Native American-white gap was 10.3 points, followed by the 7.5-point gap between students experiencing homelessness and white students.
The Native American-white gap did not narrow: it was 10.1 points in 2016 and 10.3 points in 2025. The published Native American rate is rounded to a whole percentage point and has no cohort count in the Tacoma rows, so small changes should be interpreted cautiously. The special education rate also fell from 78.5% in 2024 to 74.5% in 2025.
What the convergence chart reveals
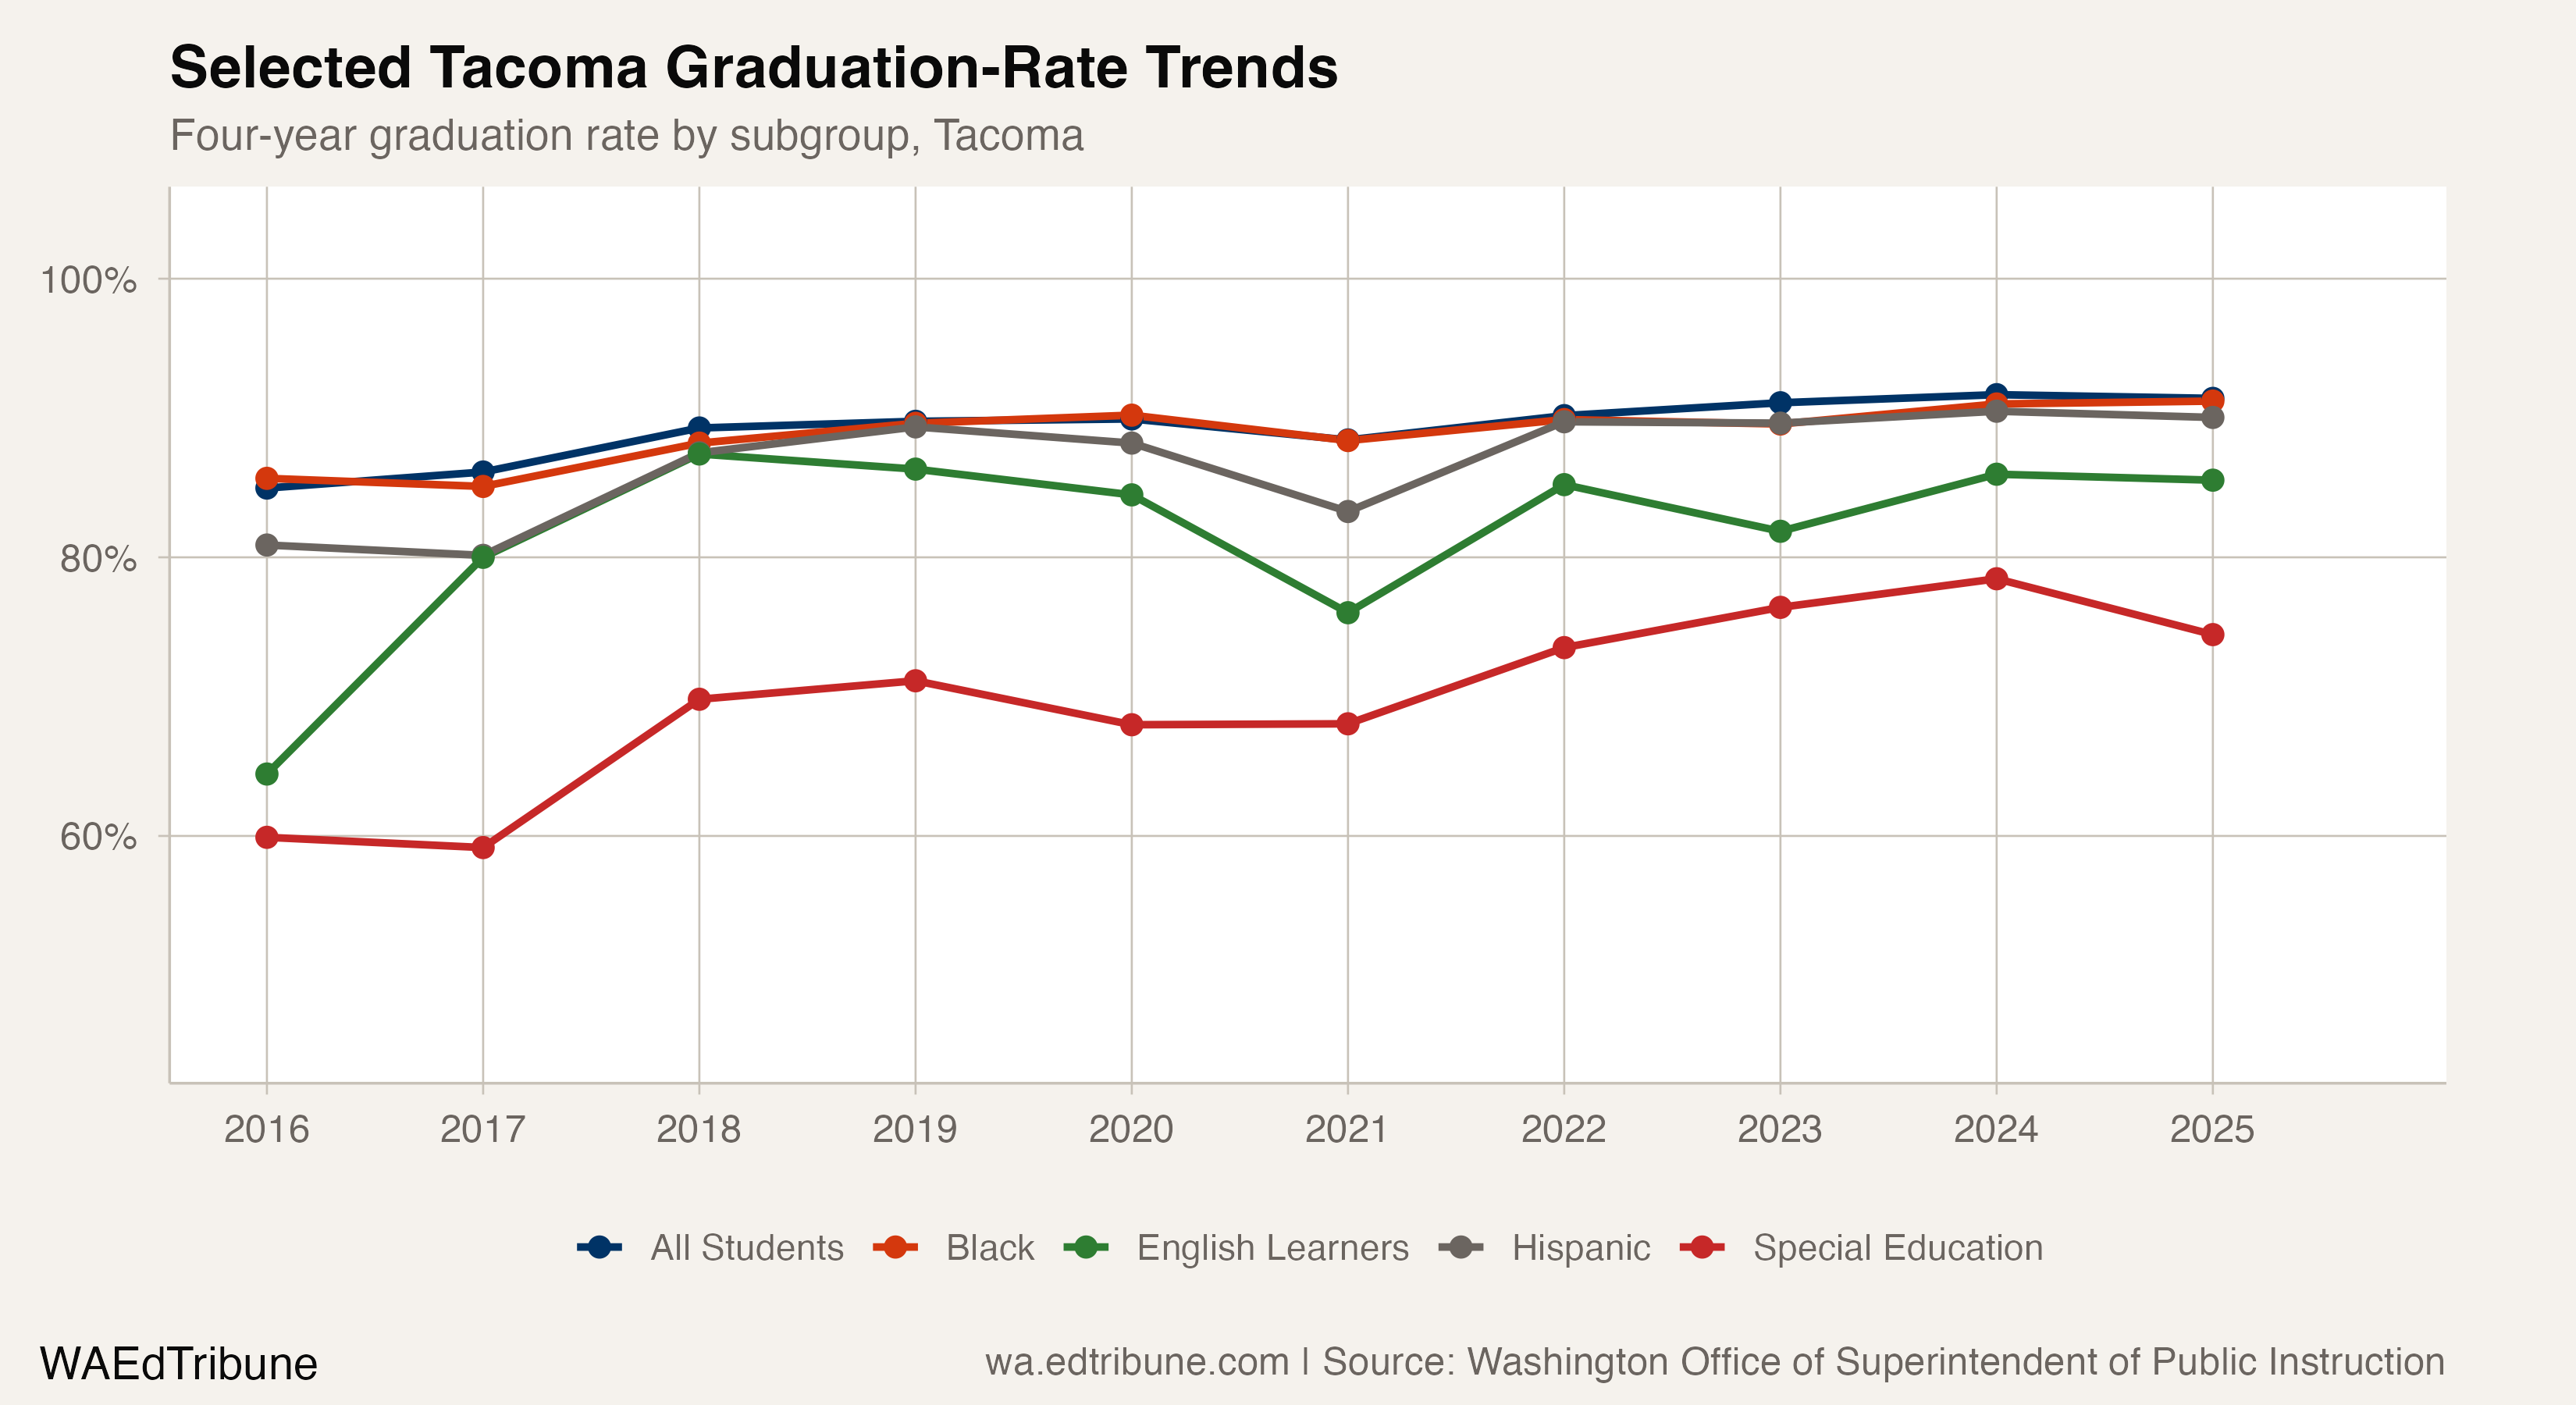
The gains were not linear. The English learner rate rose from 64.4% in 2016 to 87.4% in 2018, a 23.0-point increase in two years. It fell to 76.0% in 2021 and later rose to 85.5% in 2025. The graduation file establishes those changes but does not identify what caused them.
The Hispanic rate reached 89.4% in 2019, fell to 83.3% in 2021, and was back above the 2019 level by 2022, where it stayed. The white rate fell from 91.0% in 2019 to 89.5% in 2020. The Black rate fell from 90.2% in 2020 to 88.4% in 2021.
In the published Tacoma rows, 11 subgroup rates fell from 2020 to 2021. By 2025, 8 of those subgroups had exceeded their highest pre-2021 rate. The Native American rate matched its pre-2021 high, the English learner rate remained below its earlier peak, and no 2025 foster-care rate was published. The English learner available-series peak remained 87.4% in 2018, compared with 86.0% in 2024 and 85.5% in 2025. These data describe the timing and size of the changes, not the reasons behind them.
One rate that slipped
Tacoma's special education graduation rate rose from 59.9% in 2016 to an available-series peak of 78.5% in 2024. The path included a drop to 59.2% in 2017 and rates of 68.0% in both 2020 and 2021. The rate then fell 4.0 points, to 74.5%, in 2025. One year of decline does not establish a longer-term reversal.
The five-year rate
Tacoma's published five-year graduation rate rose from 86.5% in the 2016 report to 92.8% in the 2025 report. Washington's five-year row for 2025 corresponds to the Class of 2024. That class had a four-year rate of 91.7%, so the aligned five-year rate was 1.1 points higher. The comparison describes when diplomas were recorded; it does not measure academic preparation or explain why students took an additional year.
Detailed code that reproduces the analysis and figures in this article is available exclusively to EdTribune subscribers.
Discussion
Sign in to join the discussion.
Loading comments...