Correction (October 11, 2026): An earlier version of this article said Washington published no 2022 graduation report because of a federal waiver. The state did publish results for the Class of 2022, and this version includes them: Seattle's rate was 87.6% in 2022, and its Hispanic rate was 75.0%. The article's other figures did not change.
The package's most recent published graduation results are for the Class of 2025, representing the 2024-25 school year. They are historical results, not current 2026-27 outcomes.
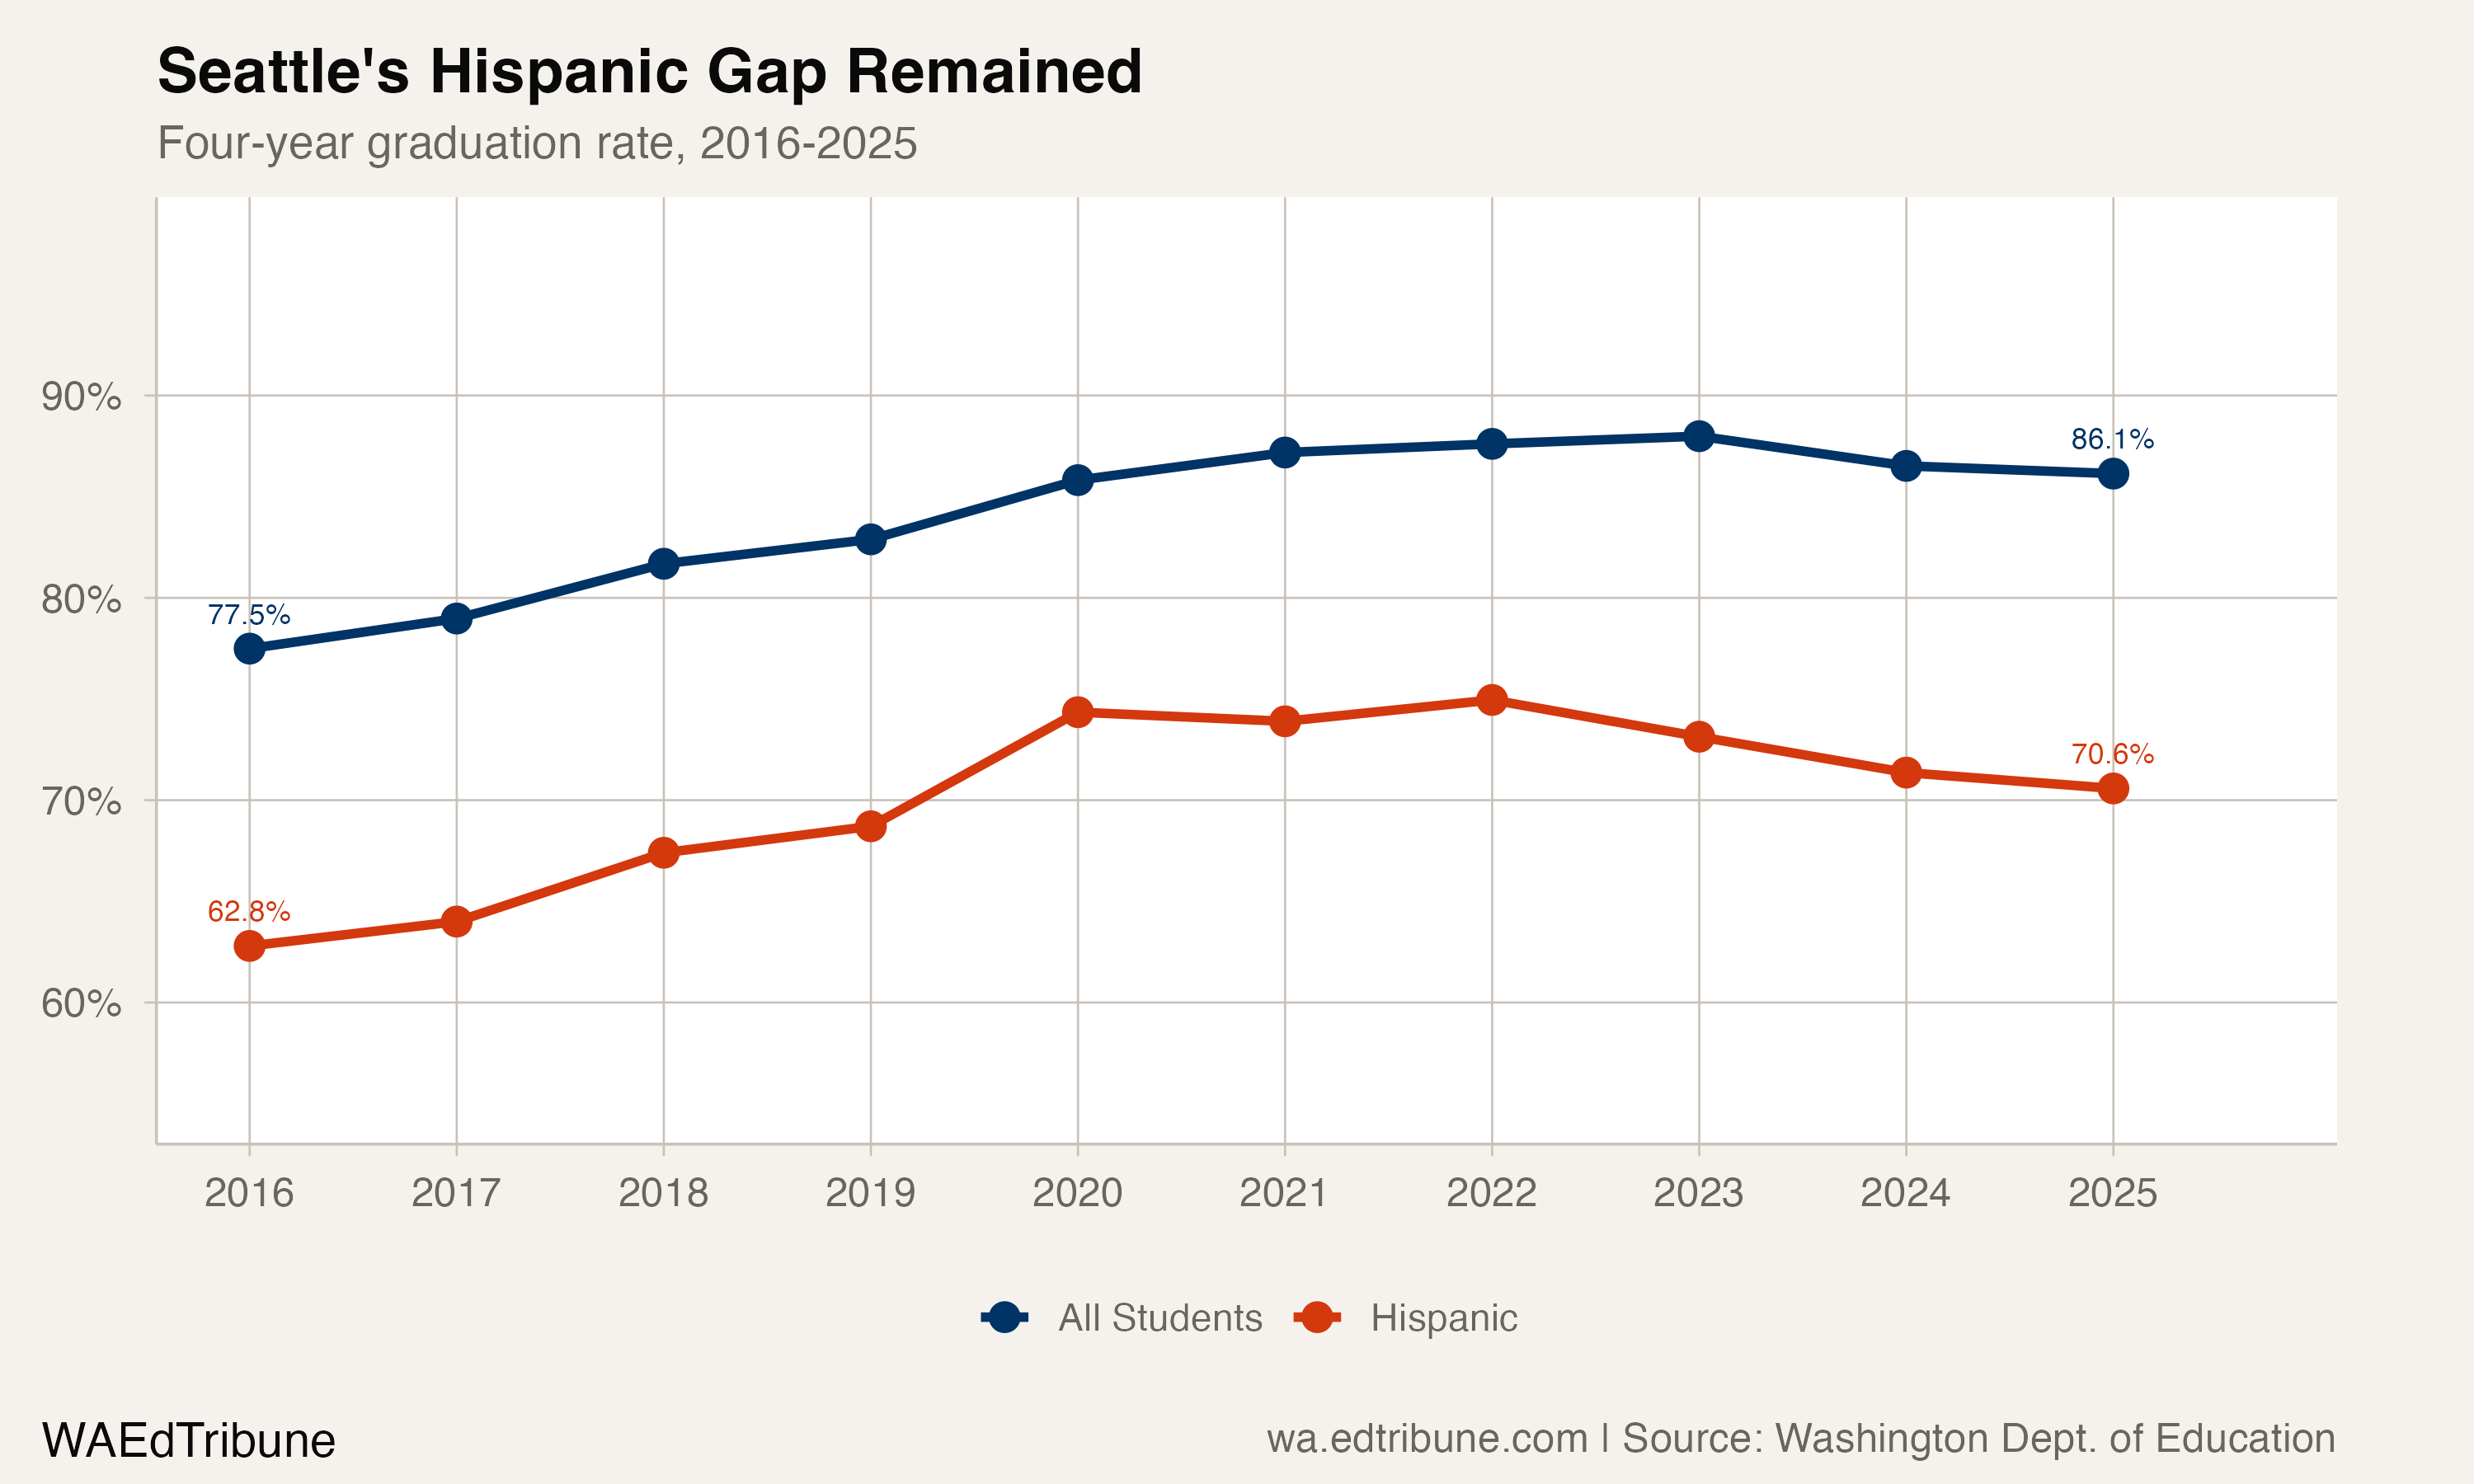
Seattle↗ET's four-year graduation rate rose from 77.5% for the Class of 2016 to 88.0% for the Class of 2023, a 10.5-point gain. It then fell to 86.5% in 2024 and 86.1% in 2025, a 1.8-point decline from the 2023 peak.
In 2023, 3,634 of the 4,130 students in Seattle's published cohort graduated, leaving 496 who did not graduate on time. In 2025, 3,686 of 4,279 graduated and 593 did not, an increase of 97 non-graduates. The cohort grew from 3,403 students in 2016 to 4,279 in 2025, a 25.7% increase.
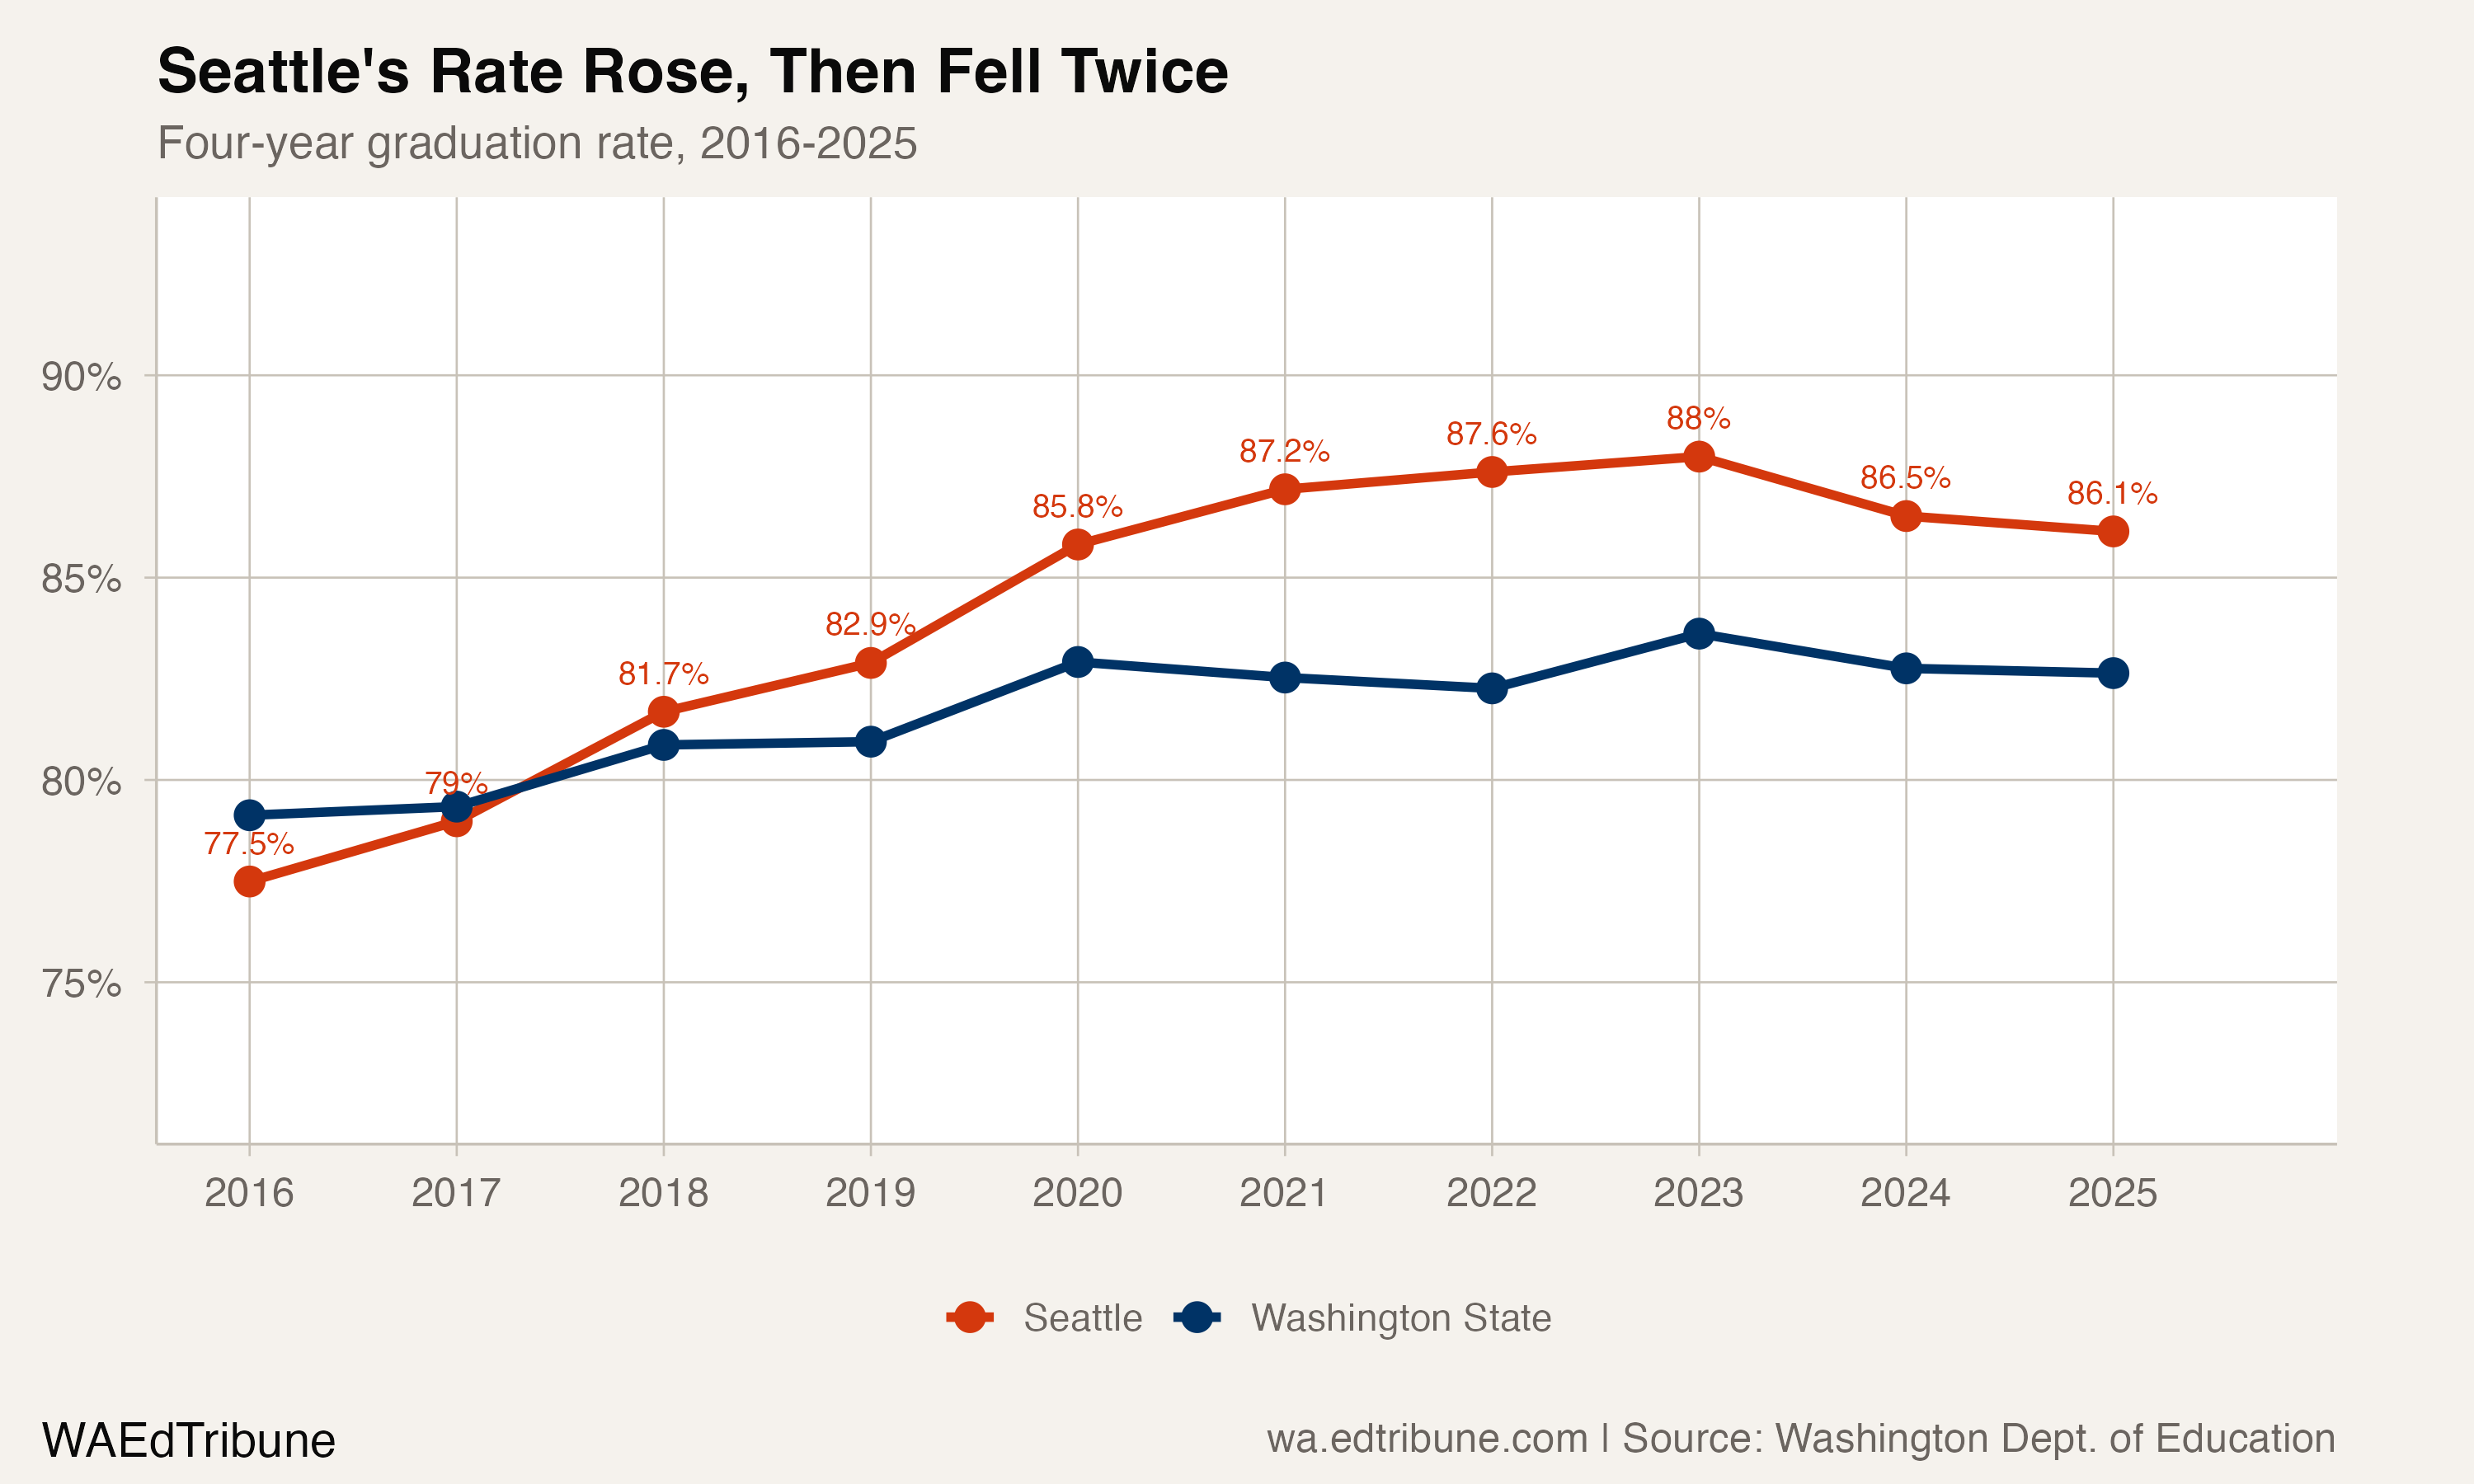
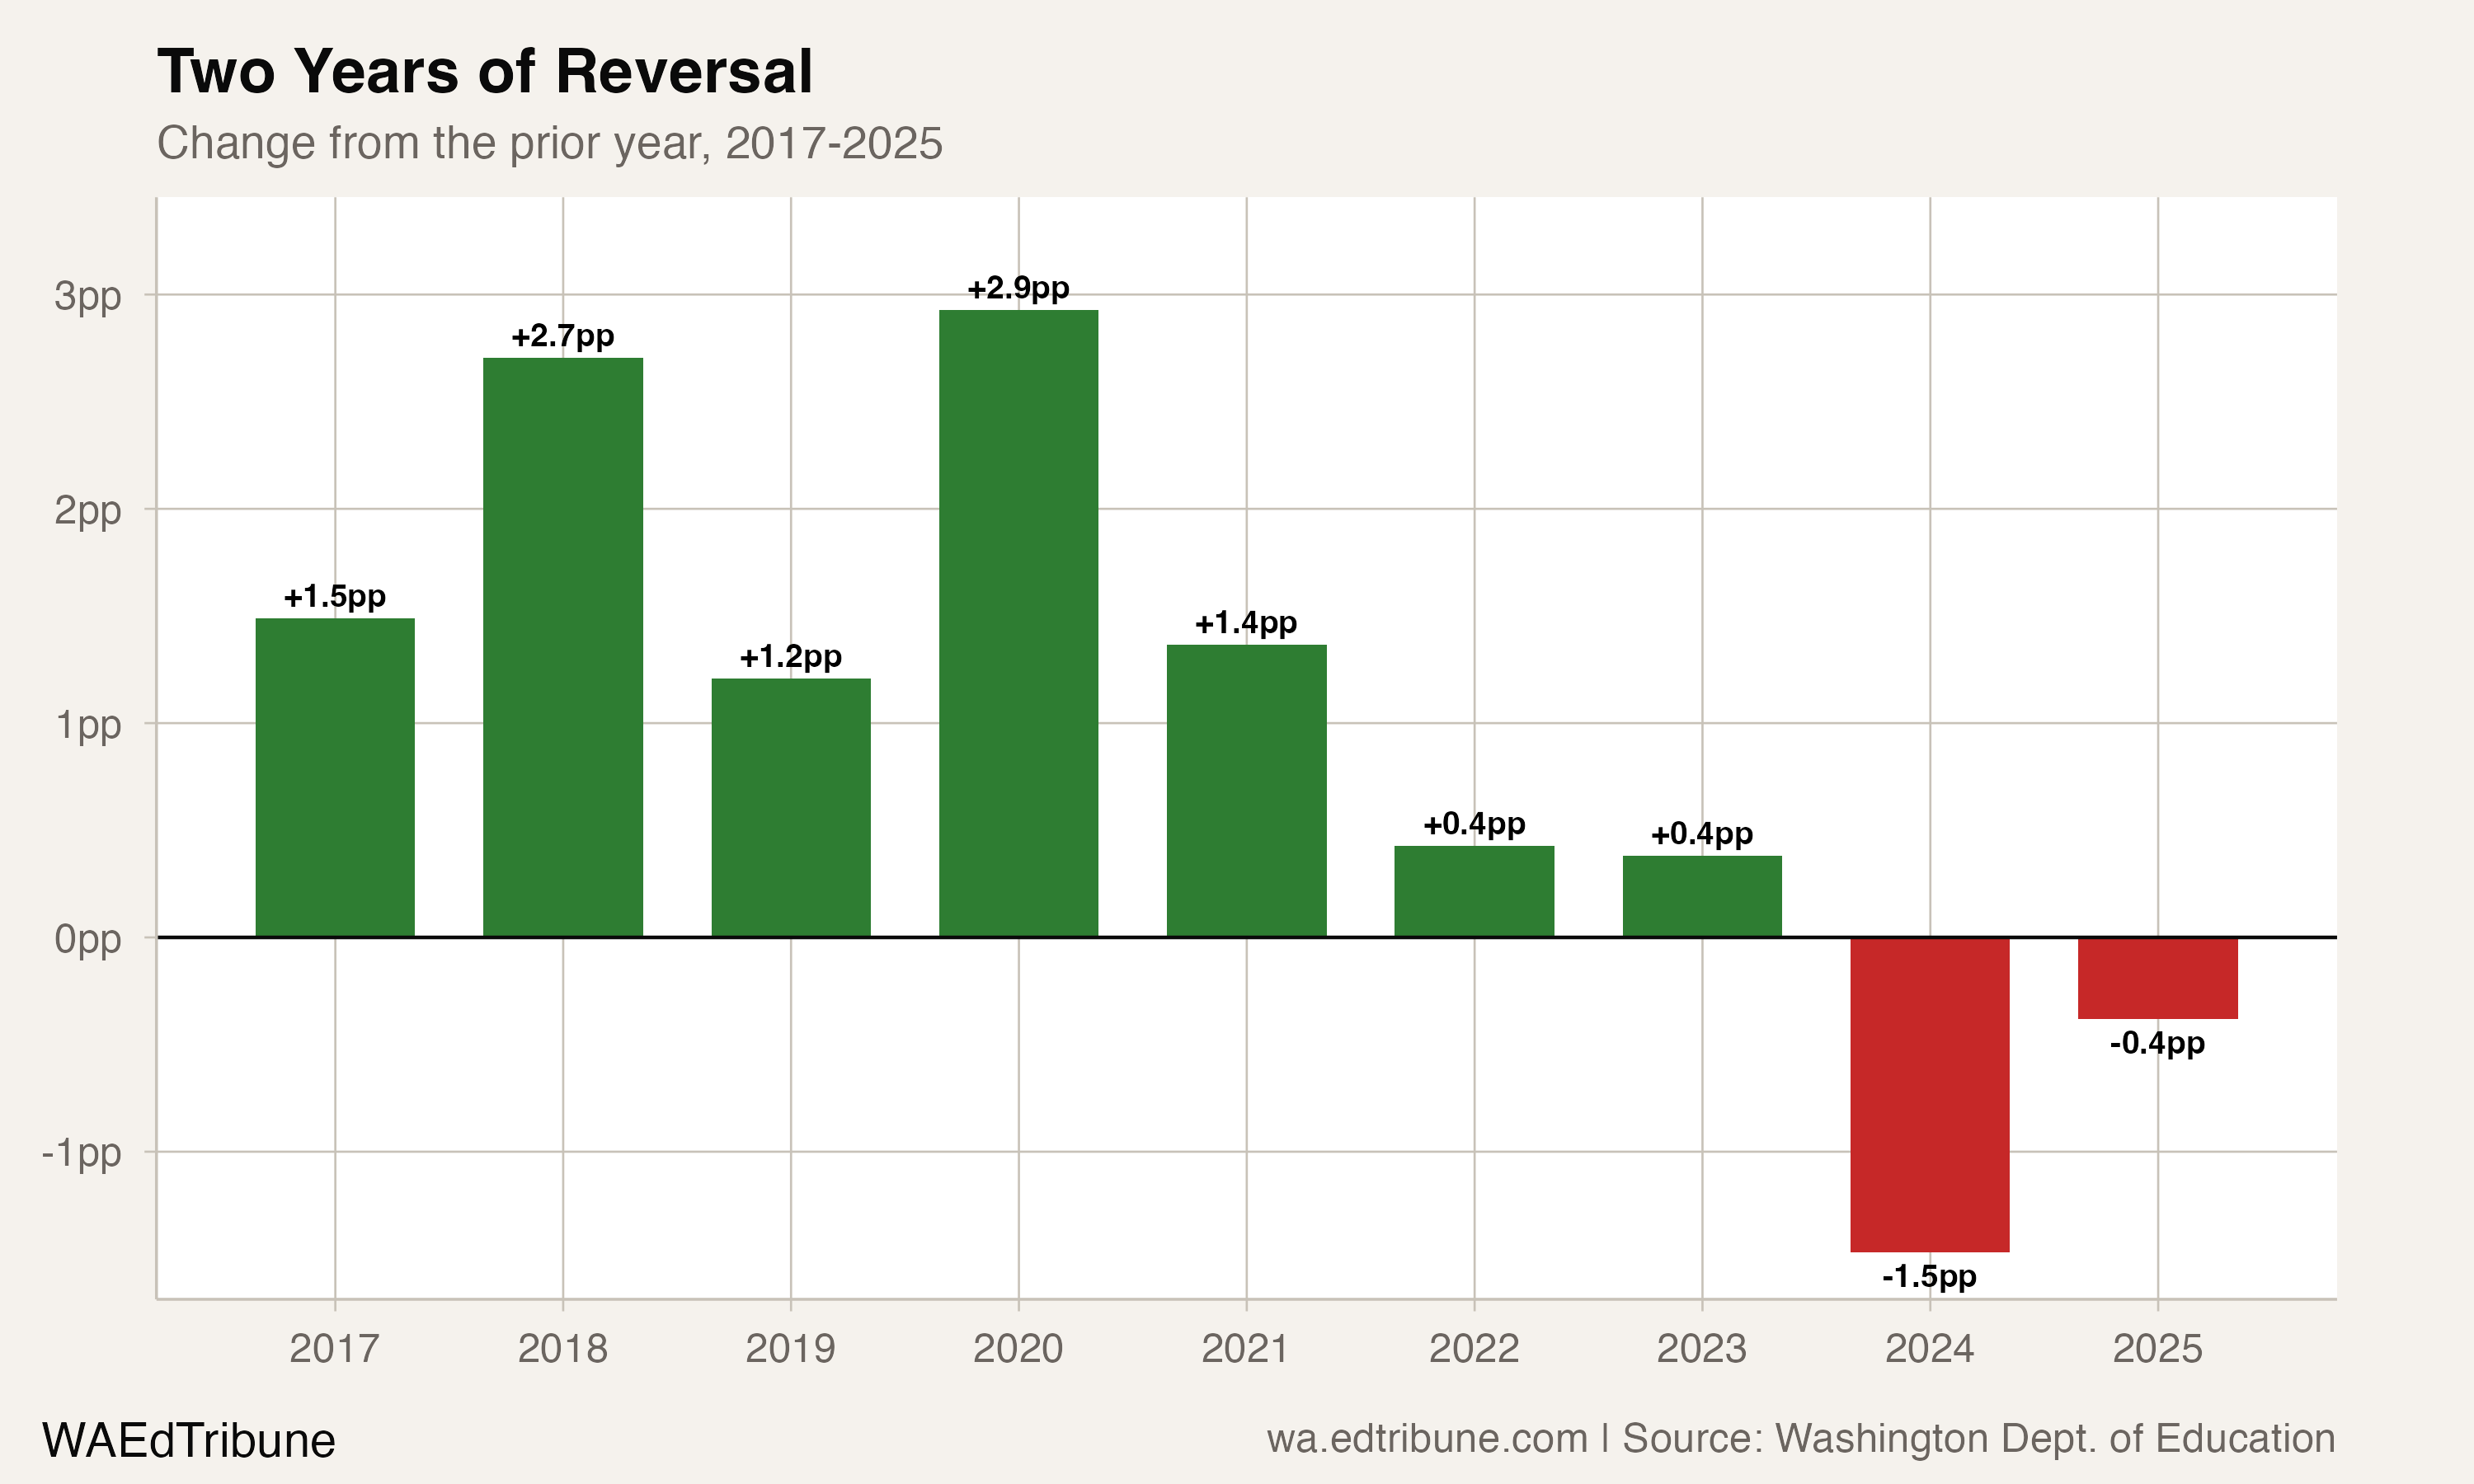
The two recent year-over-year changes were declines of 1.5 points from 2023 to 2024 and 0.4 points from 2024 to 2025. Before the peak, the rate rose 0.4 points in 2022, to 87.6%, and another 0.4 points in 2023.
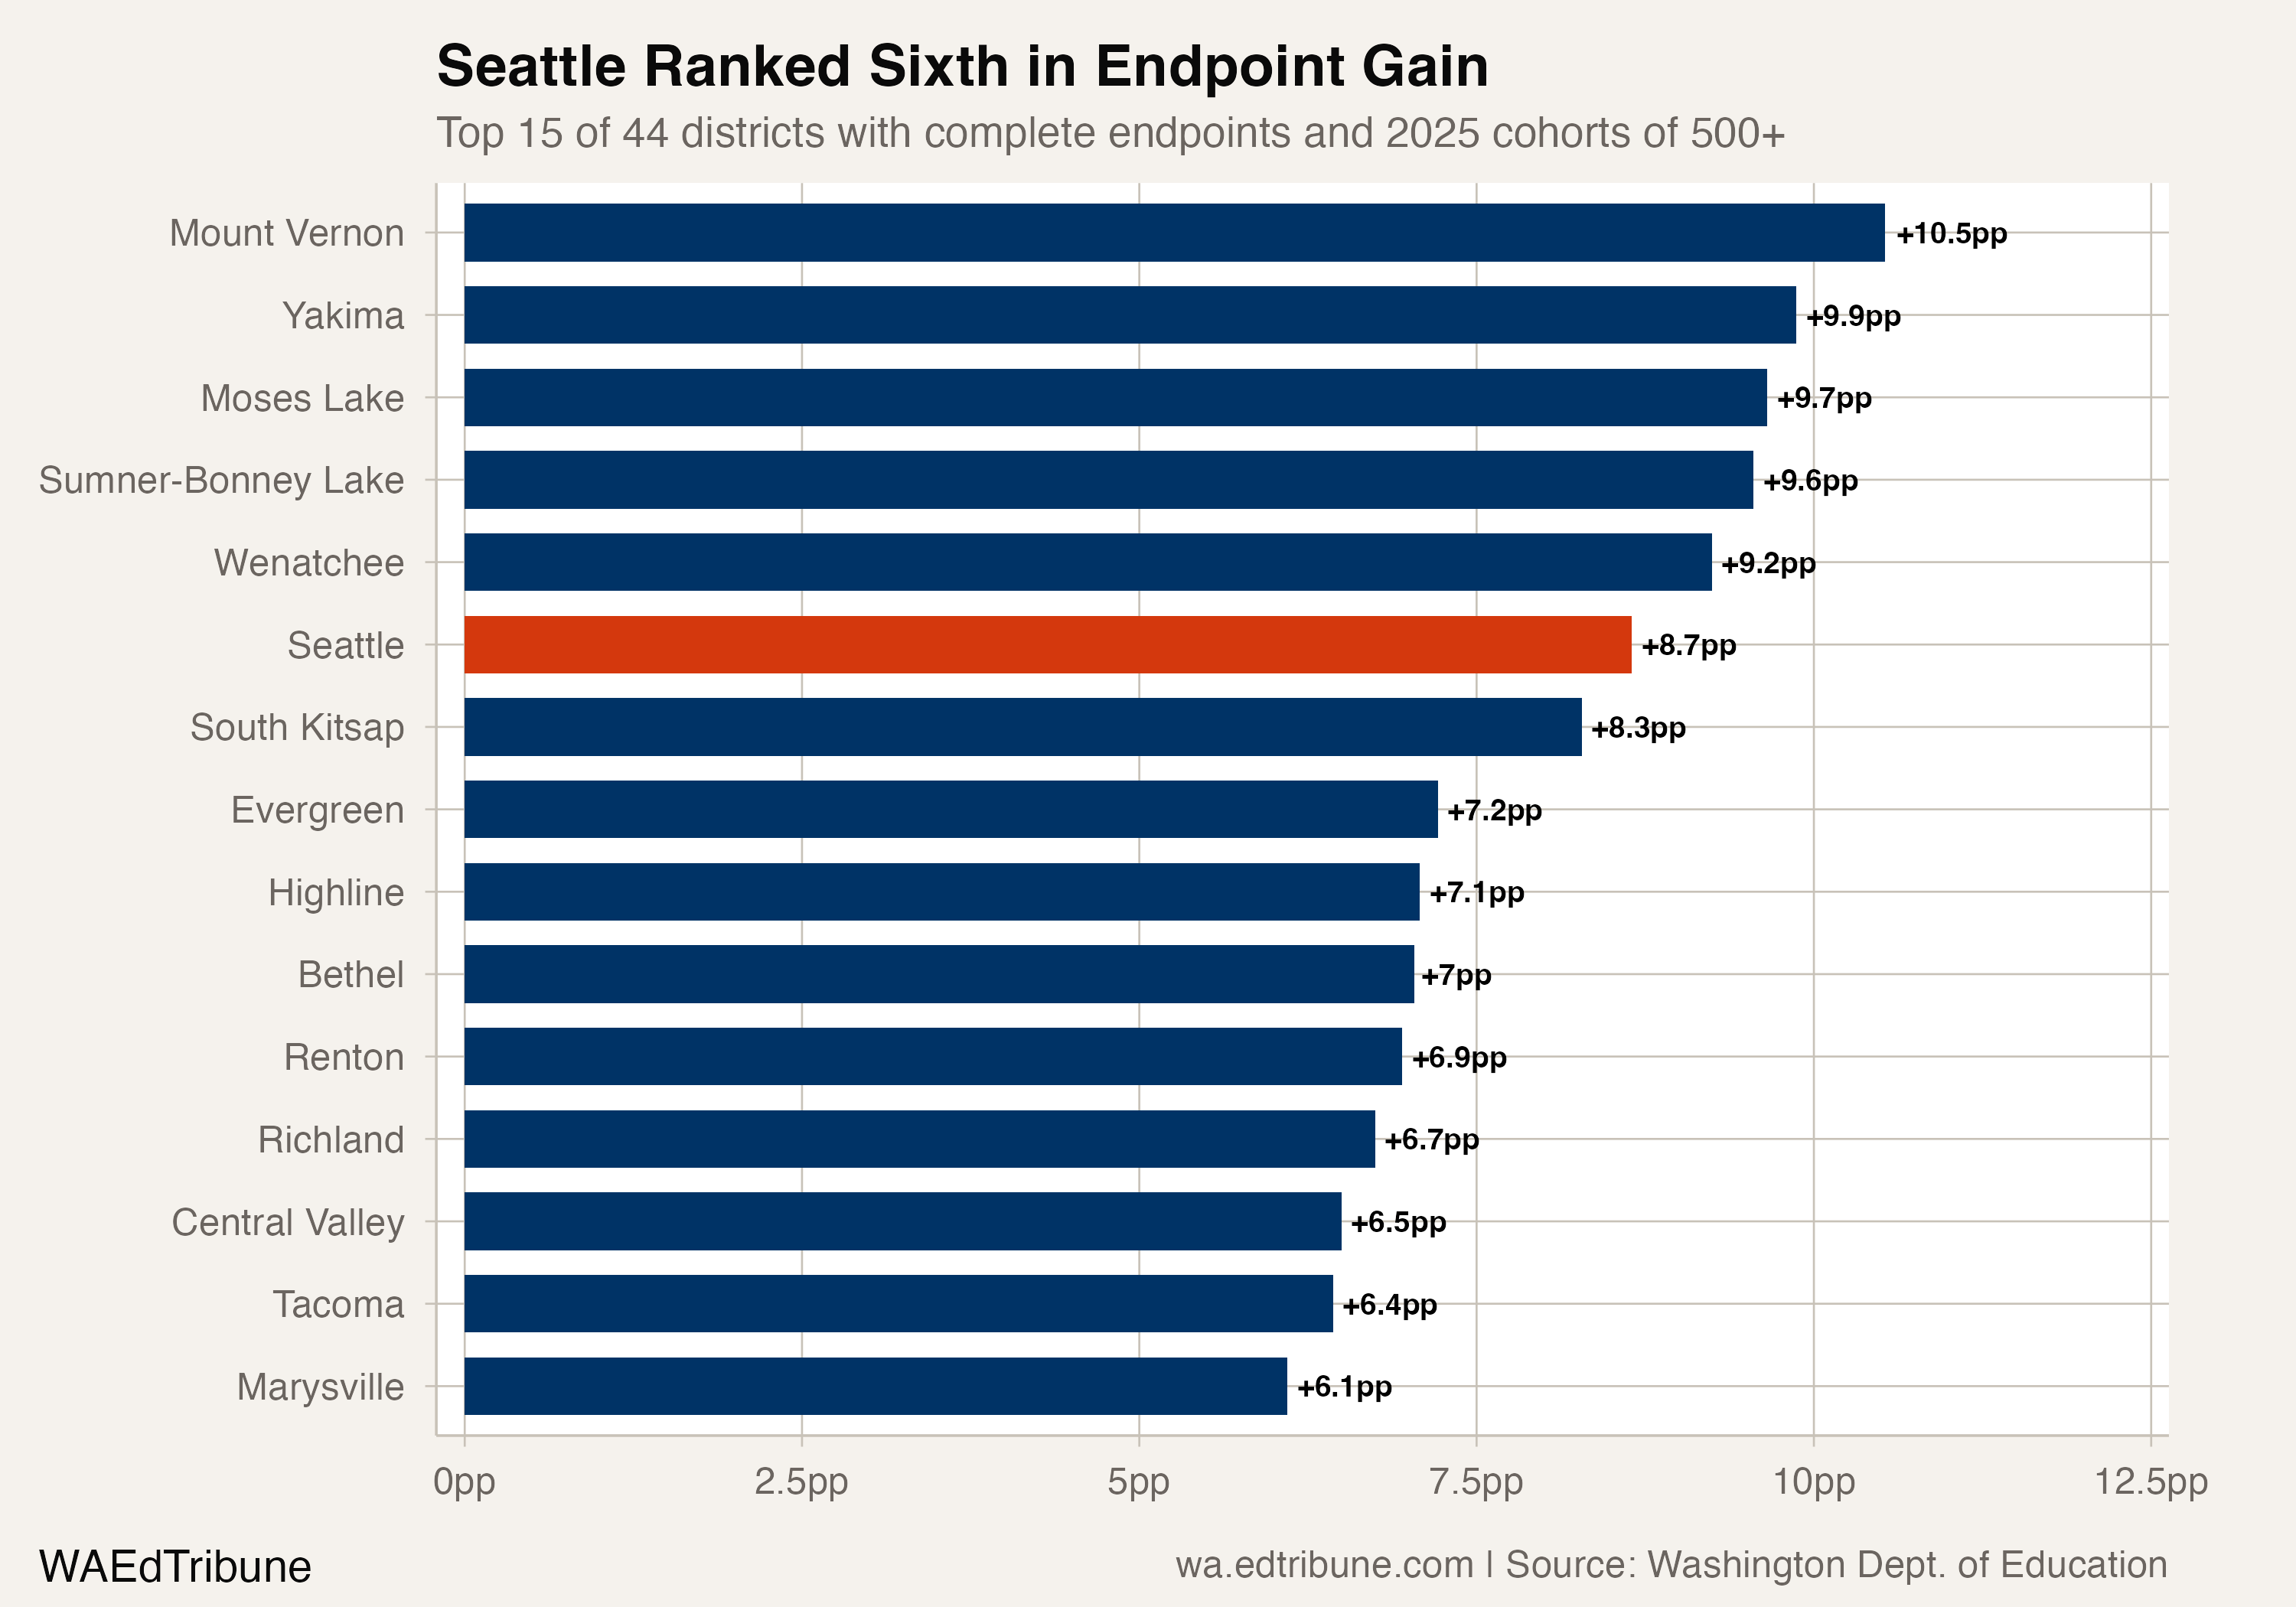
Among 44 districts with published all-student rates in both 2016 and 2025 and a 2025 cohort of at least 500, Seattle's 8.7-point endpoint gain ranked sixth.
Gains that later reversed
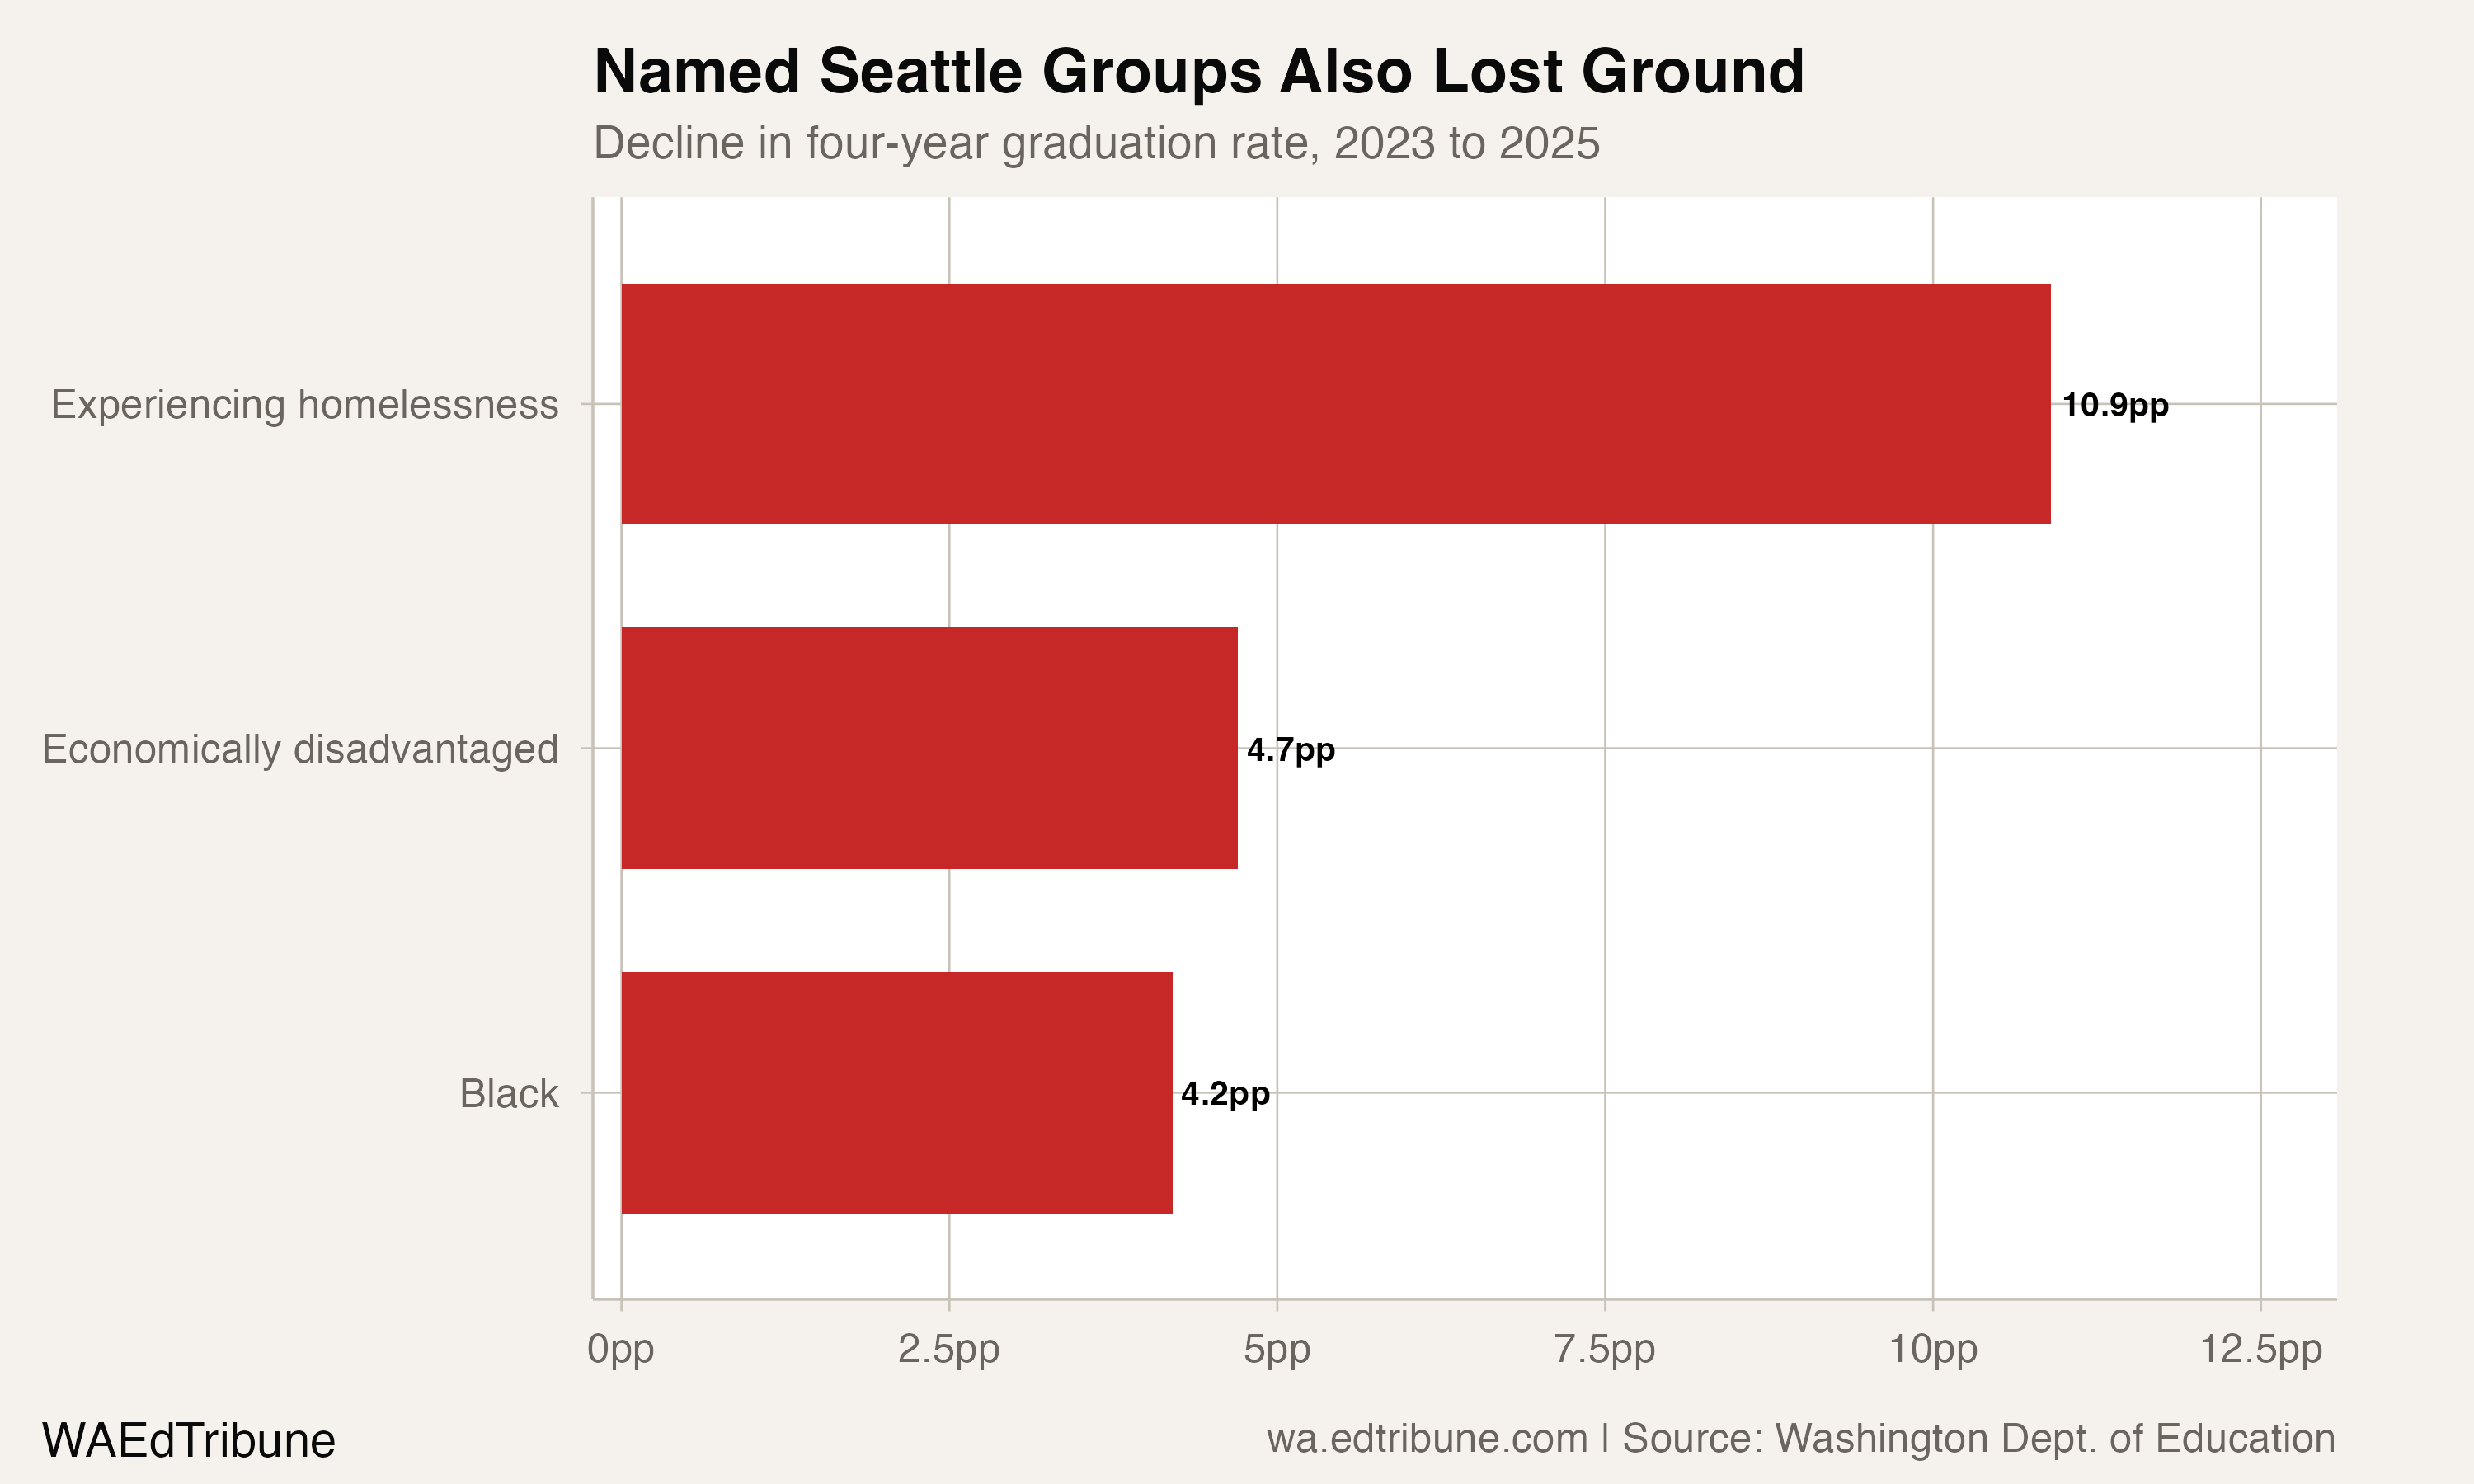
The early gain was broad: all 16 Seattle student groups with published rates in both 2016 and 2023 improved. Black students gained 18.0 points over that period, reaching 88.4%. By 2025, the rate was 84.2%, a 4.2-point reversal from 2023.
Students experiencing homelessness fell from 72.4% in 2023 to 61.4% in 2025, a 10.9-point decline. Economically disadvantaged students fell from 84.0% to 79.3%, a 4.7-point decline.
Across the complete 2023-to-2025 comparison, 14 of 15 Seattle groups declined and one was unchanged.
The package data shows these movements but does not identify their causes. Any explanation for the two-year reversal is unresourced here.
Hispanic students remain further behind
Seattle's Hispanic graduation rate was 62.8% in 2016. It climbed to 74.3% in 2020 and, after 73.9% in 2021, reached 75.0% in 2022, then fell to 73.1% in 2023 and 70.6% in 2025. That is a 7.8-point gain from 2016 to 2025, compared with an 8.7-point gain for all students.
The gap between Seattle's all-student rate and its Hispanic rate was 14.7 points in 2016 and 15.5 points in 2025.
Statewide, the Hispanic four-year rate was 78.7% in 2023 and 77.0% in 2025. Seattle's 86.1% all-student rate in 2025 was 3.5 points above Washington's 82.6% rate. Seattle's 70.6% Hispanic rate was 6.4 points below the statewide Hispanic rate.
The extended-rate context
Washington's published five-year rate runs one year behind the named graduating class in this series. The published figure for the Class of 2024 was 89.7%, compared with 90.2% for the Class of 2022. The extended-rate series does not erase the four-year decline, but it measures a different completion window.
The package data establishes the rates, changes and subgroup comparisons. It does not establish why the rates moved or whether the 2025 four-year decline will persist.
Source
Washington Office of Superintendent of Public Instruction, graduation-rate data.
Detailed code that reproduces the analysis and figures in this article is available exclusively to EdTribune subscribers.
Discussion
Sign in to join the discussion.
Loading comments...