Correction (October 11, 2026): An earlier version of this article left out the Class of 2022, which was not in the data we analyzed at the time and is now published. With it included, the white-Hispanic gap reached its narrowest point, 4.3 percentage points, in 2021-22, not 6.4 points in 2022-23, and it has widened in each of the three years since, not two. The largest one-year widening was 2.1 points for the Class of 2023, not 1.1 points for the Class of 2025. The gap has given back about three-quarters of the progress it made from 2015-16, not a little more than half. The 2024 and 2025 figures were not affected.
In Bellevue School District↗ET, one of the wealthiest and highest-performing districts in Washington, 68.1% of Hispanic seniors graduated on time in 2024-25. The white rate in the same district was 91.5%. That is a 23.4-percentage-point gap, up from 8.8 points six years earlier. Bellevue is an extreme case, but the direction it moved is not.
Statewide, the white-Hispanic graduation gap had been closing. From 9.2 percentage points in 2015-16, it narrowed to 4.3 points by 2021-22. Then it reversed. The Class of 2023 pushed the gap back up to 6.4 points, the Class of 2024 to 6.9, and the Class of 2025 to 8.0. In three years, the gap gave back 3.7 of the 4.9 points it had closed over the prior six, about three-quarters of the progress.
The reversal matters more than it would have a decade ago because the Hispanic share of Washington's graduating cohort has grown from 19.0% to 26.8% since 2016. Every percentage point of rate stagnation now affects more students than it once did.
The stall
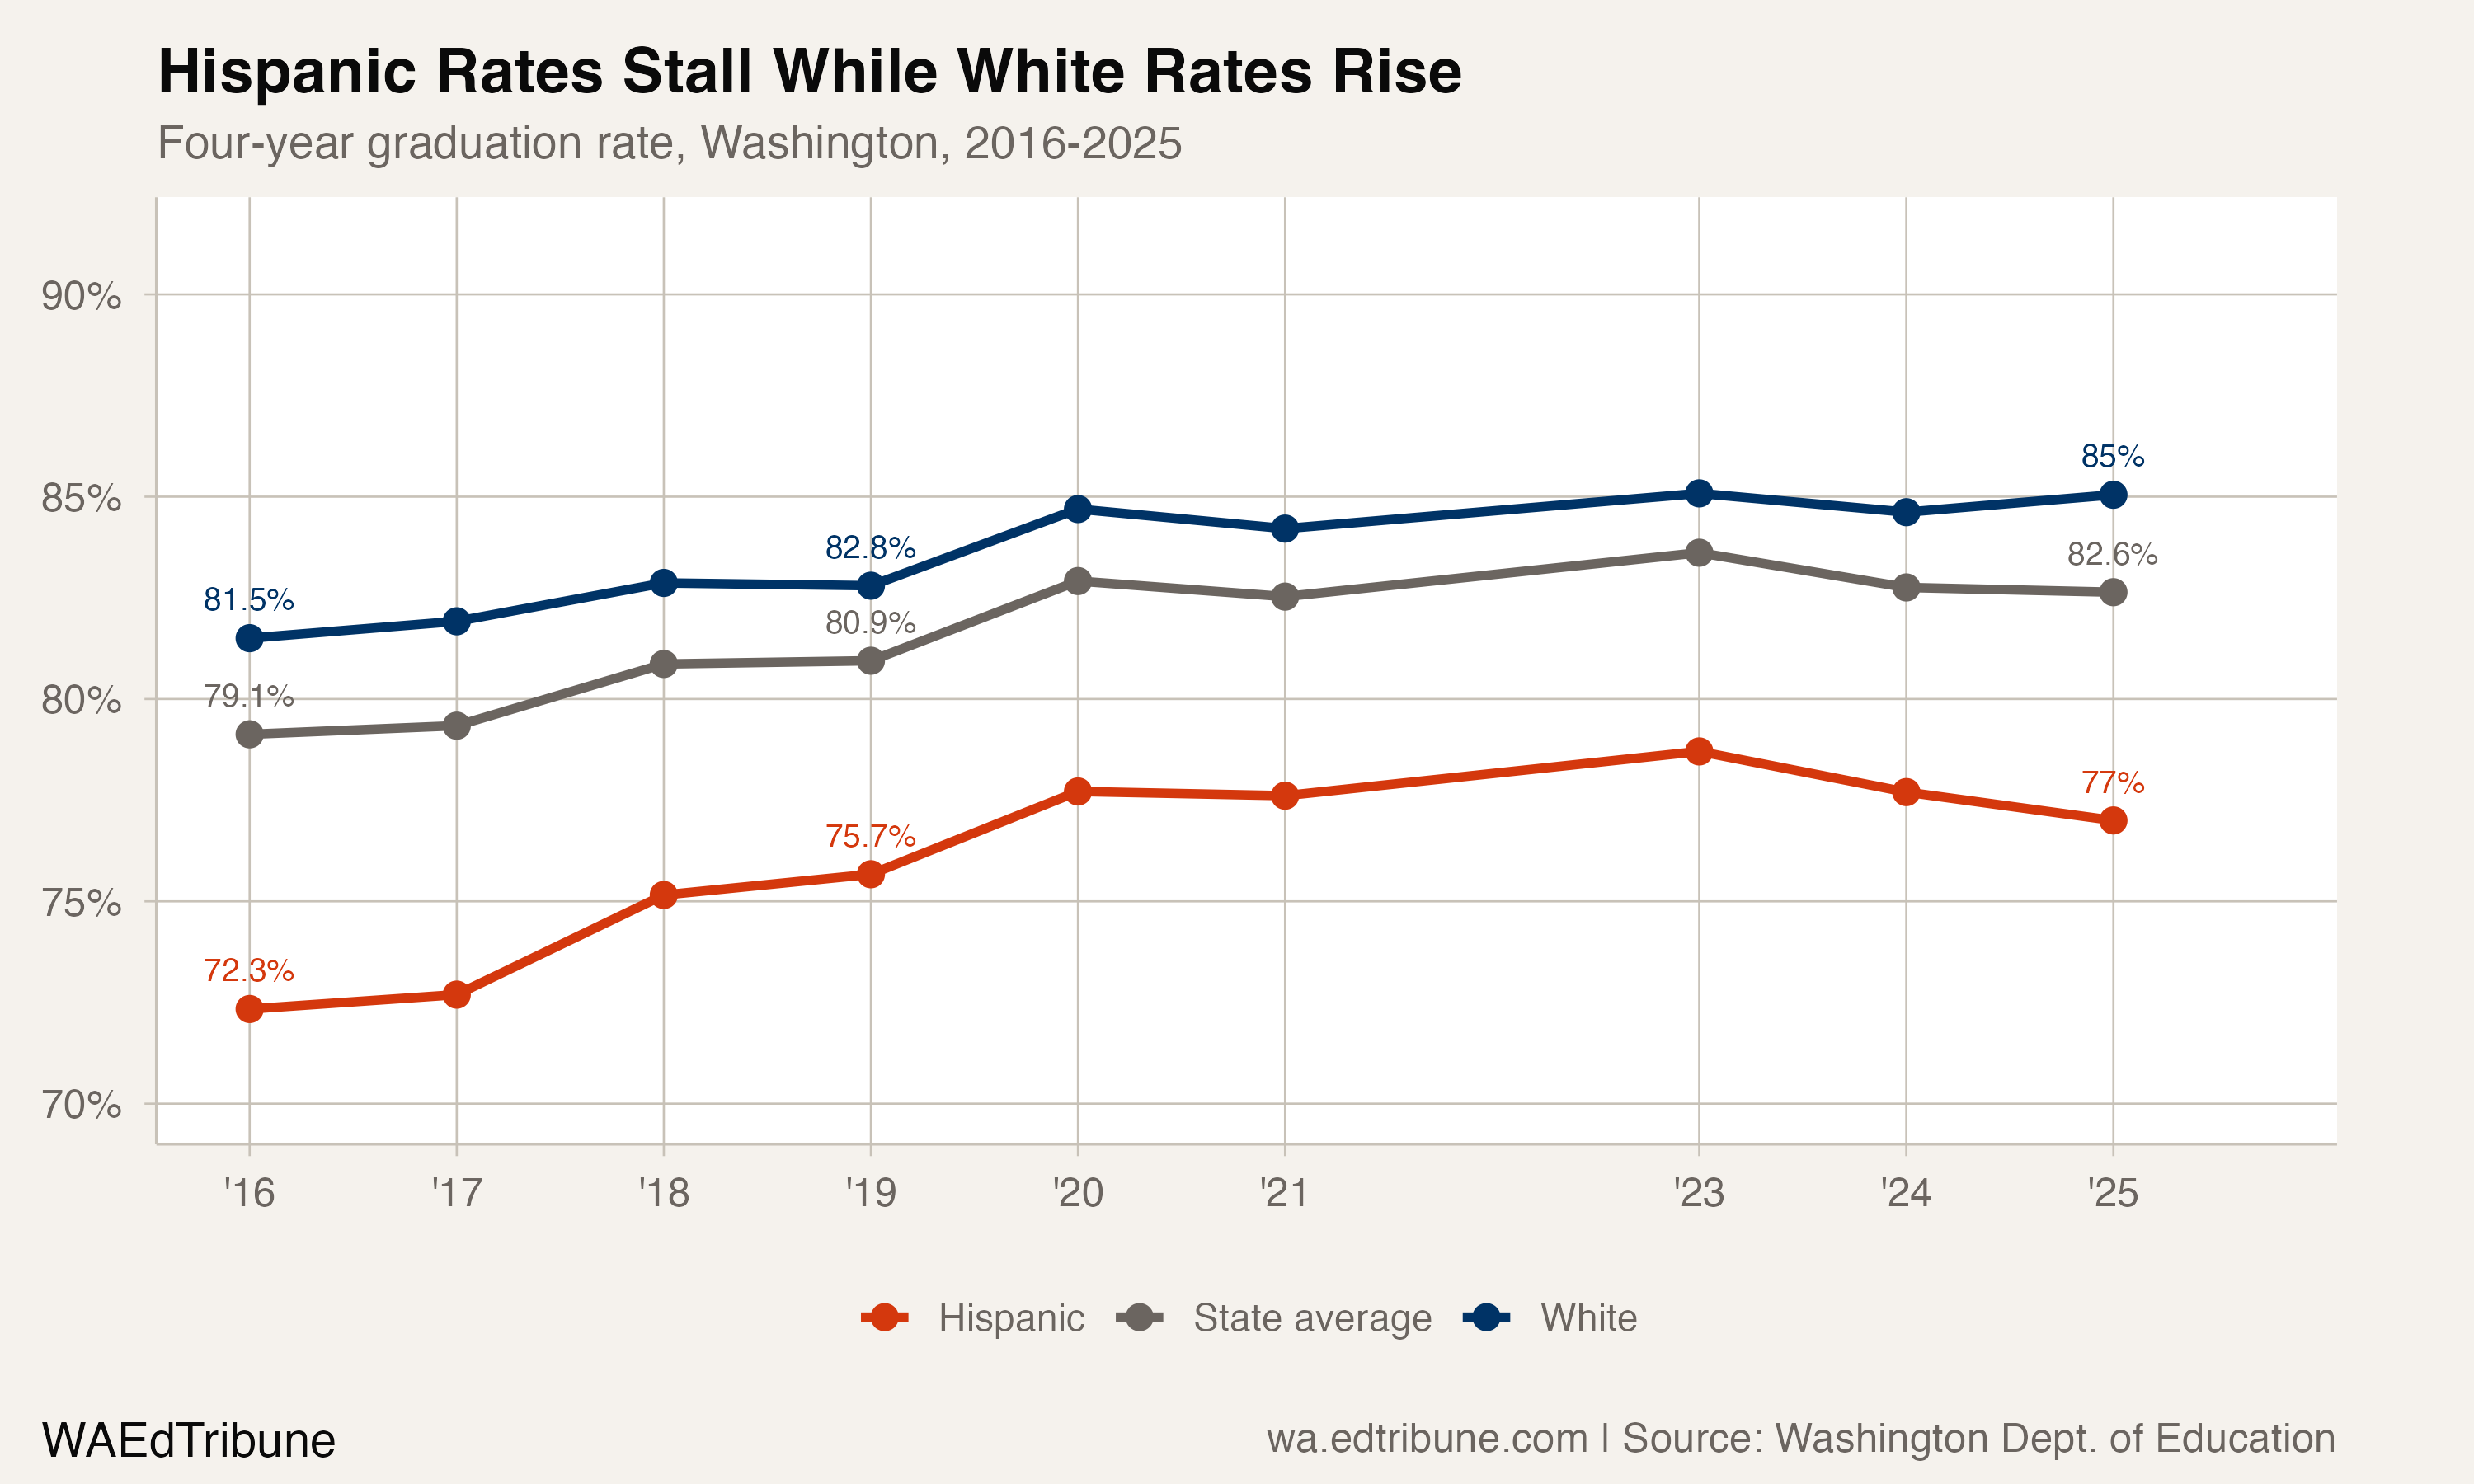
Hispanic four-year graduation rates rose from 72.3% in 2016 to a peak of 78.7% in 2023, a gain of 6.4 points over seven annual transitions. White rates rose from 81.5% to 85.1% over the same period, a gain of 3.6 points. Hispanic students were closing the gap because they were improving faster, and most of that happened by 2022: from 2016 to 2022 the Hispanic rate gained 6.2 points and the white rate 1.3.
The Class of 2023 broke the pattern. The white rate jumped 2.3 points to 85.1% while the Hispanic rate rose 0.2 points, and the gap widened. Then the Class of 2024 brought the Hispanic rate down: it dropped a full point to 77.7%, then fell again to 77.0% for the Class of 2025. White rates held steady at 84.6% and 85.0%. The state average, which had climbed from 79.1% to 83.6%, also flattened, settling at 82.6% in 2025. But the Hispanic deceleration was sharper. The 2025 Hispanic rate is below its 2020 level even as the published cohort is larger.
The five-year graduation rate tells a similar story. Washington reports the five-year rate one year behind the four-year rate, so the 80.7% published for 2025 describes the class that was scheduled to finish in 2024, down from 82.0% two years earlier. That class finished at 77.7% on the four-year clock, so the extra year added 3.0 points: a meaningful share of Hispanic students are finishing on a delayed timeline. But even that safety net is fraying.
The two gaps that reversed
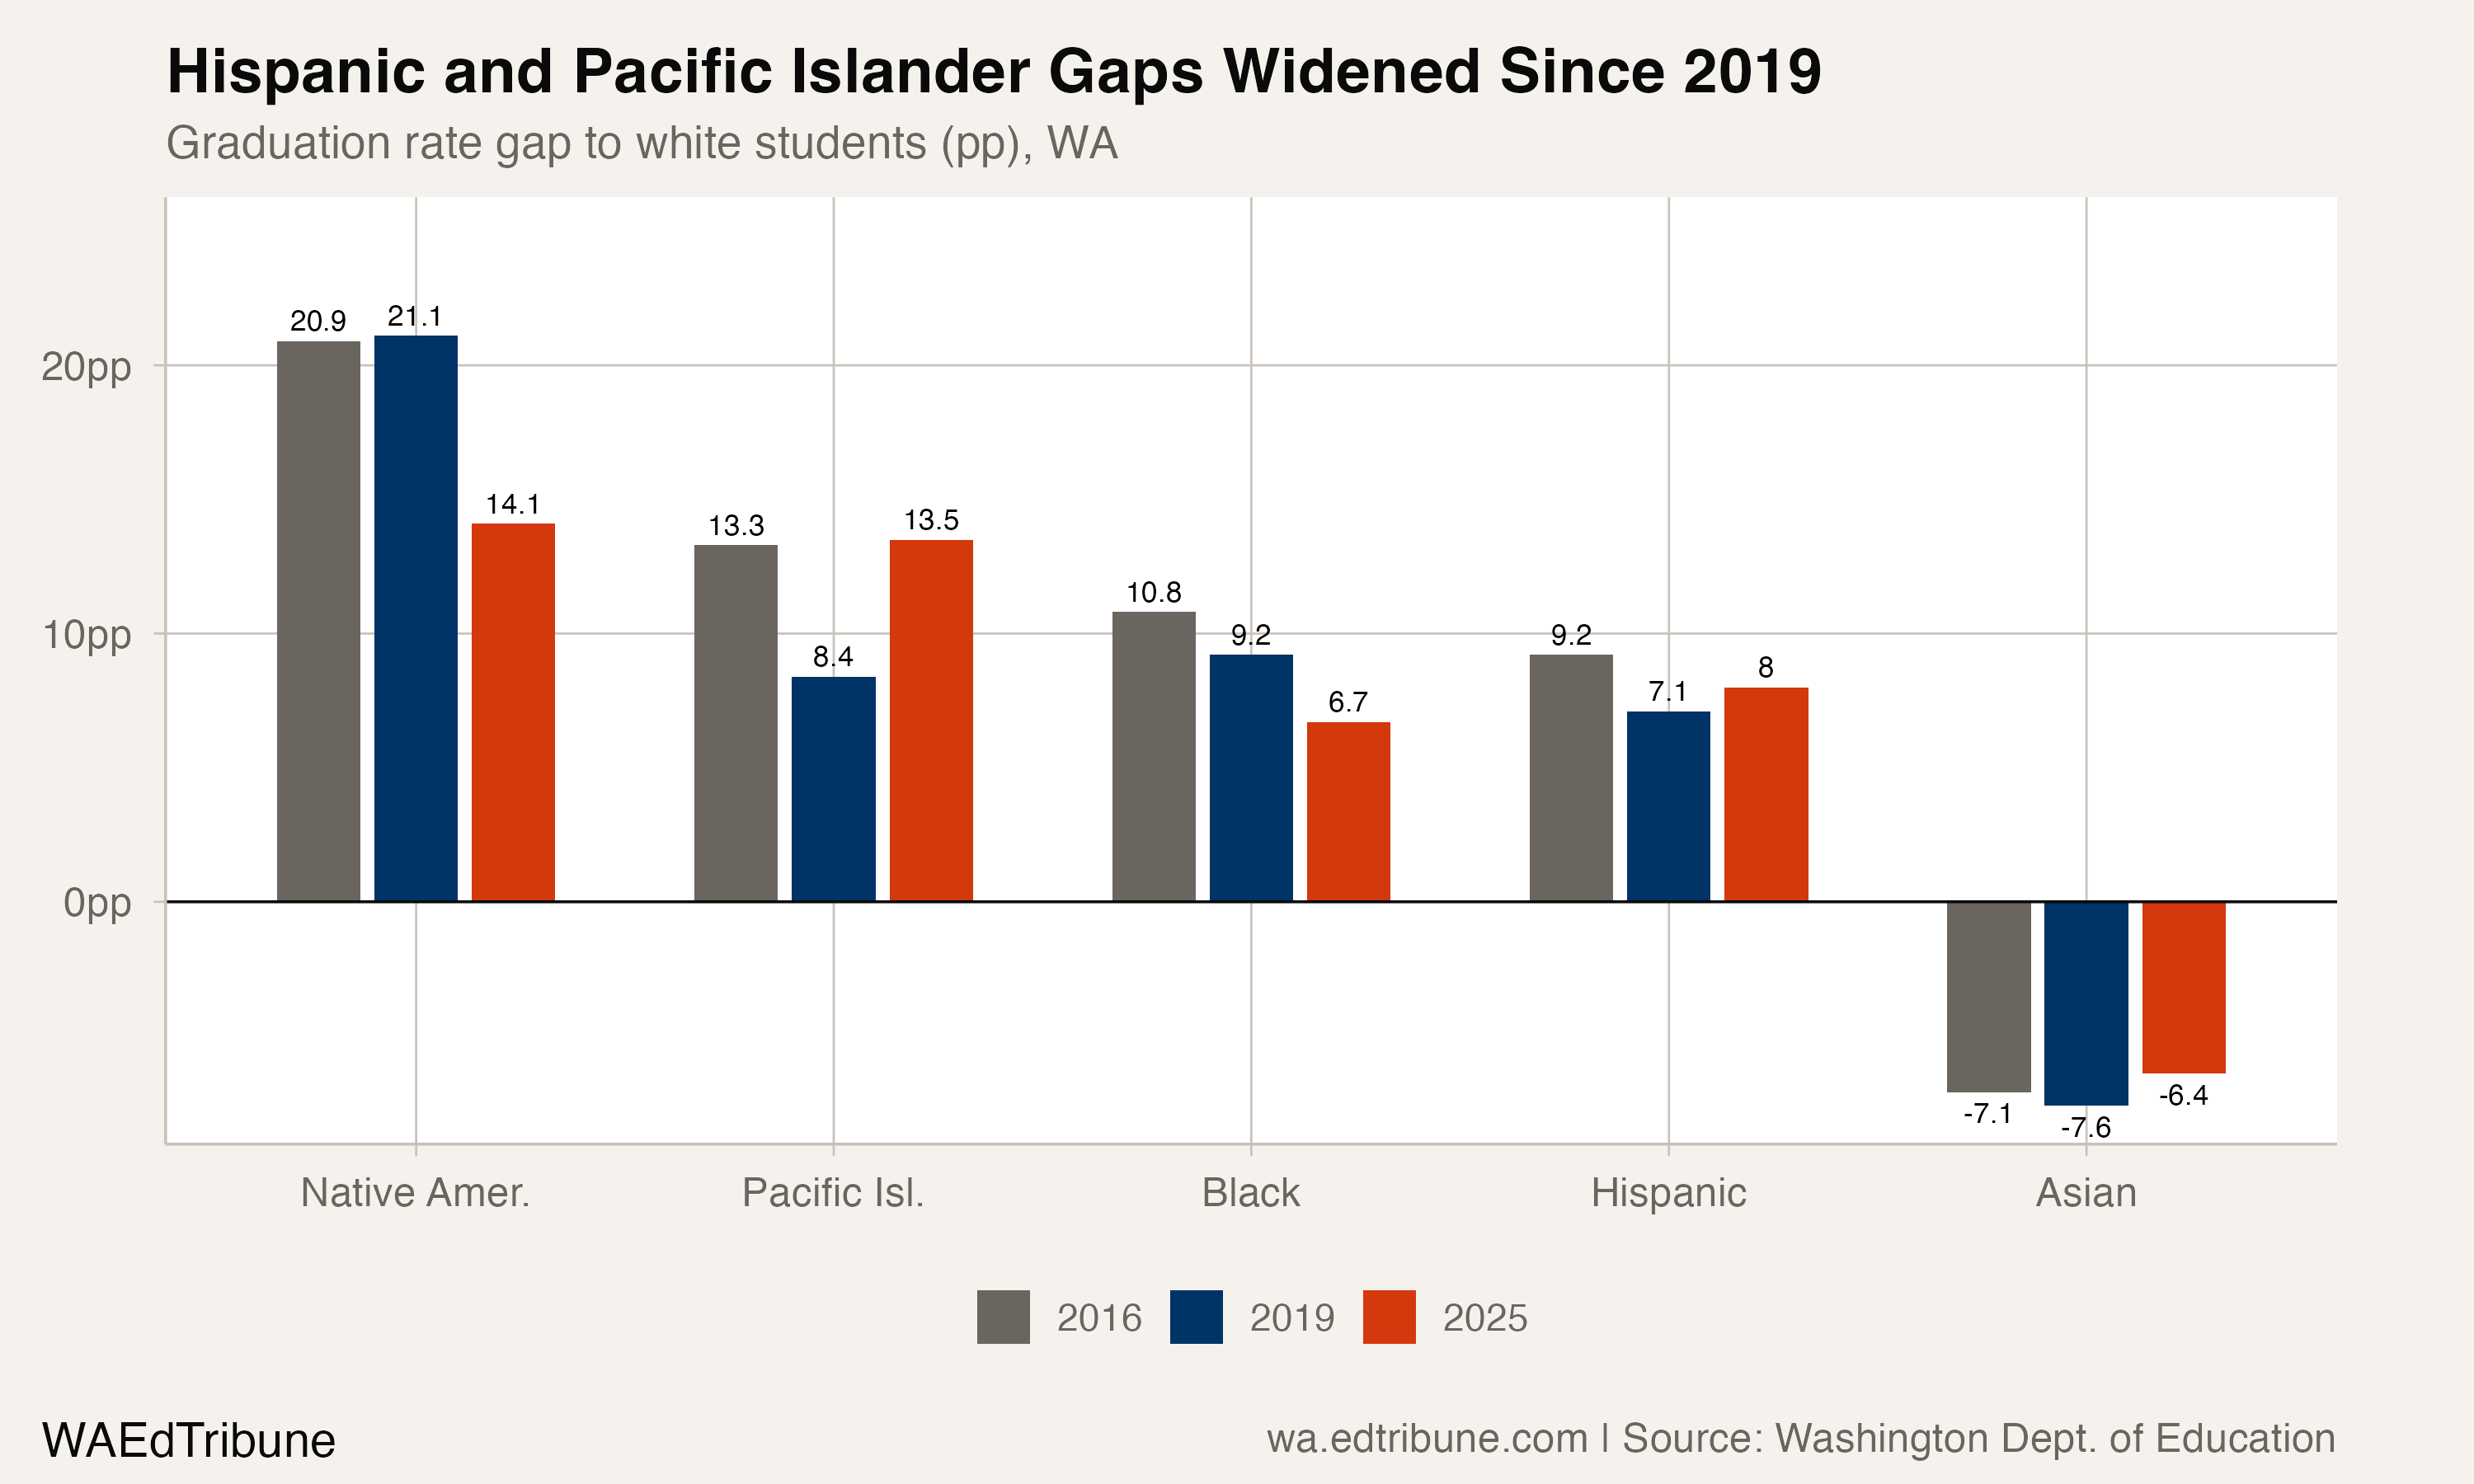
Between 2019 and 2025, every major racial equity gap in Washington's graduation rates narrowed except two. The Black-white gap fell 2.5 points. The Native American-white gap narrowed by 7.0 points. The multiracial-white gap shrank by 0.6 points.
The Hispanic-white gap widened 0.9 points. The Pacific Islander-white gap widened 5.1 points, a steeper reversal, though it involves a much smaller cohort (1,326 students compared to 24,242 Hispanic students).
Over the longer horizon from 2016, the Hispanic gap did narrow, from 9.2 to 8.0 points. But that 1.2-point improvement is the smallest of any group that closed ground at all. Black students closed 4.1 points. Native American students closed 6.8 points. Multiracial students closed 2.6 points. Only Pacific Islander students did worse than Hispanic students over the decade, ending 0.2 points further behind than they started.
A growing count
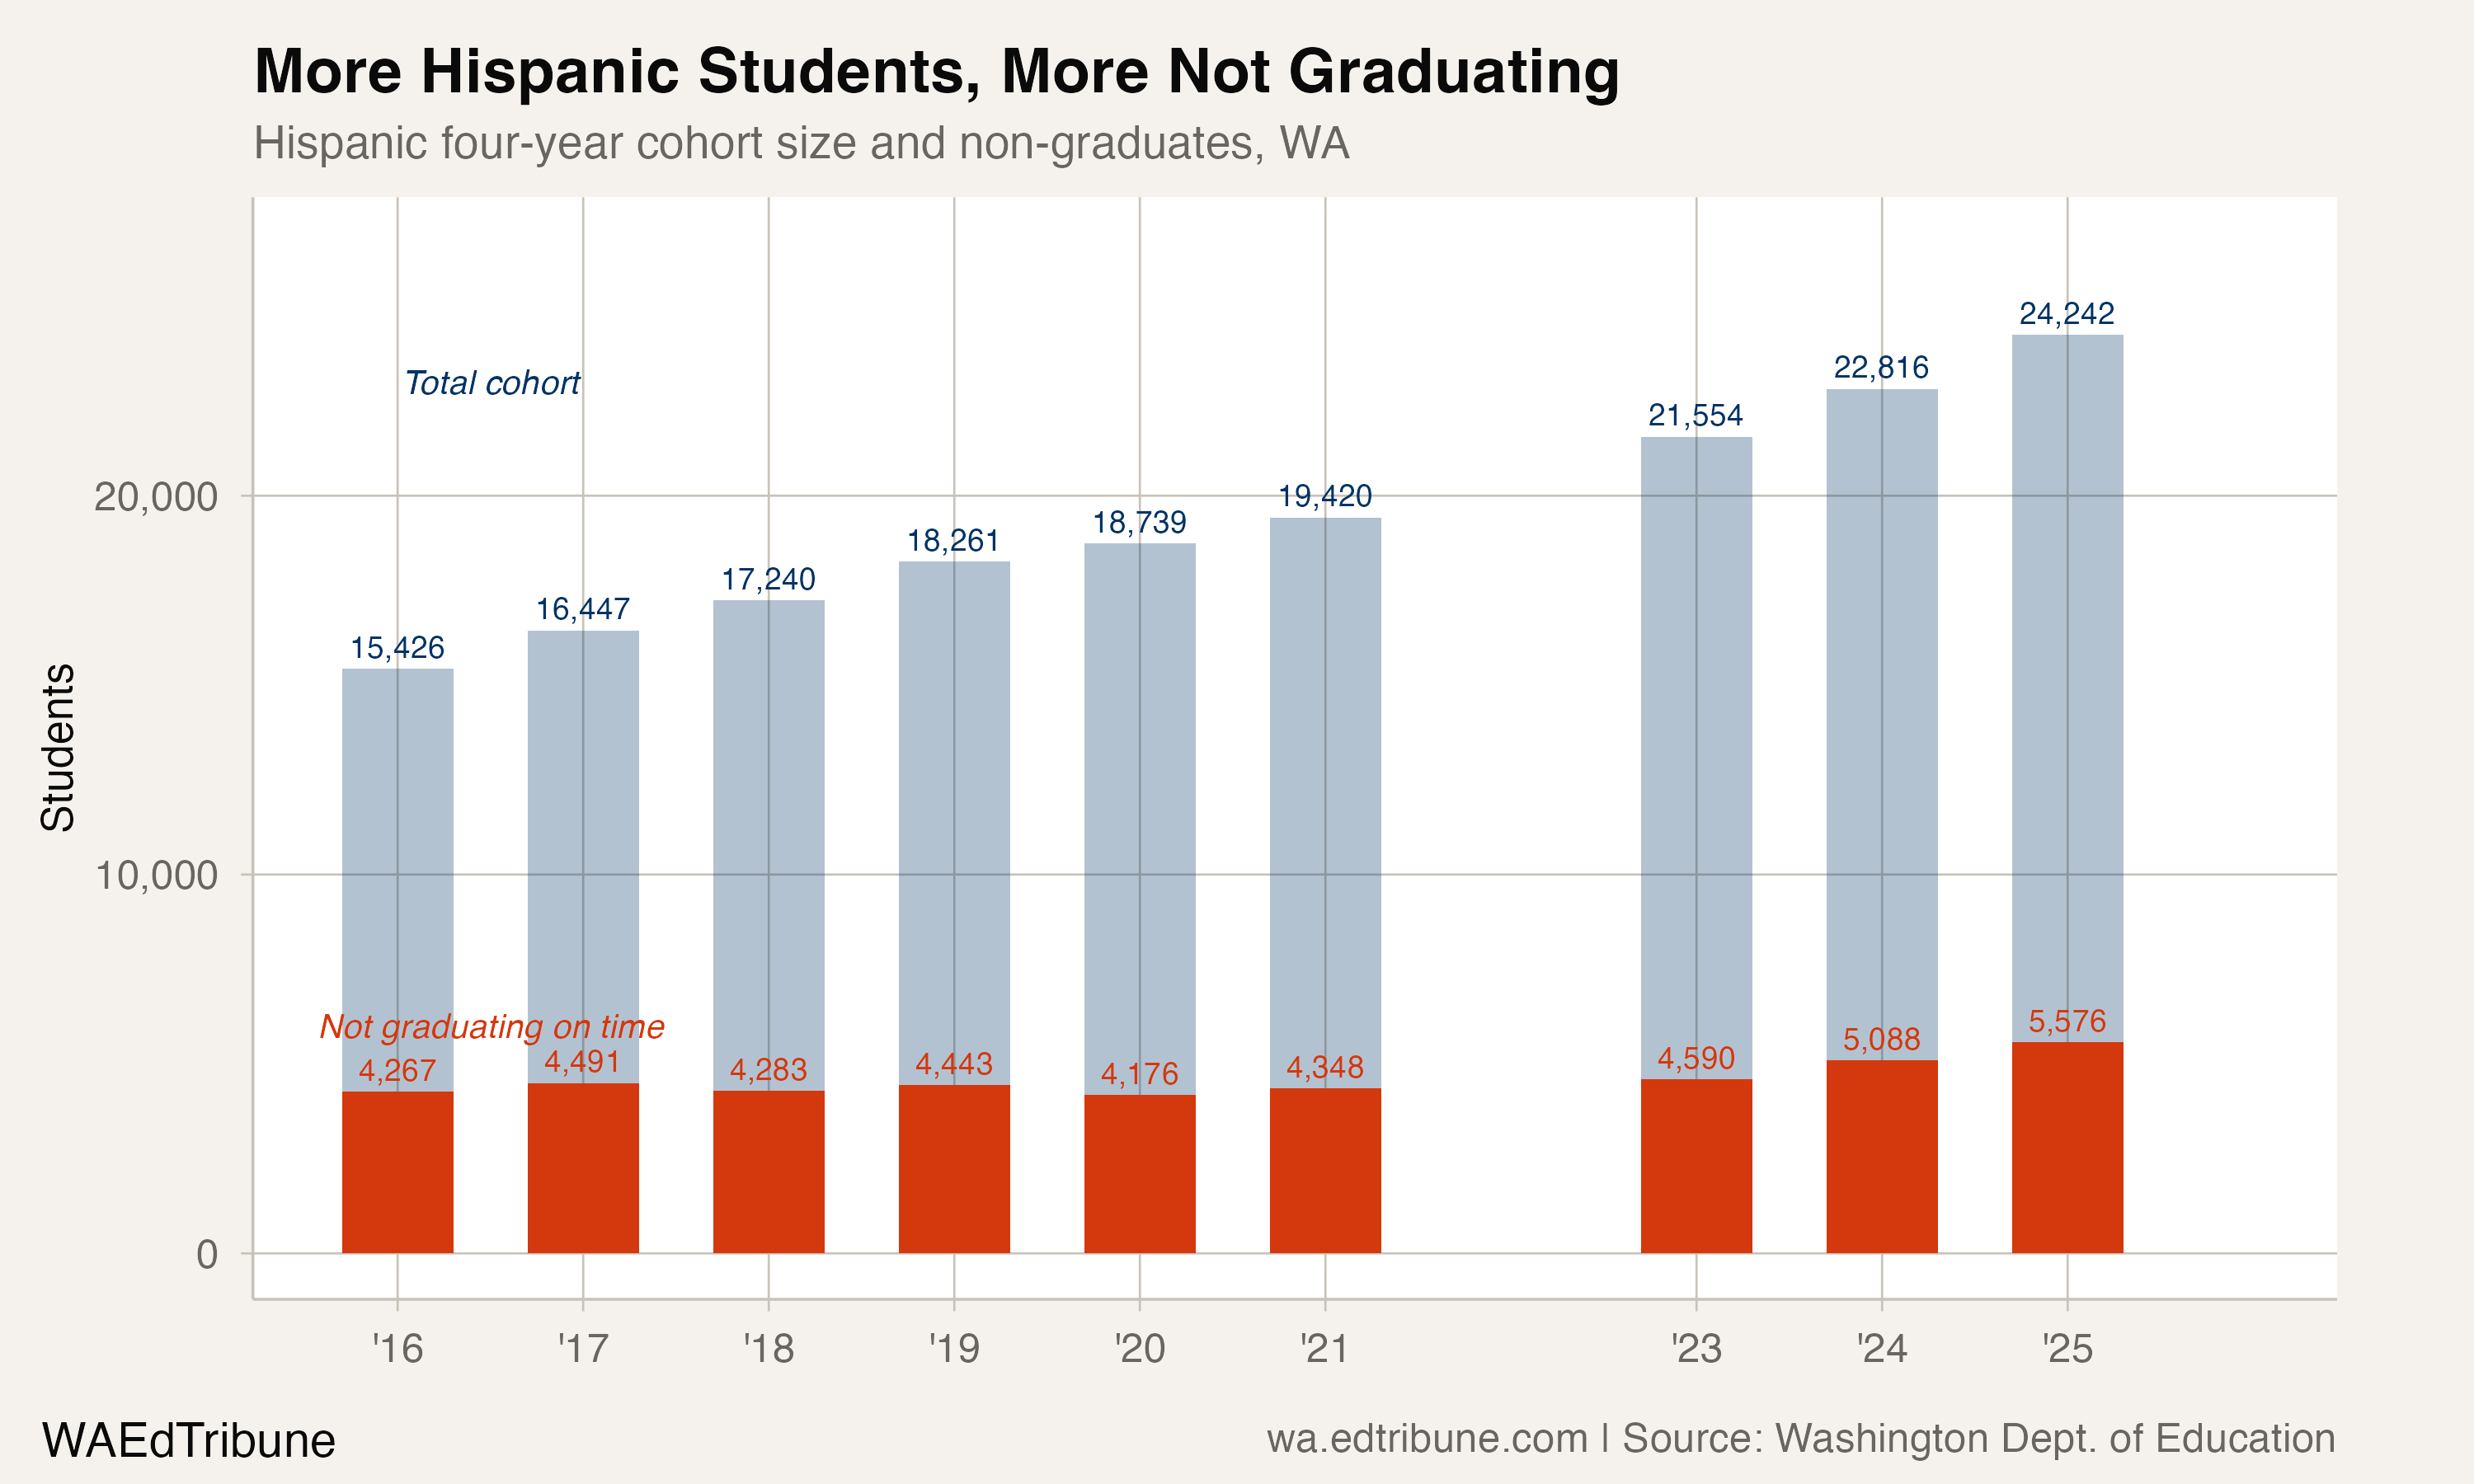
The cohort math compounds the rate stall. In 2016, 15,426 Hispanic students entered the four-year graduation window. By 2025, that number reached 24,242, a 57.2% increase. At the 2016 rate of 72.3%, those 24,242 students would have produced roughly 6,706 non-graduates. At the 2025 rate of 77.0%, the actual number is 5,576. The rate improvement reduced non-graduation, but not enough to offset the cohort growth entirely.
The result: 1,309 more Hispanic students failed to graduate on time in 2025 than in 2016, even though the rate improved 4.7 points over that span. Since the 2023 peak rate, the deterioration is steeper. From 4,590 non-graduates in 2023 to 5,576 in 2025, an increase of 986 in just two years.
Where it widened
Bellevue's decline is the most visible district-level story. Hispanic graduation there dropped from 84.3% in 2019 to 68.1% in 2025, a 16.2-point decline, while the white rate barely moved (93.1% to 91.5%). The gap exploded from 8.8 to 23.4 points. Bellevue's Hispanic cohort also grew from 191 to 310 students over that period, meaning the rate decline is not an artifact of a tiny, volatile sample.
The district's 2024-25 equity plan prioritizes professional development and equity-driven decision-making, but does not specifically target Hispanic graduation outcomes.
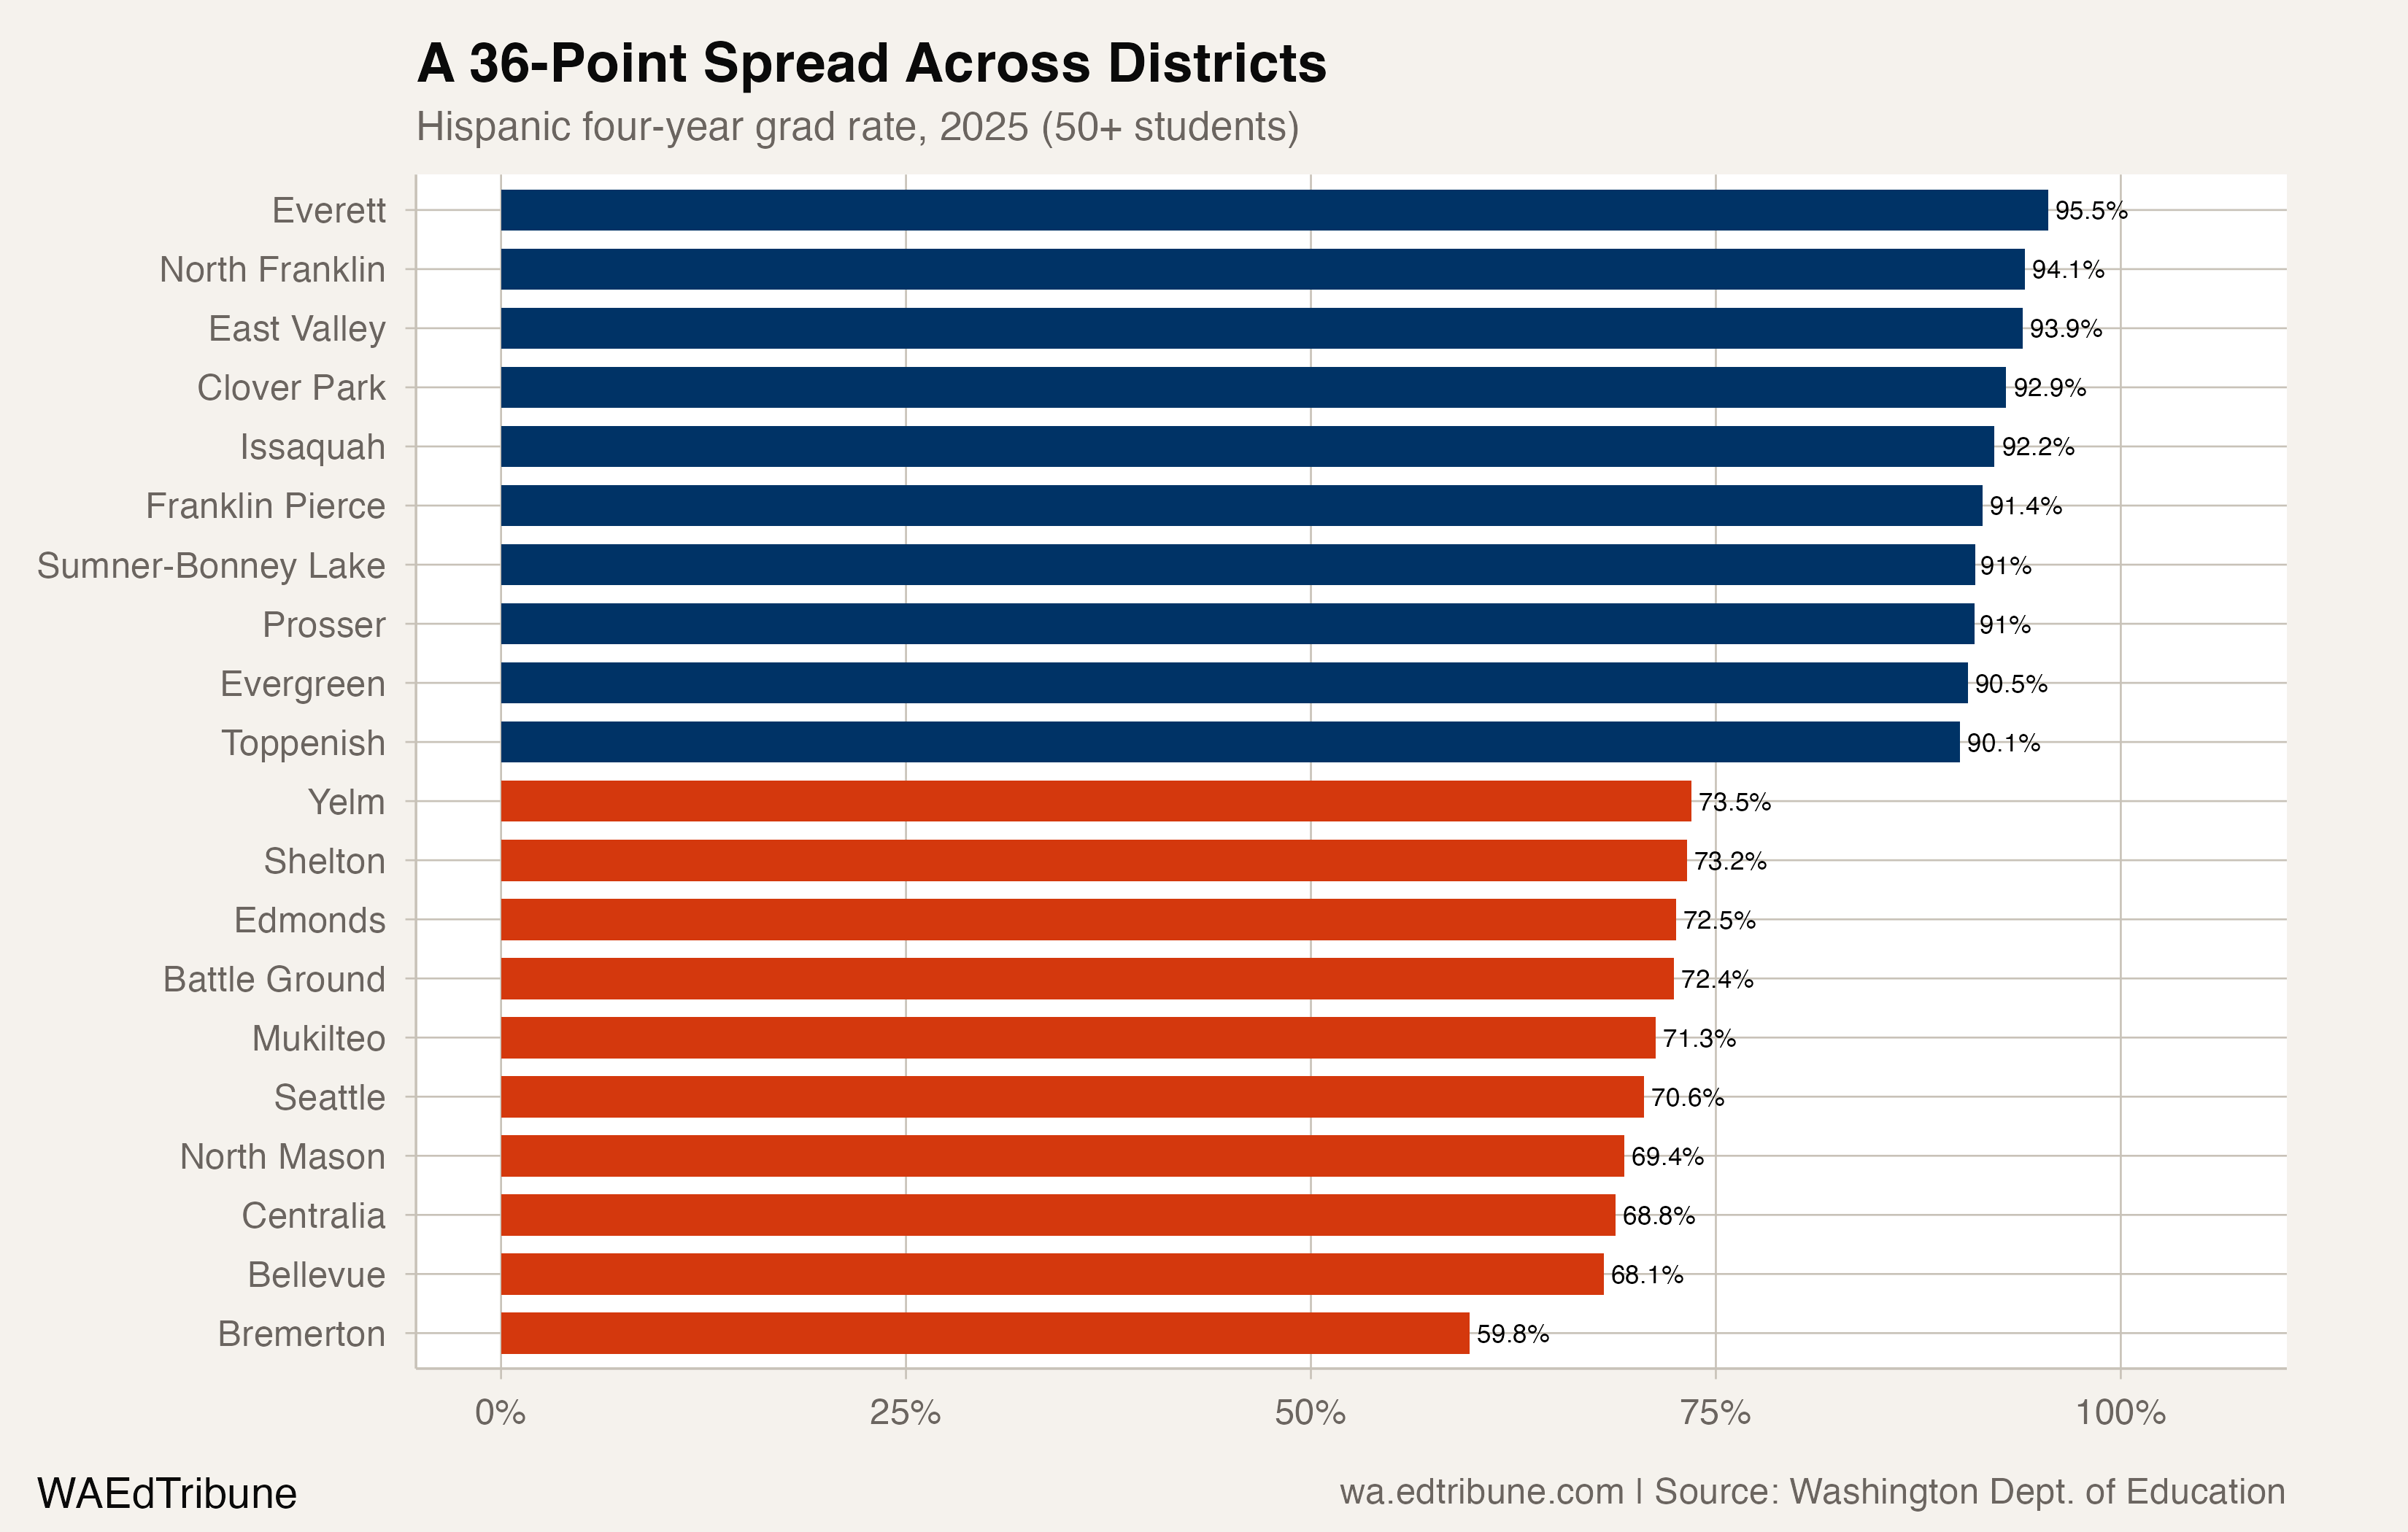
Seattle↗ET posted a 20.2-point gap in 2025 (70.6% Hispanic versus 90.8% white), barely changed from the 20.5-point gap in 2019. Its Hispanic graduating cohort had 707 students. Bremerton↗ET had the lowest Hispanic rate among districts with at least 50 Hispanic students: 59.8%.
Not every district moved in the wrong direction. Pasco↗ET, with the state's largest Hispanic cohort at 1,133 students, narrowed its white-Hispanic gap from 12.1 to 7.7 points. Everett↗ET posted a 95.5% Hispanic graduation rate. East Valley (Yakima) reached 93.9%. Across the 71 districts with at least 50 Hispanic students in the 2025 cohort, the rates run from 59.8% to 95.5%.
The EL intersection
The stall in Hispanic graduation rates coincides with a rapid expansion of English learner enrollment in Washington's graduating cohorts. The EL cohort grew from 4,604 in 2016 to 10,784 in 2025, more than doubling. EL graduation rates peaked at 70.7% in 2023 and have since dropped to 67.5%.
The overlap between EL and Hispanic populations is substantial, though the state does not publish a cross-tabulation of the two. Research from King County schools found a significant negative correlation between English learner population size and program graduation rates, with the largest EL programs achieving drastically lower rates than small ones. Schools with higher proportions of teachers lacking full certification also posted lower EL outcomes.
Washington has a long-term policy answer in its dual-language and tribal-language framework, which the state describes as a preferred bilingual model (House Bill 1228). Whether that framework reaches secondary schools in time to affect graduation rates is an open question. The gap is widening now.
What the acceleration looks like
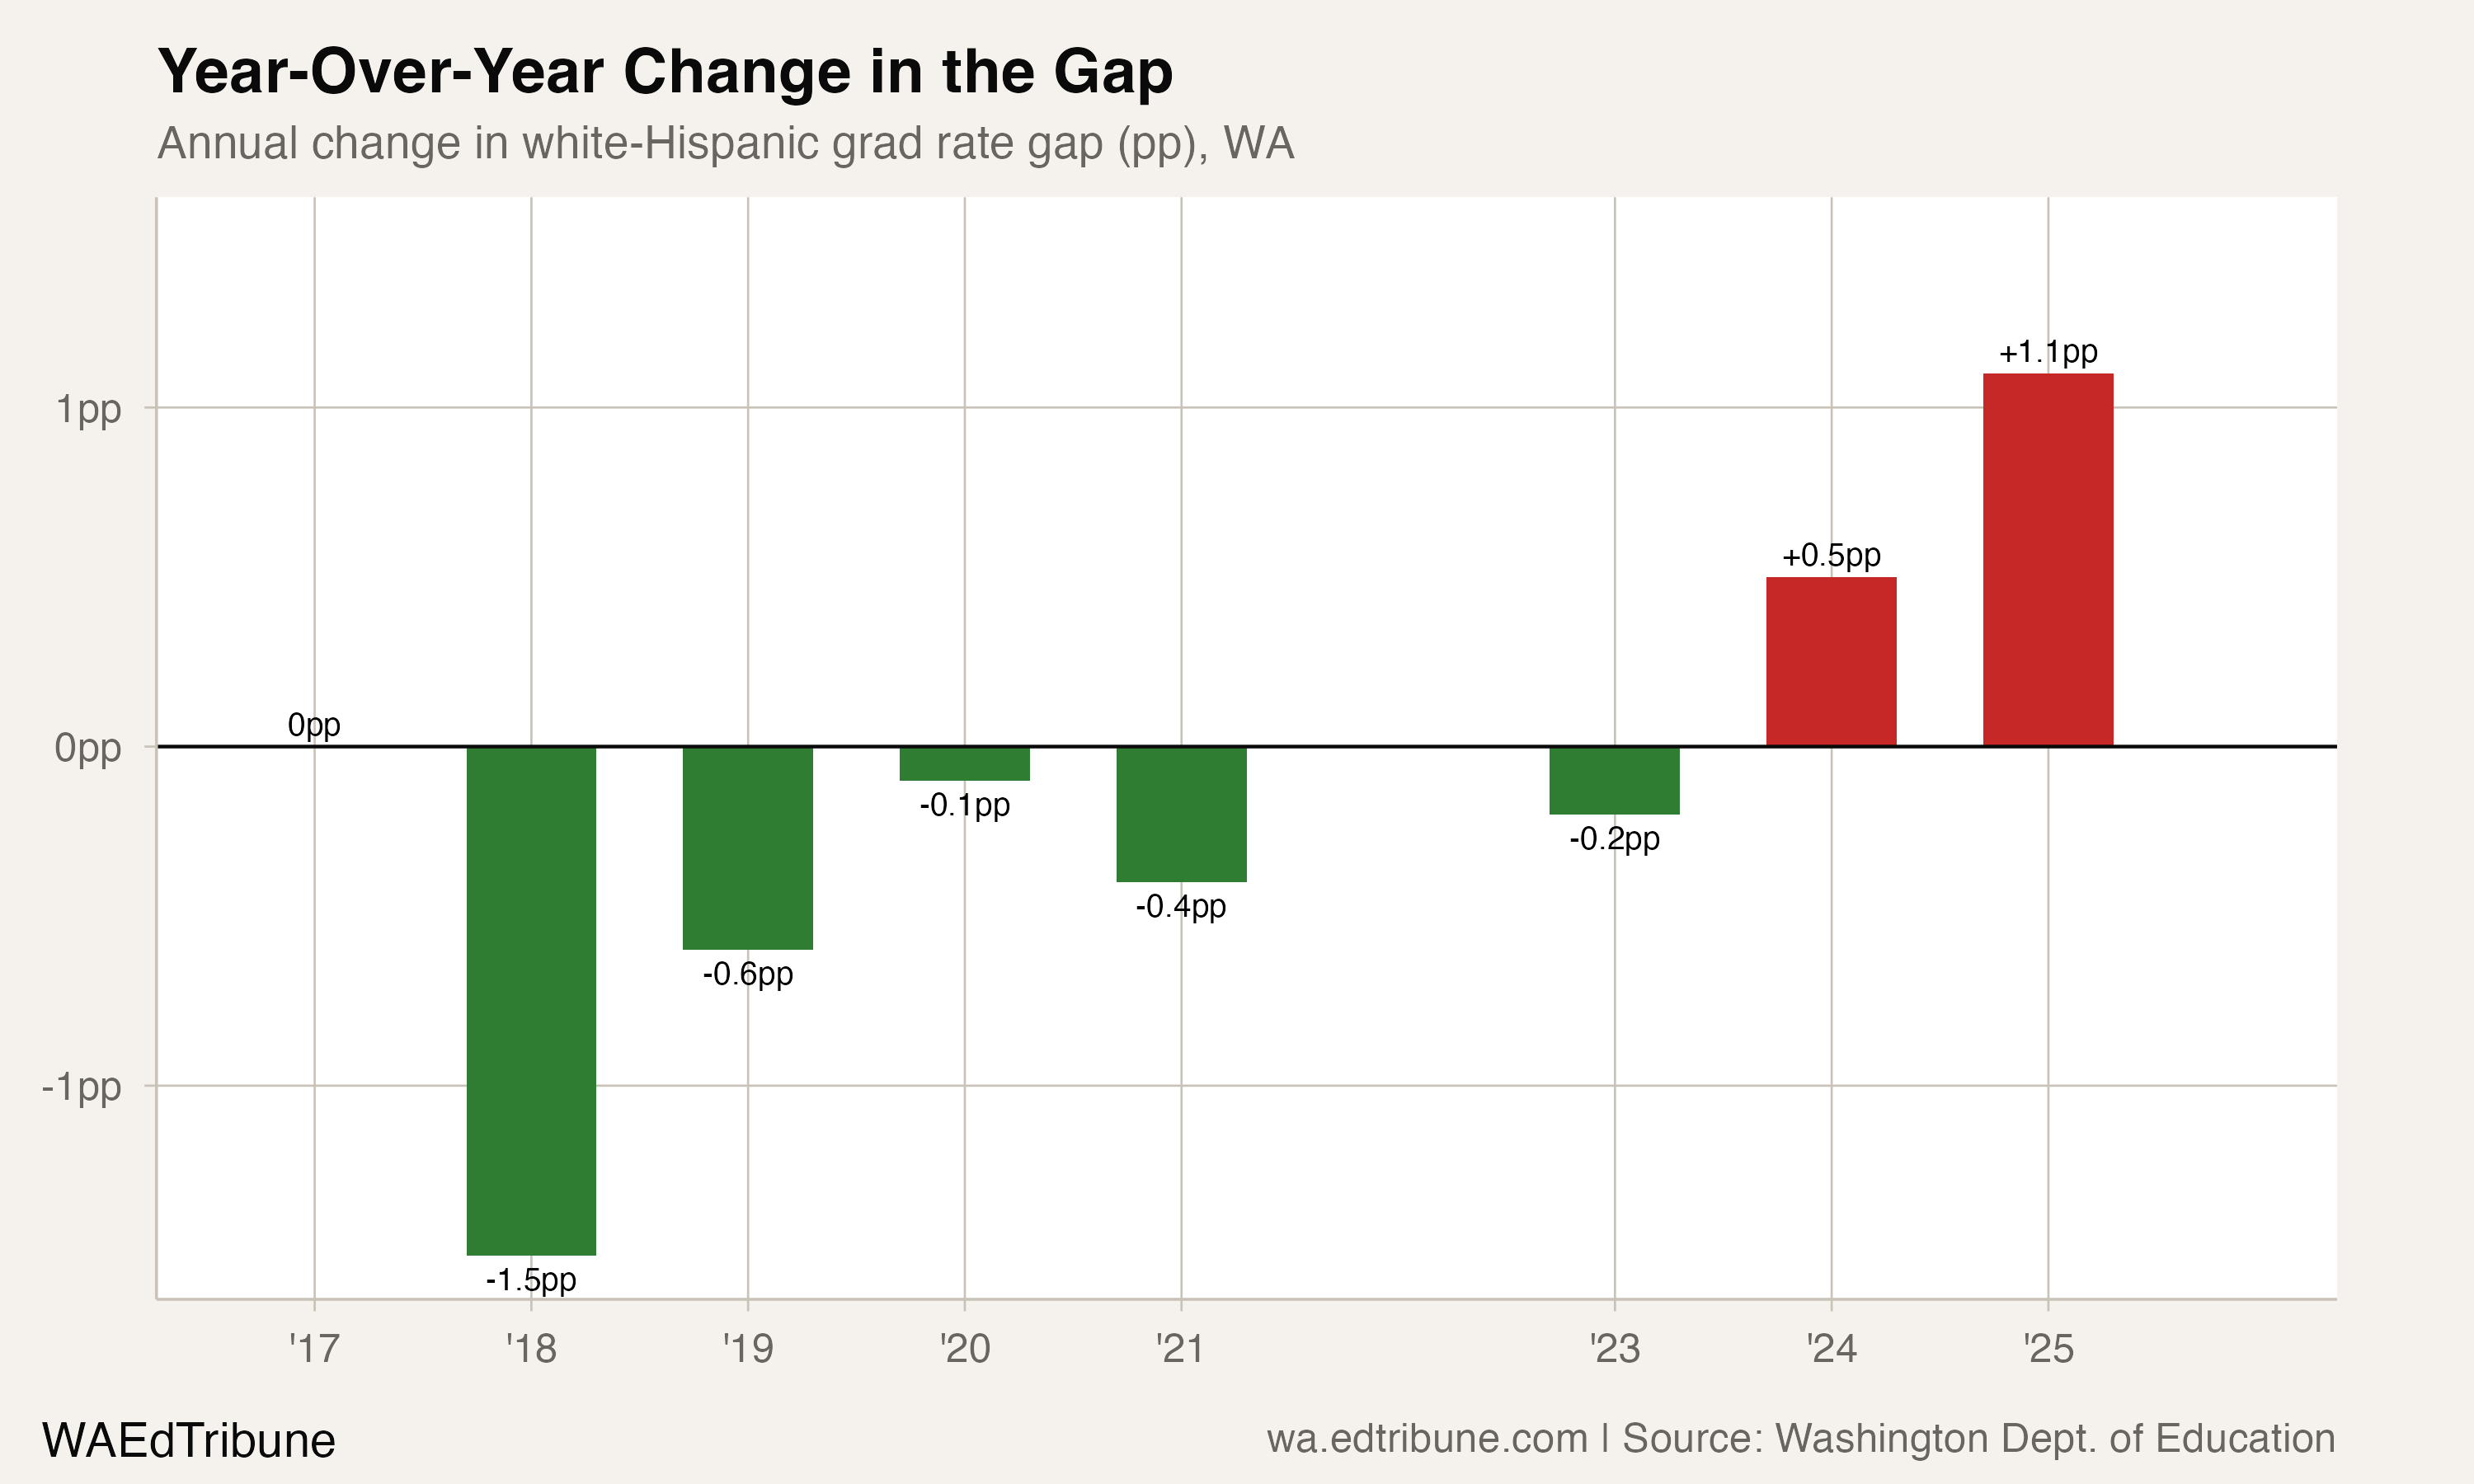
The year-over-year pattern makes the reversal visible. The gap narrowed every year from 2018 through 2022, including a 1.5-point improvement in 2018 and a 2.3-point improvement in 2022. Since then, it has widened three years running: 2.1 points in 2023, 0.5 points in 2024 and 1.1 points in 2025. That 2.1-point widening for the Class of 2023 is the largest single-year move in the wrong direction across the entire series.
Three consecutive years of widening, against a backdrop of a Hispanic cohort that is both growing and enrolling more English learners, suggest this is not random noise. But the data alone cannot distinguish between a temporary disruption (a post-COVID adjustment in grading practices, a shift in course-taking patterns) and a durable regression.
The latest published data show a descriptive pattern, not direct evidence of a cause: the Hispanic four-year rate has fallen in each of the last two reported years, from 78.7% to 77.0%, while the cohort grew by 2,688 students. The number of Hispanic students not finishing on time rose from 4,590 to 5,576 over those same two years, the highest count in the available panel.
Detailed code that reproduces the analysis and figures in this article is available exclusively to EdTribune subscribers.
Discussion
Sign in to join the discussion.
Loading comments...