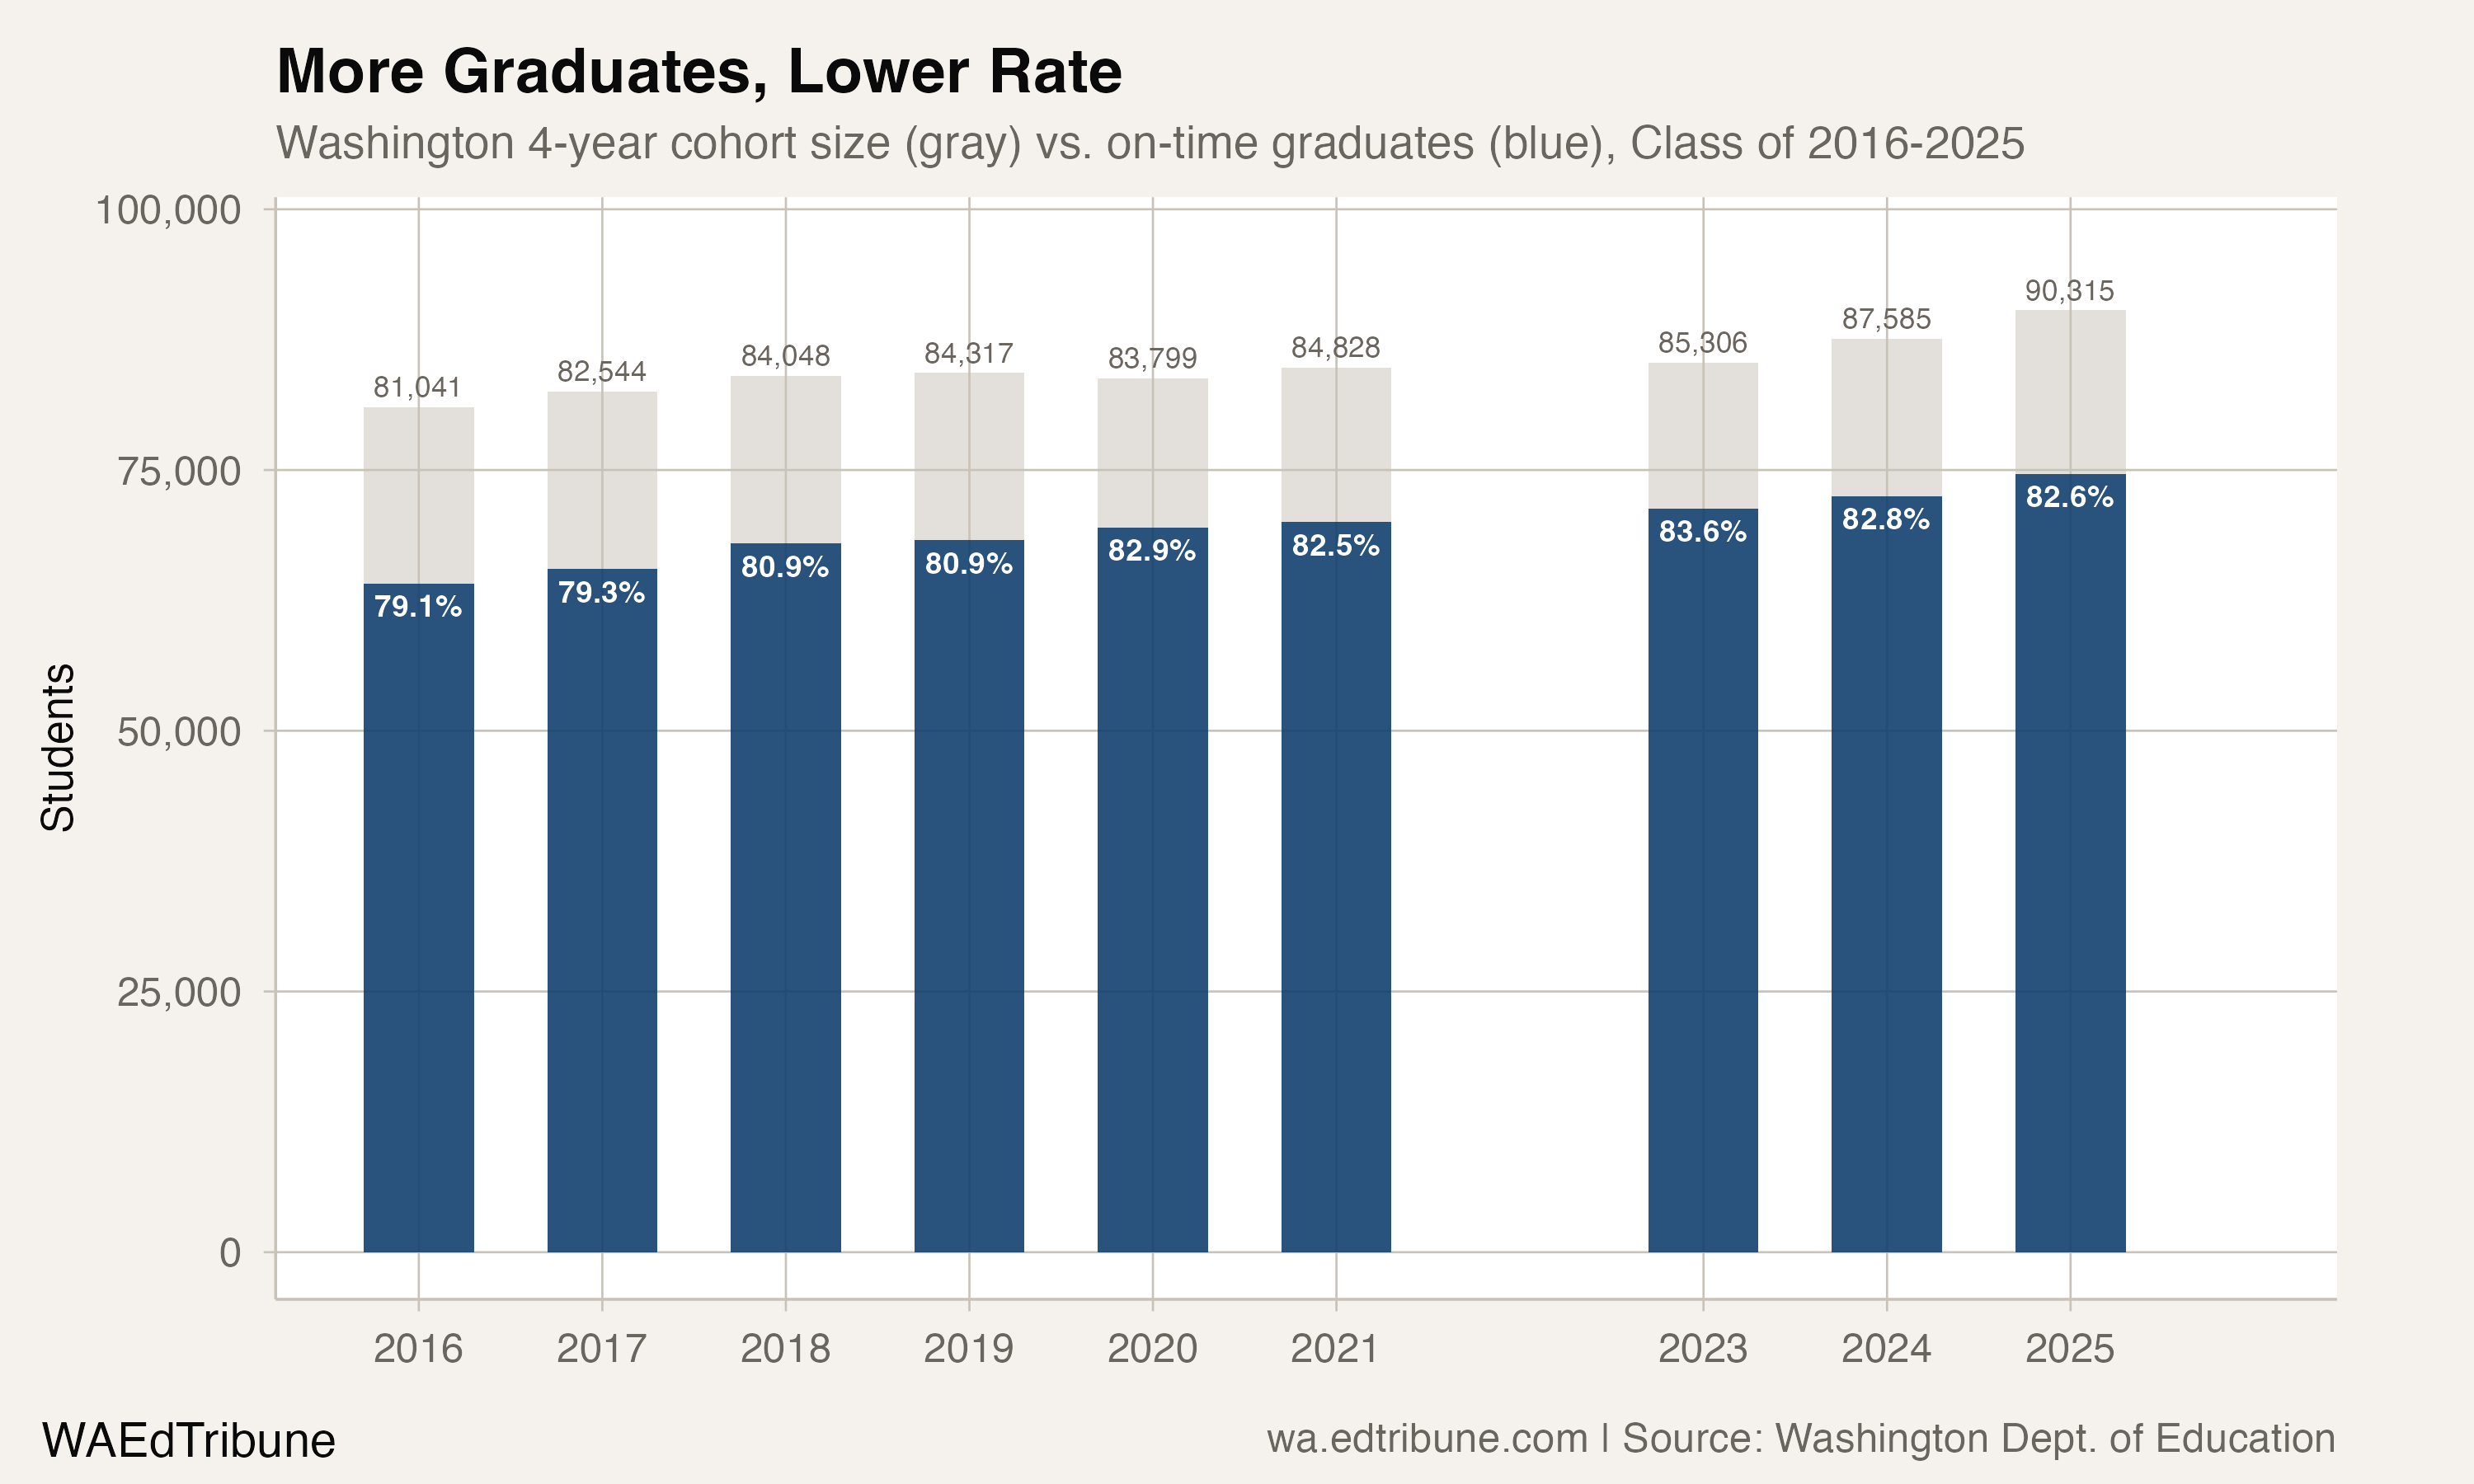
Washington state handed diplomas to 74,636 seniors in the Class of 2025. It was the most on-time graduates the state has ever produced, topping the previous year's record by more than 2,100. And yet the four-year graduation rate slipped for the second consecutive year, falling to 82.6% after peaking at 83.6% for the Class of 2023.
The paradox is arithmetic, not metaphor. The graduating cohort has been swelling: 90,315 seniors entered the four-year window for the Class of 2025.
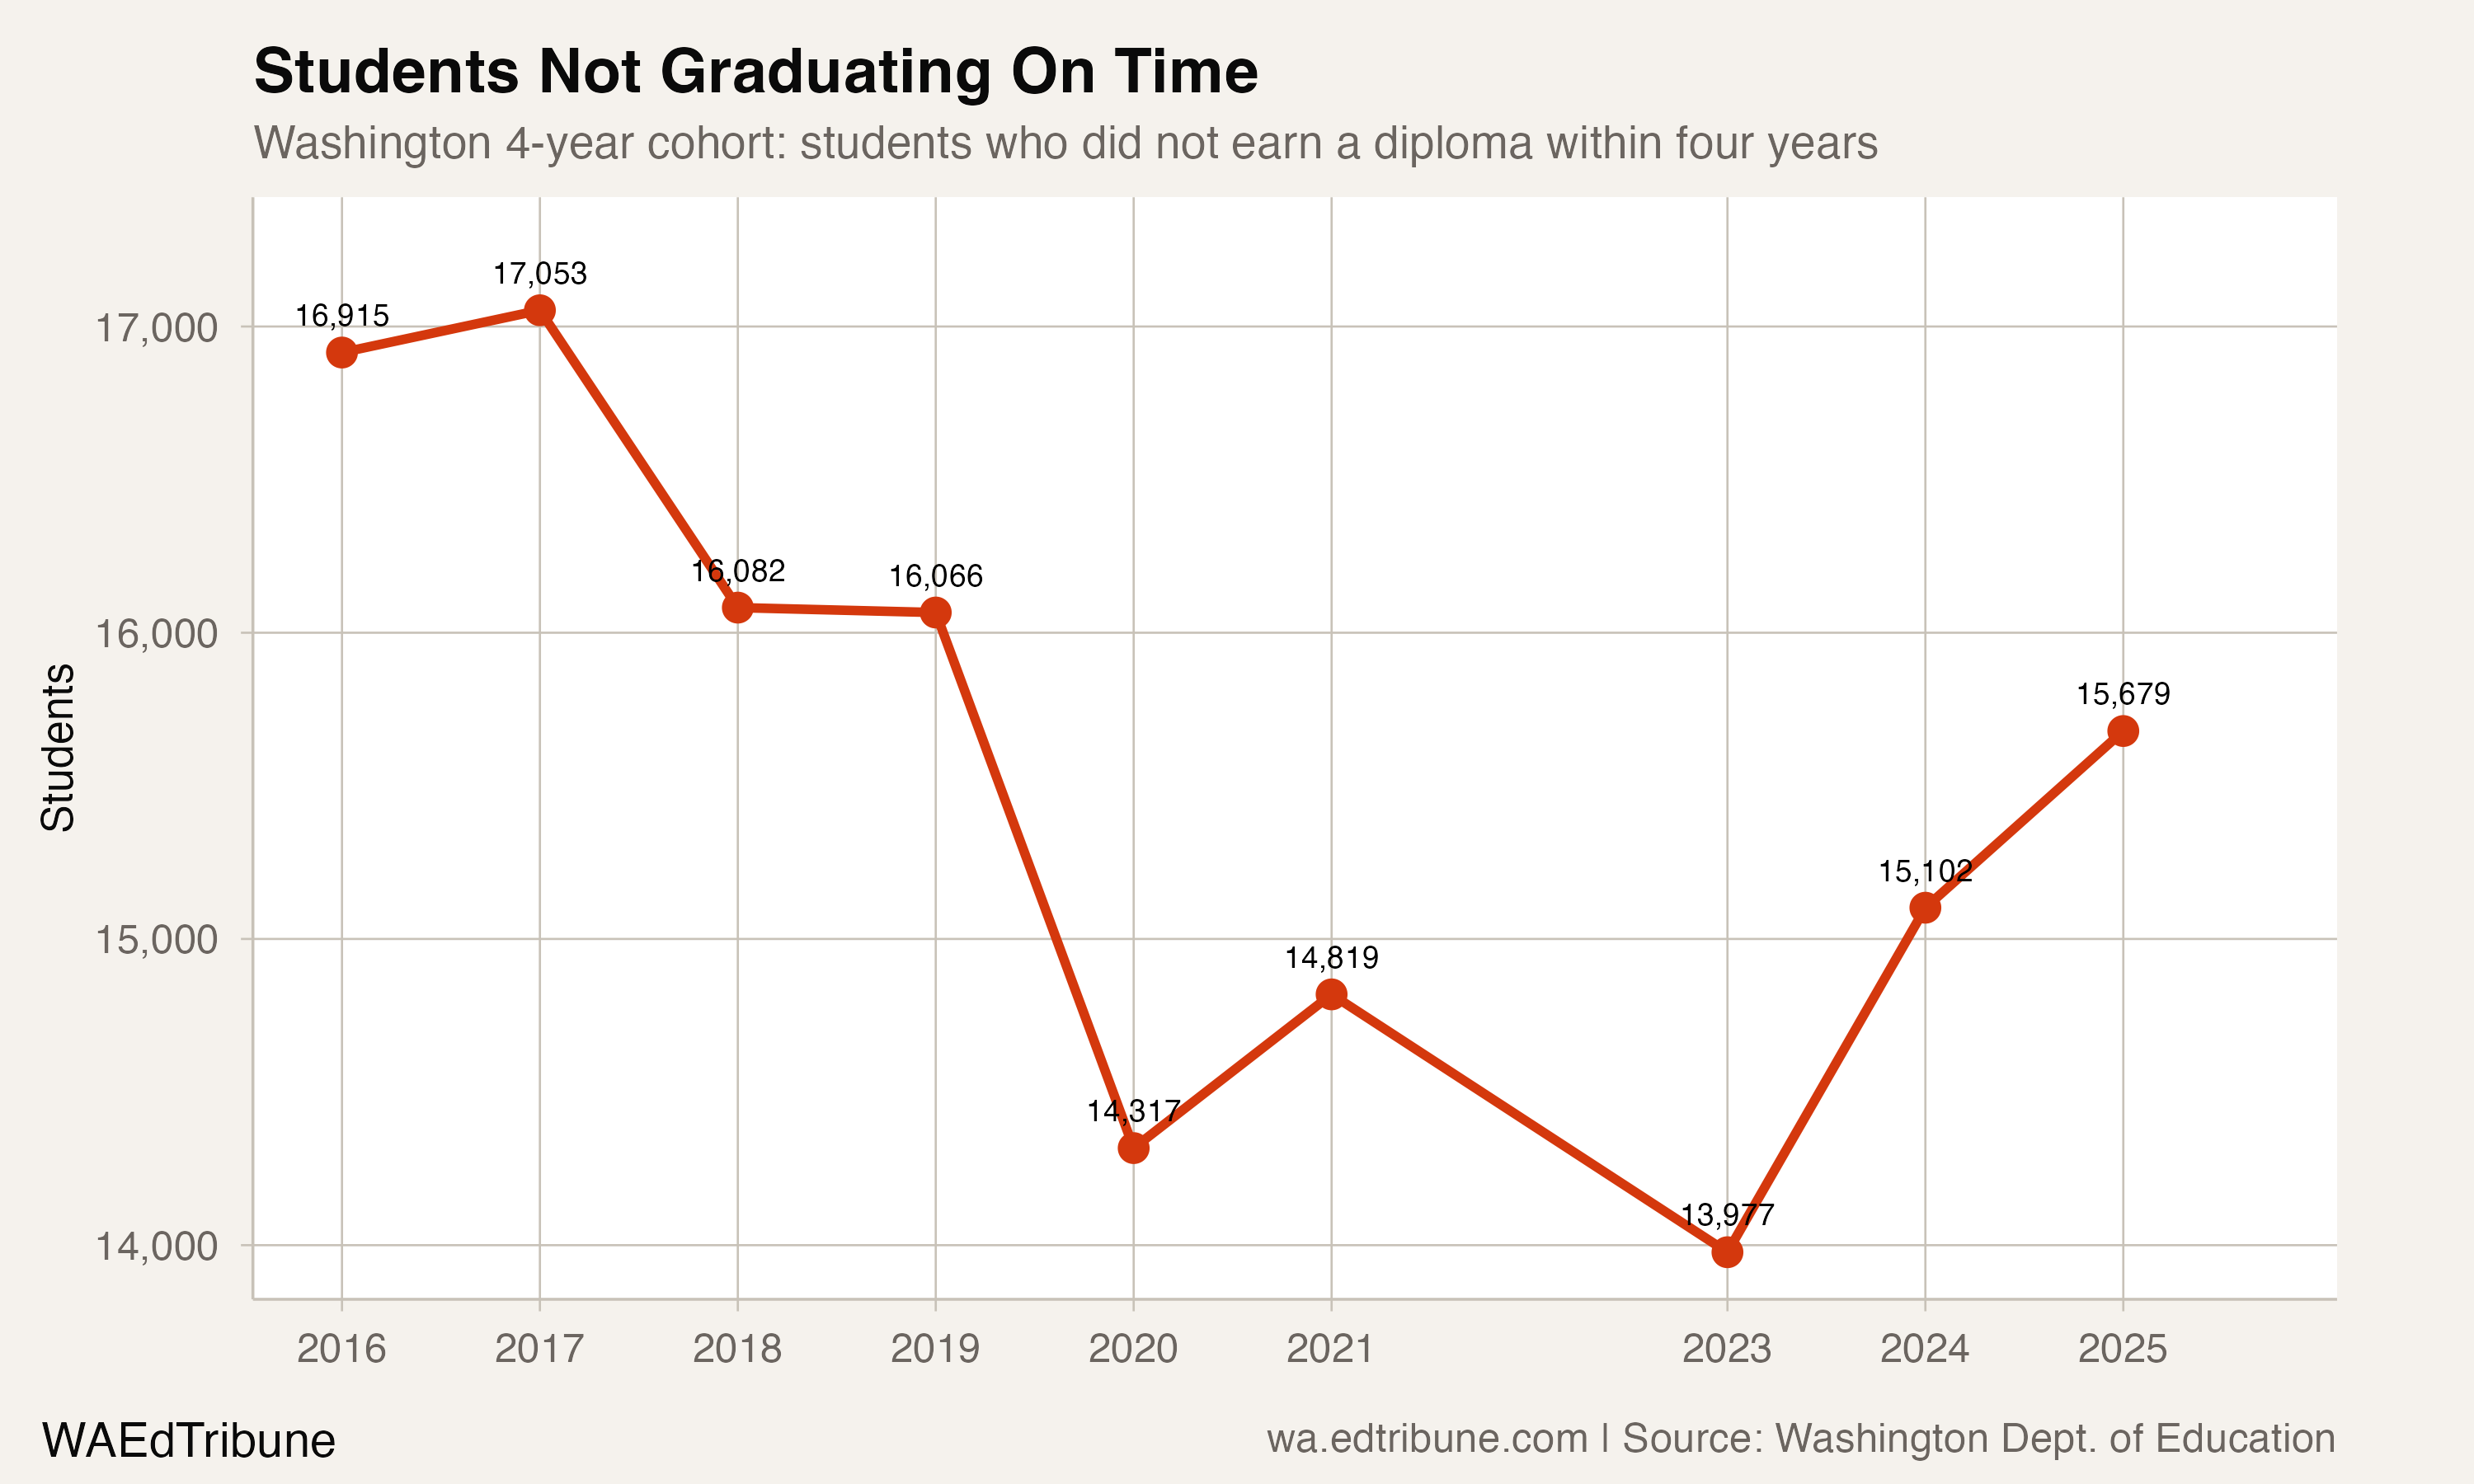
The comparable cohort contained 81,041 students in 2016. That 11.4% growth in the pipeline has outrun the system's ability to move students through it on time. The result is a state producing more graduates while losing ground on the rate, and 15,679 students who did not finish within four years, up from 13,977 just two years ago.
A Decade of Progress, Then a Reversal
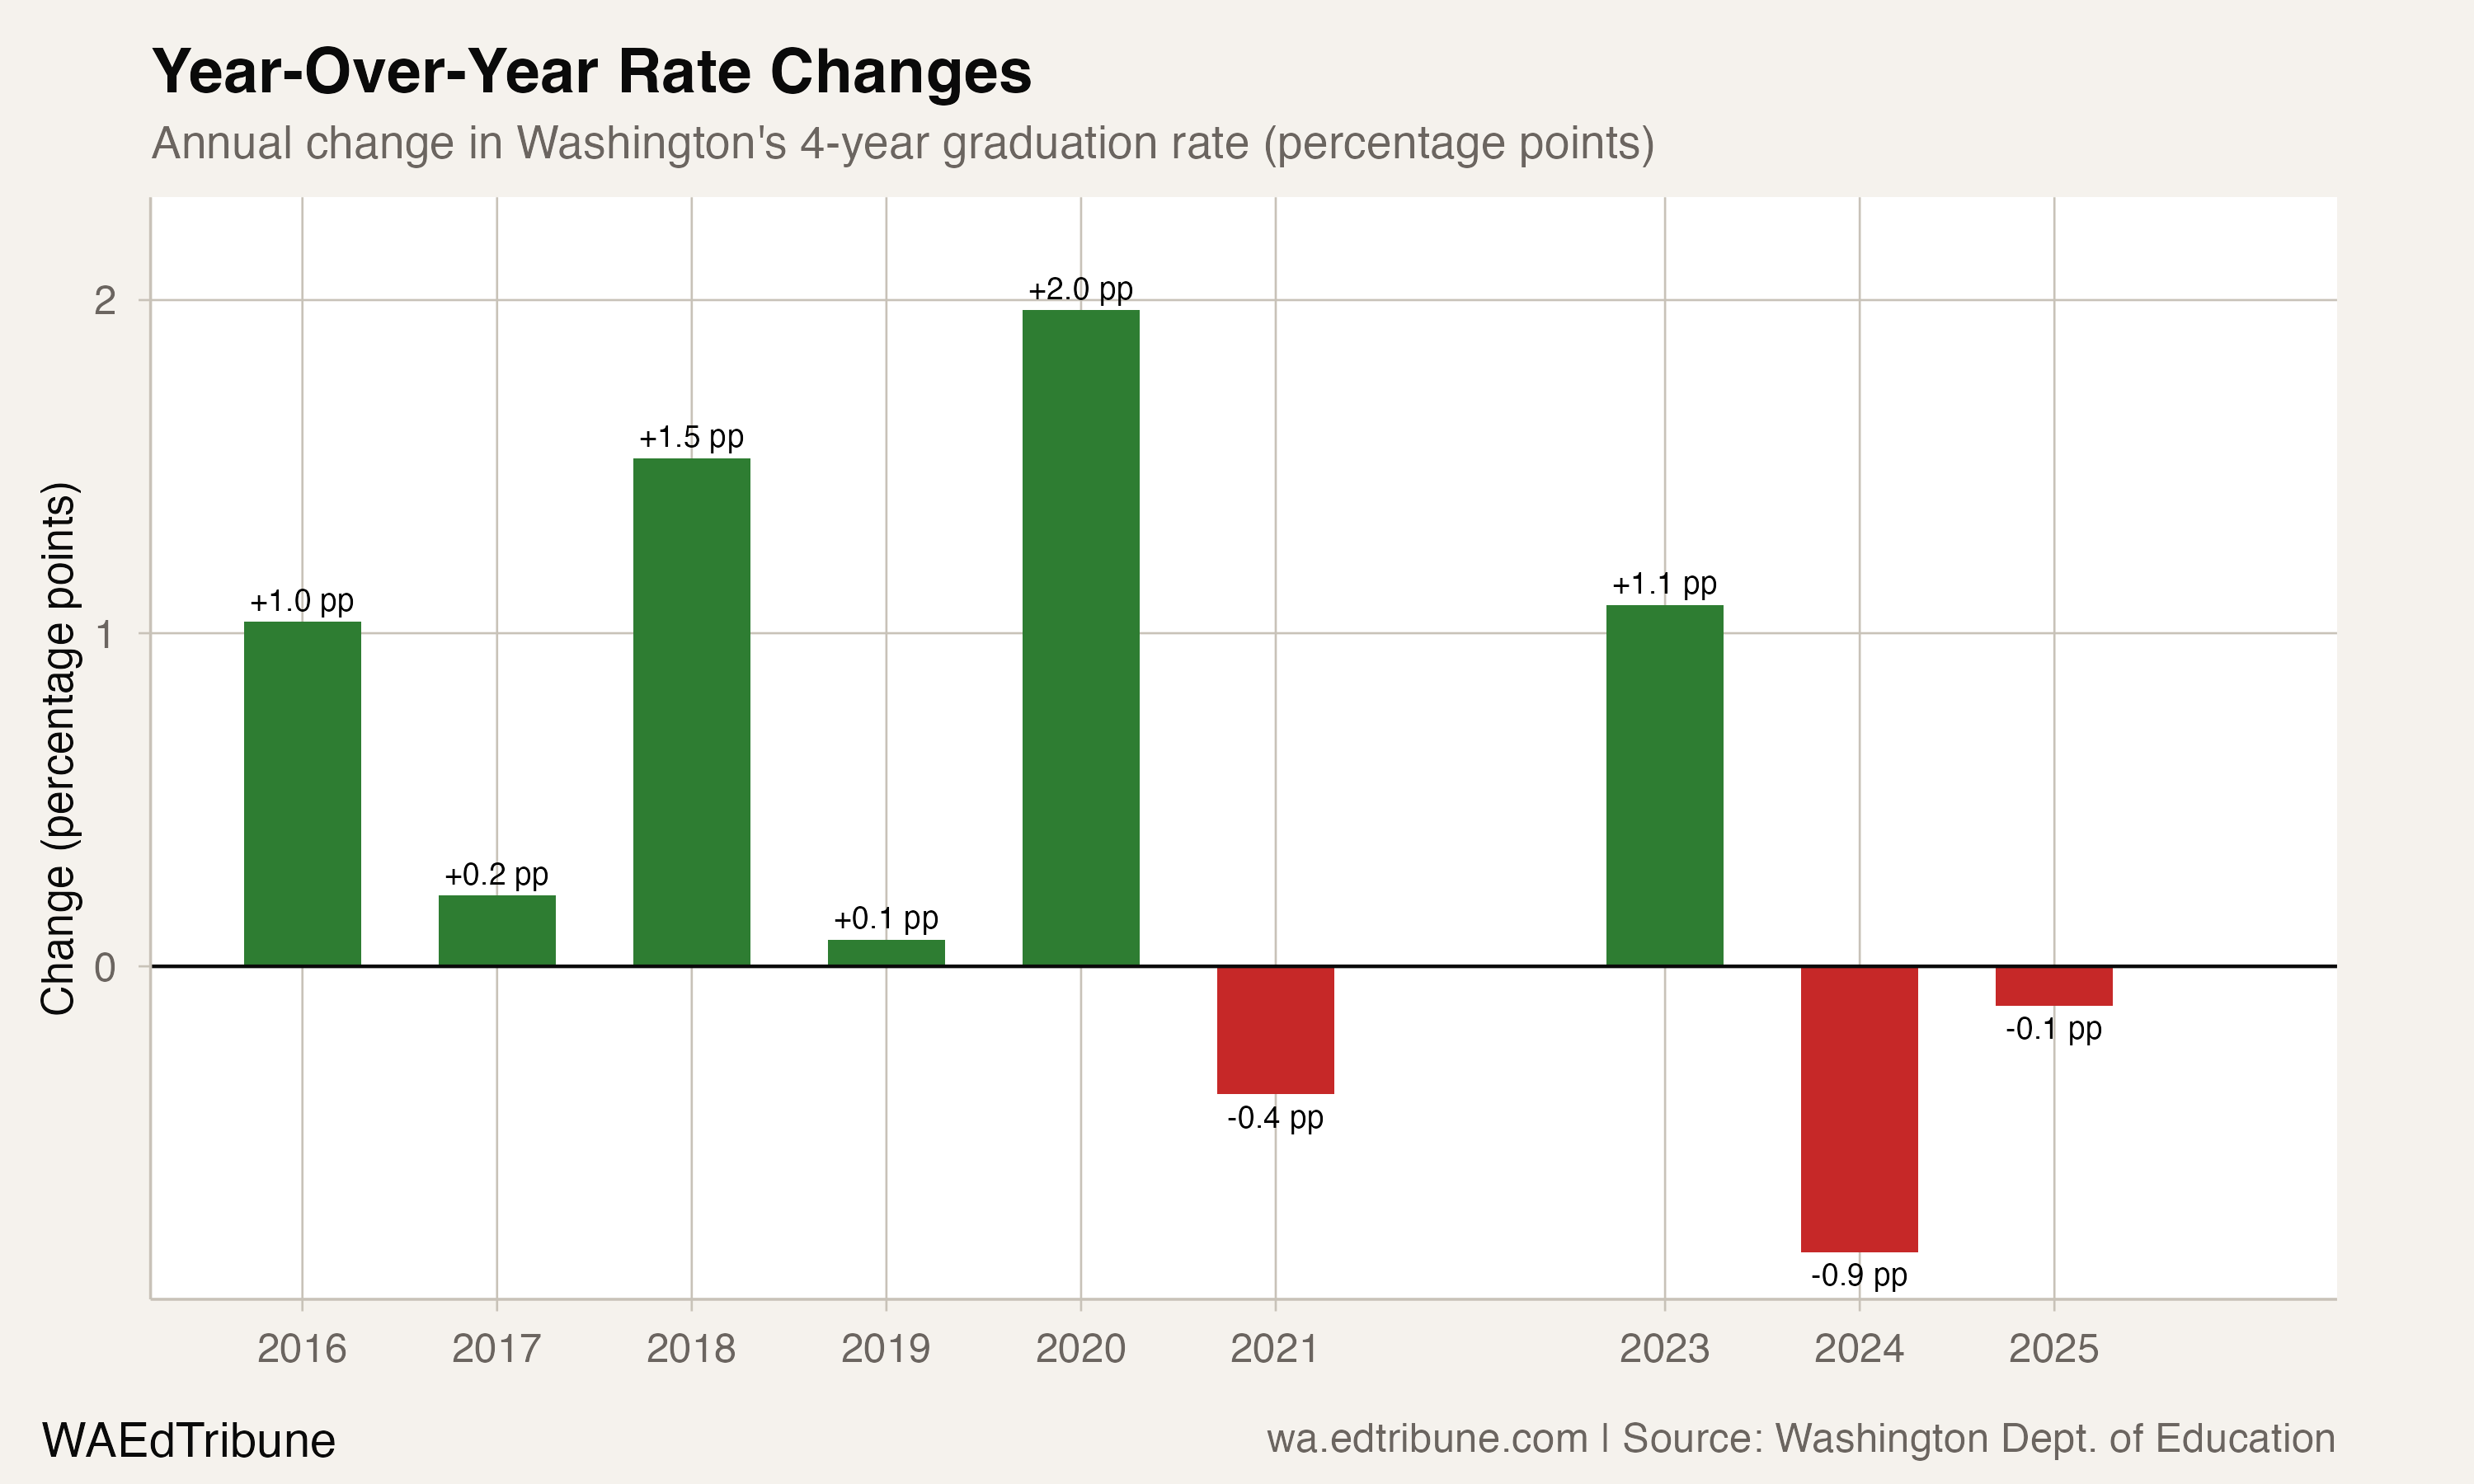
Washington's four-year graduation rate rose from 79.1% for the Class of 2016 to its peak of 83.6% for the Class of 2023, though the rate slipped in both 2021 and 2022 along the way. The steepest single-year gain came for the Class of 2020, which saw a 2.0 percentage point jump during the pandemic year.
Then the trajectory reversed. The Class of 2024 dropped 0.9 points to 82.8%. The Class of 2025 fell another 0.1 points to 82.6%. The rate now sits below where it was for the Class of 2020.
The national four-year adjusted cohort graduation rate was 87% in NCES's 2021-22 indicator. Washington's 82.6% sits more than four percentage points below that benchmark. The state's five-year rate for the Class of 2025 reached 85.1%, meaning roughly 2.5 additional percentage points of students finished within a fifth year. That still leaves the state below the national four-year mark.
The Cohort Problem
Between the Class of 2016 and the Class of 2025, Washington's four-year cohort grew by 9,274 students. That growth was not evenly distributed across years.
The minimum cohort from 2018 through 2021 was 83,799 students. The maximum was 84,828.
The cohort then reached 85,306 for the Class of 2023, 87,585 for 2024 and 90,315 for 2025. More than half the total nine-year increase landed in the final two cohorts.
This matters because holding the graduation rate steady requires converting an ever-larger share of an expanding cohort. To maintain the 83.6% peak rate with the Class of 2025's cohort, Washington would have needed to graduate roughly 75,500 students. It graduated 74,636, falling about 880 short of that threshold.
The number of students not graduating on time bottomed at 13,977 for the Class of 2023, then climbed by 1,702 over just two years. That reversal undid gains that had taken the state six years to achieve: the non-graduate count for the Class of 2025 (15,679) is comparable to where it stood for the Class of 2018 (16,082), before the pandemic-era improvements.
Where the Gaps Are Widest
The statewide rate obscures a chasm between student groups. Foster care youth graduate at 51.3%, a 31.4 percentage point gap below the state average. Students experiencing homelessness finish at 60.9%, a gap of 21.7 points. Students with disabilities graduate at 65.7%, 17.0 points below average. English learners finish at 67.5%, a 15.2-point gap.
These are not small populations. The homeless cohort alone included 9,699 students in the Class of 2025. Economically disadvantaged students, at 76.4%, numbered 51,065, more than half the total cohort. The overlap between these service-population categories is substantial (a student can be both economically disadvantaged and an English learner), but the scale makes clear that the graduation-rate ceiling is not an abstract statewide problem. It is concentrated in identifiable groups receiving identifiable services.
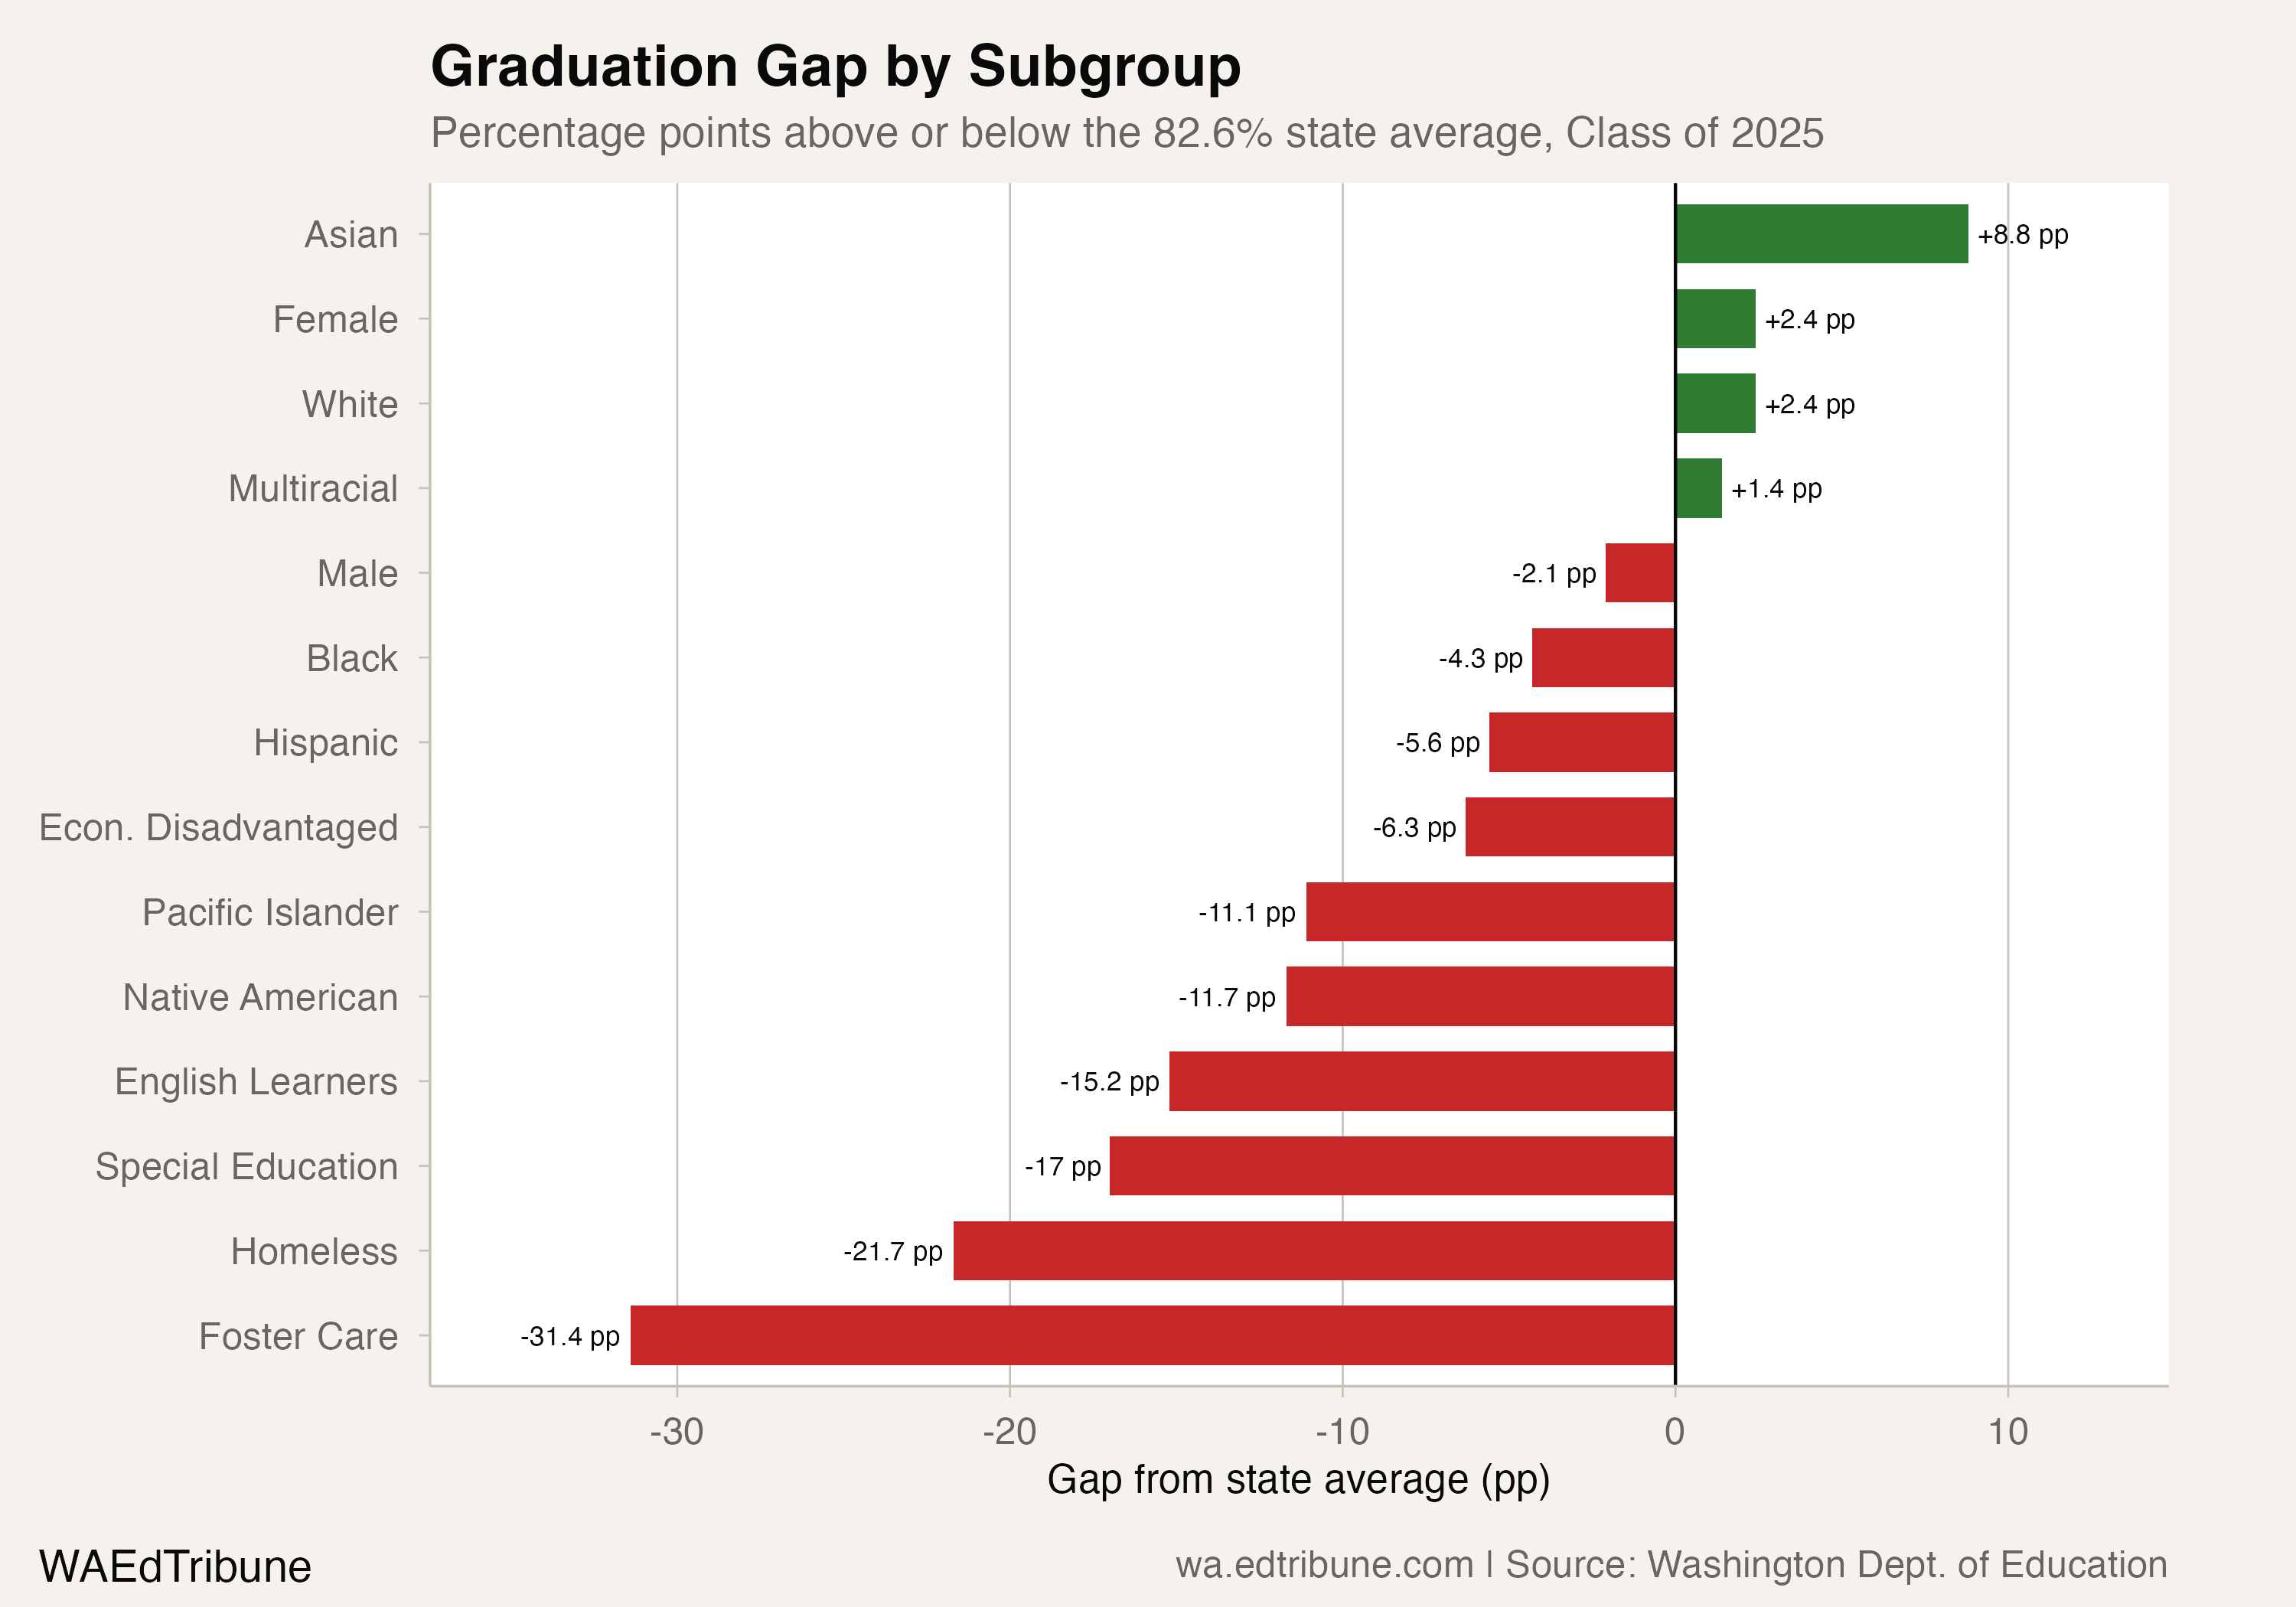
Racial gaps are narrower but persistent. Hispanic students graduate at 77.0%, 5.6 points below average. Black students finish at 78.3%, 4.3 points below. Native American students, at 70.9%, face an 11.7-point deficit despite representing a smaller cohort of 1,107. White students (85.0%), multiracial students (84.0%) and Asian students (91.5%) are the racial groups above the state average.
The post-peak reversal appears in multiple groups, not just the statewide total.
Black students climbed from 70.7% in 2016 to 81.3% in 2023, then dropped to 78.3% in 2025.
English learners went from 57.6% in 2016 to 70.7% in 2023, then fell to 67.5% in 2025.
Chronic Absence as a Leading Indicator
Direct evidence from OSPI shows Washington's chronic absenteeism baseline barely moved: the state started at 27.3% in 2023-24 and reached 27.1% in 2024-25. KUOW reported that Washington had the ninth-highest chronic absenteeism rate nationally in a 2022-23 analysis. That is suggestive context, not proof of causation, but students who entered high school during the worst pandemic-era attendance disruptions are now the seniors showing up in the graduation data.
"Research has consistently shown such a clear connection between days missed and likelihood of graduating high school." -- Elizabeth Maine, principal at Seahurst Elementary, via KUOW
Direct evidence from OSPI's plan shows a five-year challenge to halve chronic absenteeism by 2029, with annual targets stepping down from 25.0% in 2024-25 to 13.7% in 2028-29. A bipartisan bill, SB 5007, remained in Senate Ways & Means as of July 6, 2026; Cascade PBS reported that the proposal carried a $20.4 million per biennium fiscal estimate for early intervention programs targeting chronically absent high schoolers.
Whether those efforts can translate into higher graduation rates depends on timing. The first cohort able to spend all four high school years under the 2024-25-to-2028-29 attendance targets has not graduated yet.
A Budget That Cuts in the Wrong Direction
The fiscal backdrop complicates any graduation-rate strategy. A League of Education Voters summary of the final 2026 supplemental budget found $32 million less for Transition to Kindergarten, $25 million less for Local Effort Assistance and $7 million less for Running Start.
"The barriers our students face are not rooted in ability or motivation -- they're rooted in inequity. When student supports are reduced, attendance declines, needs go unmet, and disparities widen." -- Communities In Schools of Washington
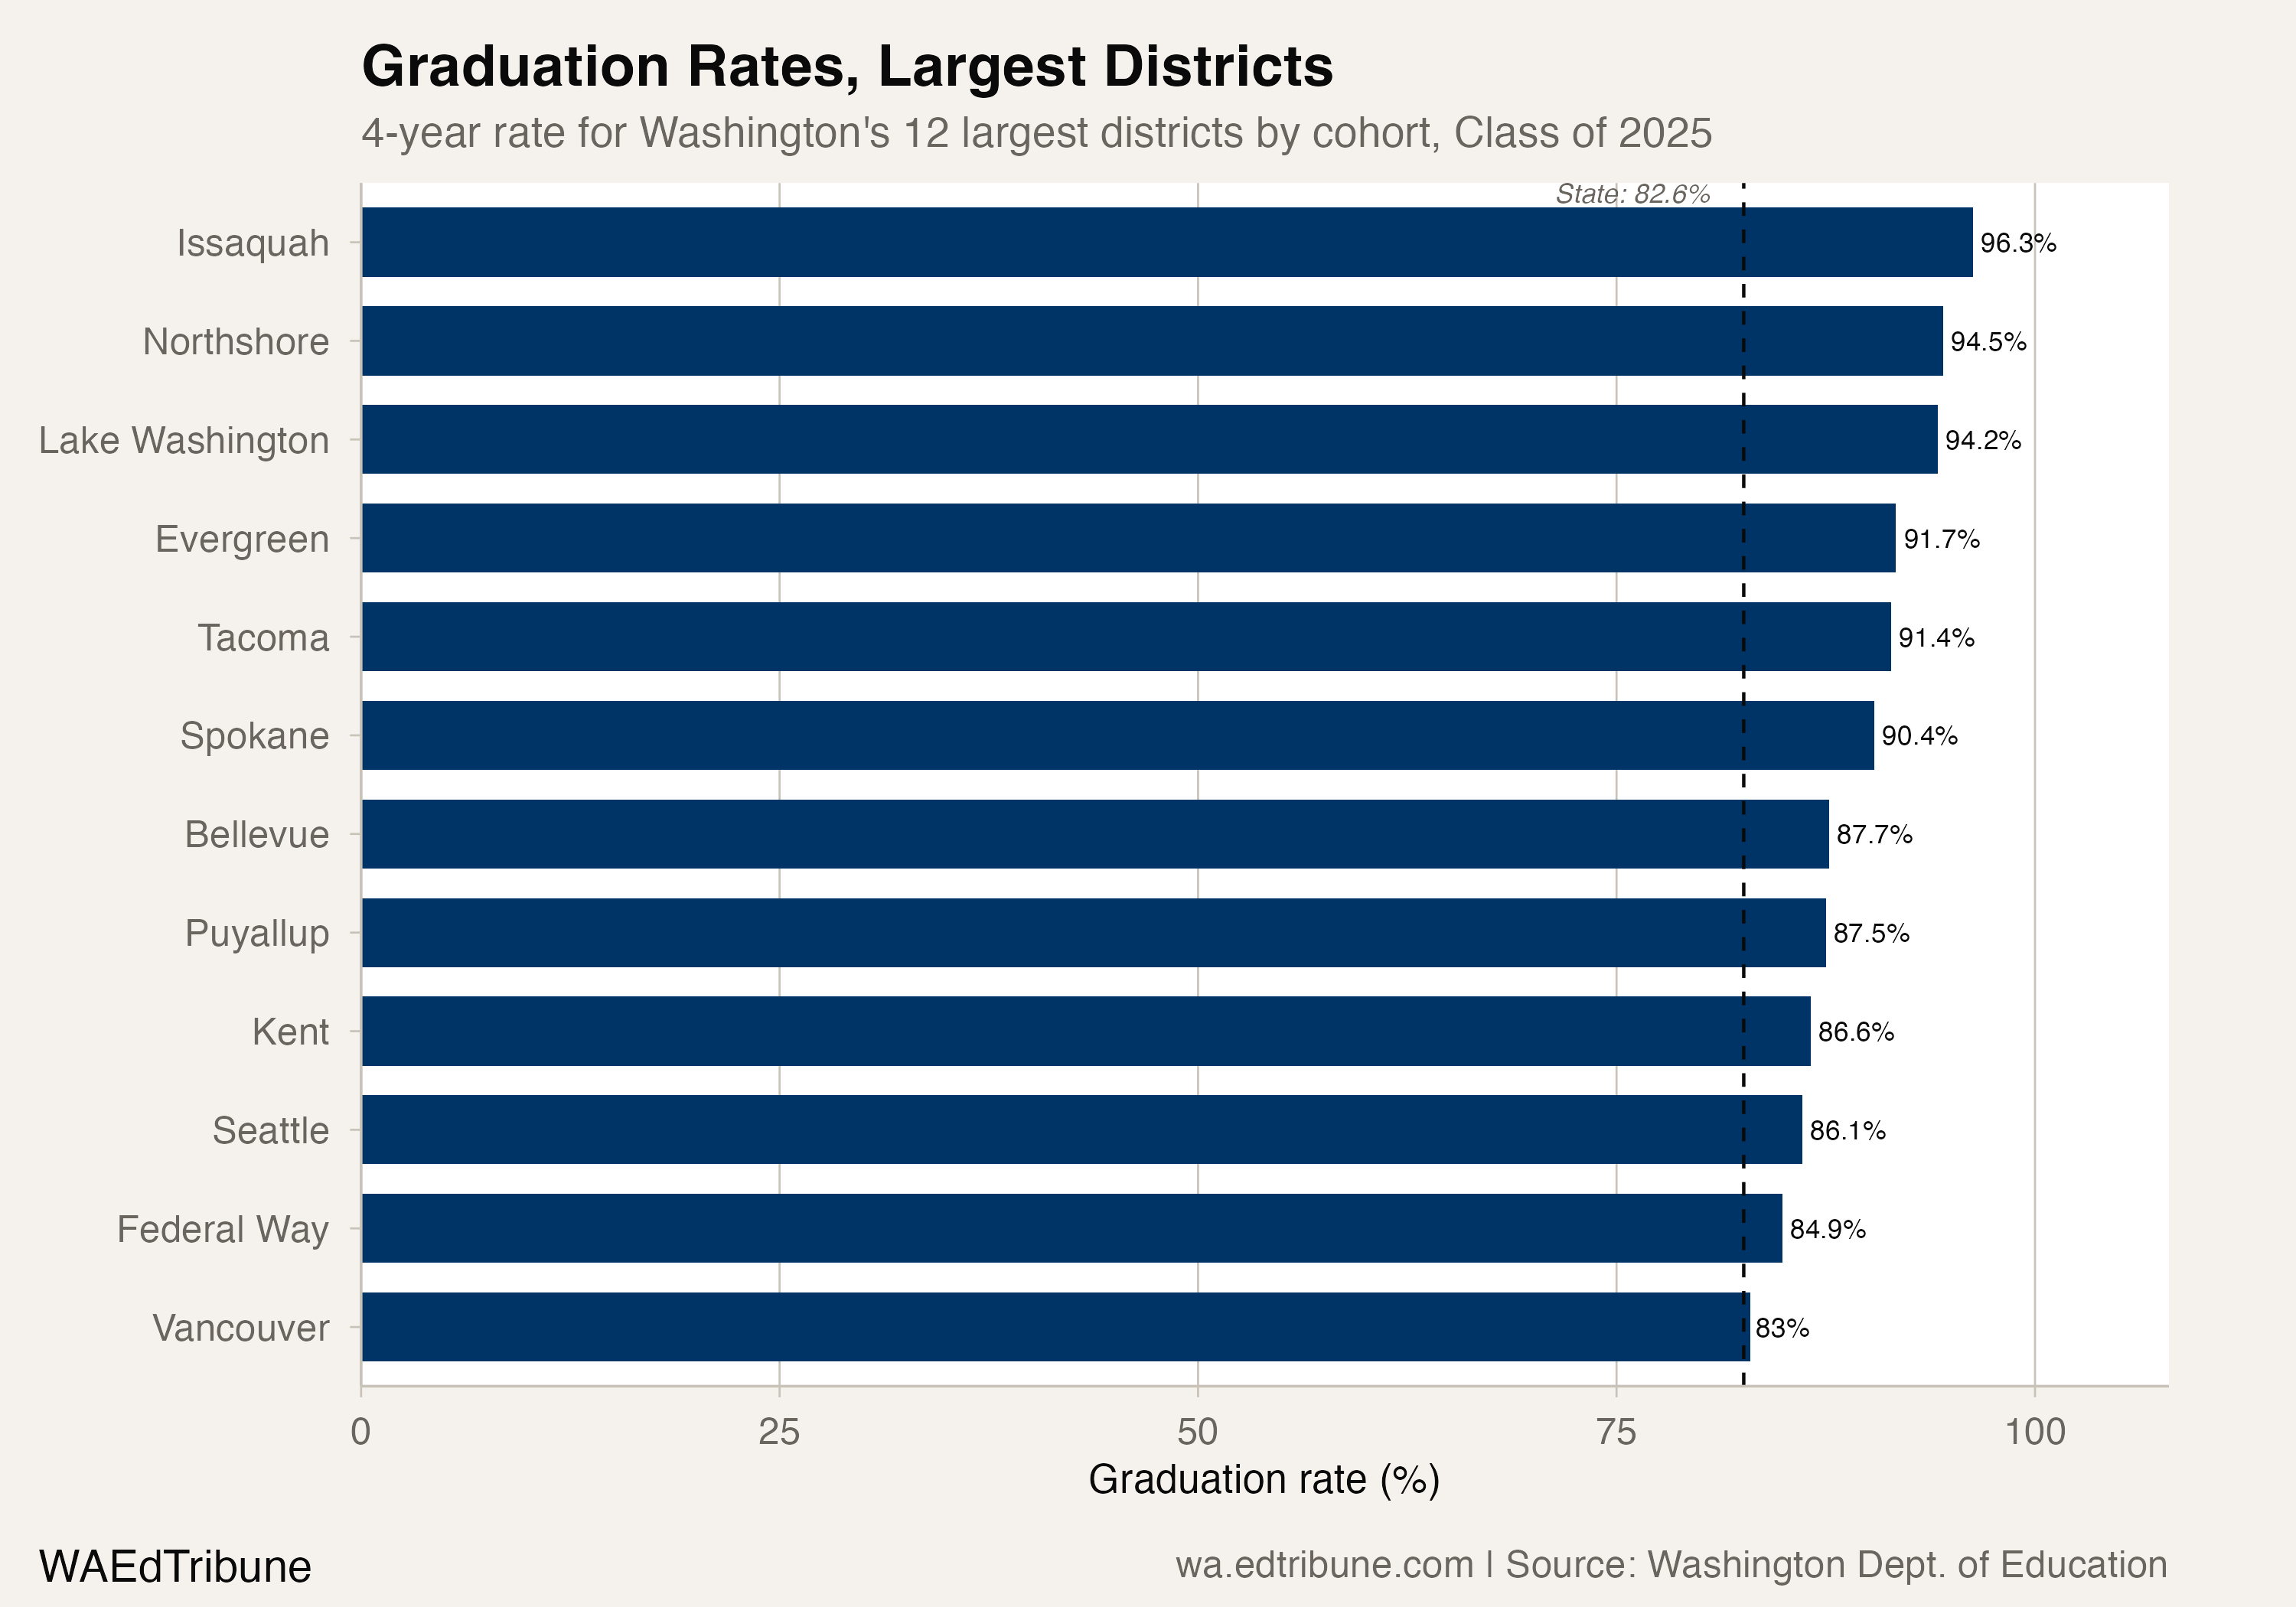
The reductions are not targeted by graduation rate, but they land in the same system that has to move larger cohorts to completion. Among the 12 largest districts by cohort size, Vancouver↗ET (83.0%), Federal Way↗ET (84.9%), and Seattle↗ET (86.1%) all sit below 87%. In absolute terms, Seattle's cohort of 4,279 produces the most non-graduates of any district: 593 students who did not finish within four years.
The Structural Bind
Washington's graduation-rate plateau is not a failure of momentum. The state graduated 10,510 more students in the Class of 2025 than in the Class of 2016. The five-year rate, at 85.1%, suggests that many students who miss the four-year mark are completing within an additional year. The pipeline is not broken. It is slower than the cohort flowing through it.
The cohort surge may not be temporary. Washington's population grew by an estimated 79,400 in 2025, with net migration accounting for roughly 78% of that increase. That migration evidence is suggestive context, not direct evidence for high school cohorts: the public population release does not say how many in-movers are high-school-age children.
OSPI's chronic absenteeism challenge targets one lever: getting students in the building. Future graduation-rate releases will show whether outcomes changed after the 2024-25 attendance baseline.
Detailed code that reproduces the analysis and figures in this article is available exclusively to EdTribune subscribers.
Discussion
Sign in to join the discussion.
Loading comments...