Correction (October 11, 2026): An earlier version of this article said the state published no graduation rate for 2022. It did. Bellevue's rate was 93.6% for the Class of 2022, so its decline from the 2020-21 peak came in four annual steps (0.9, 0.6, 0.5 and 4.8 points), not a 1.6-point drop across a two-year gap followed by two more. The article's other figures did not change.
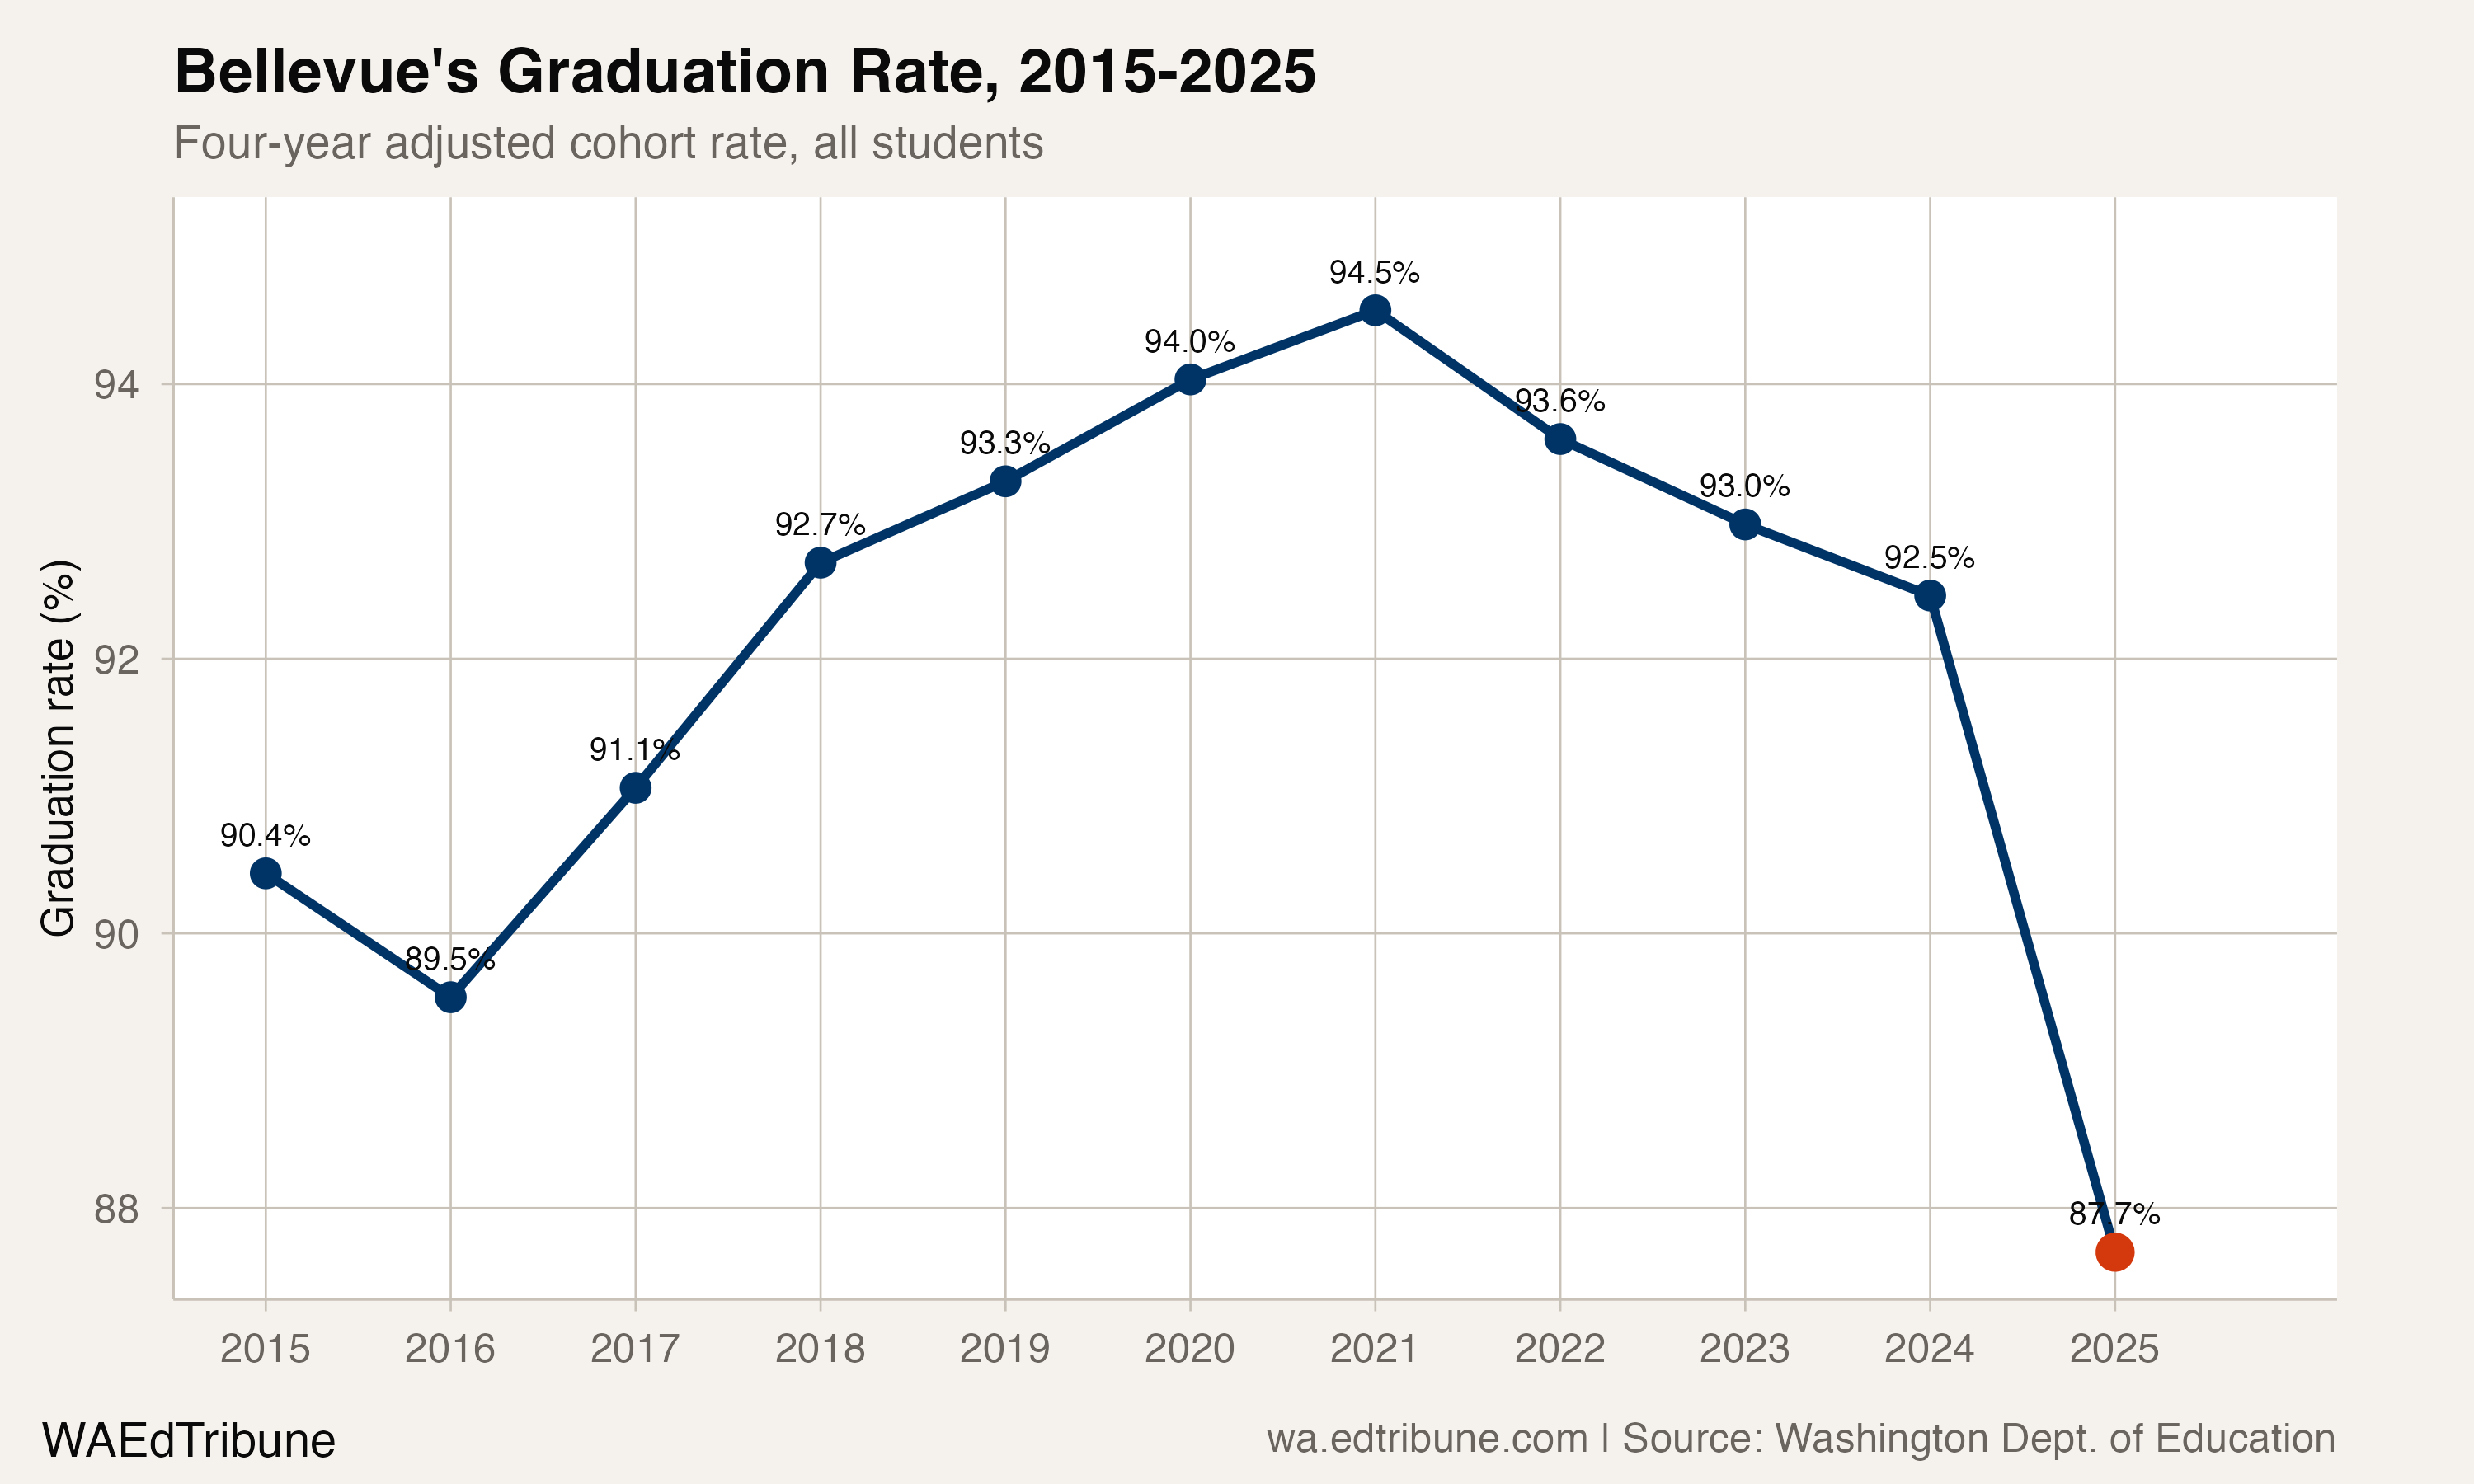
Bellevue School District↗ET's four-year graduation rate was 87.7% for the Class of 2025, the most recent published cohort in the state package. That was the lowest rate in the available Bellevue series, which begins with the Class of 2015, and 6.9 percentage points below the 94.5% peak in 2020-21.
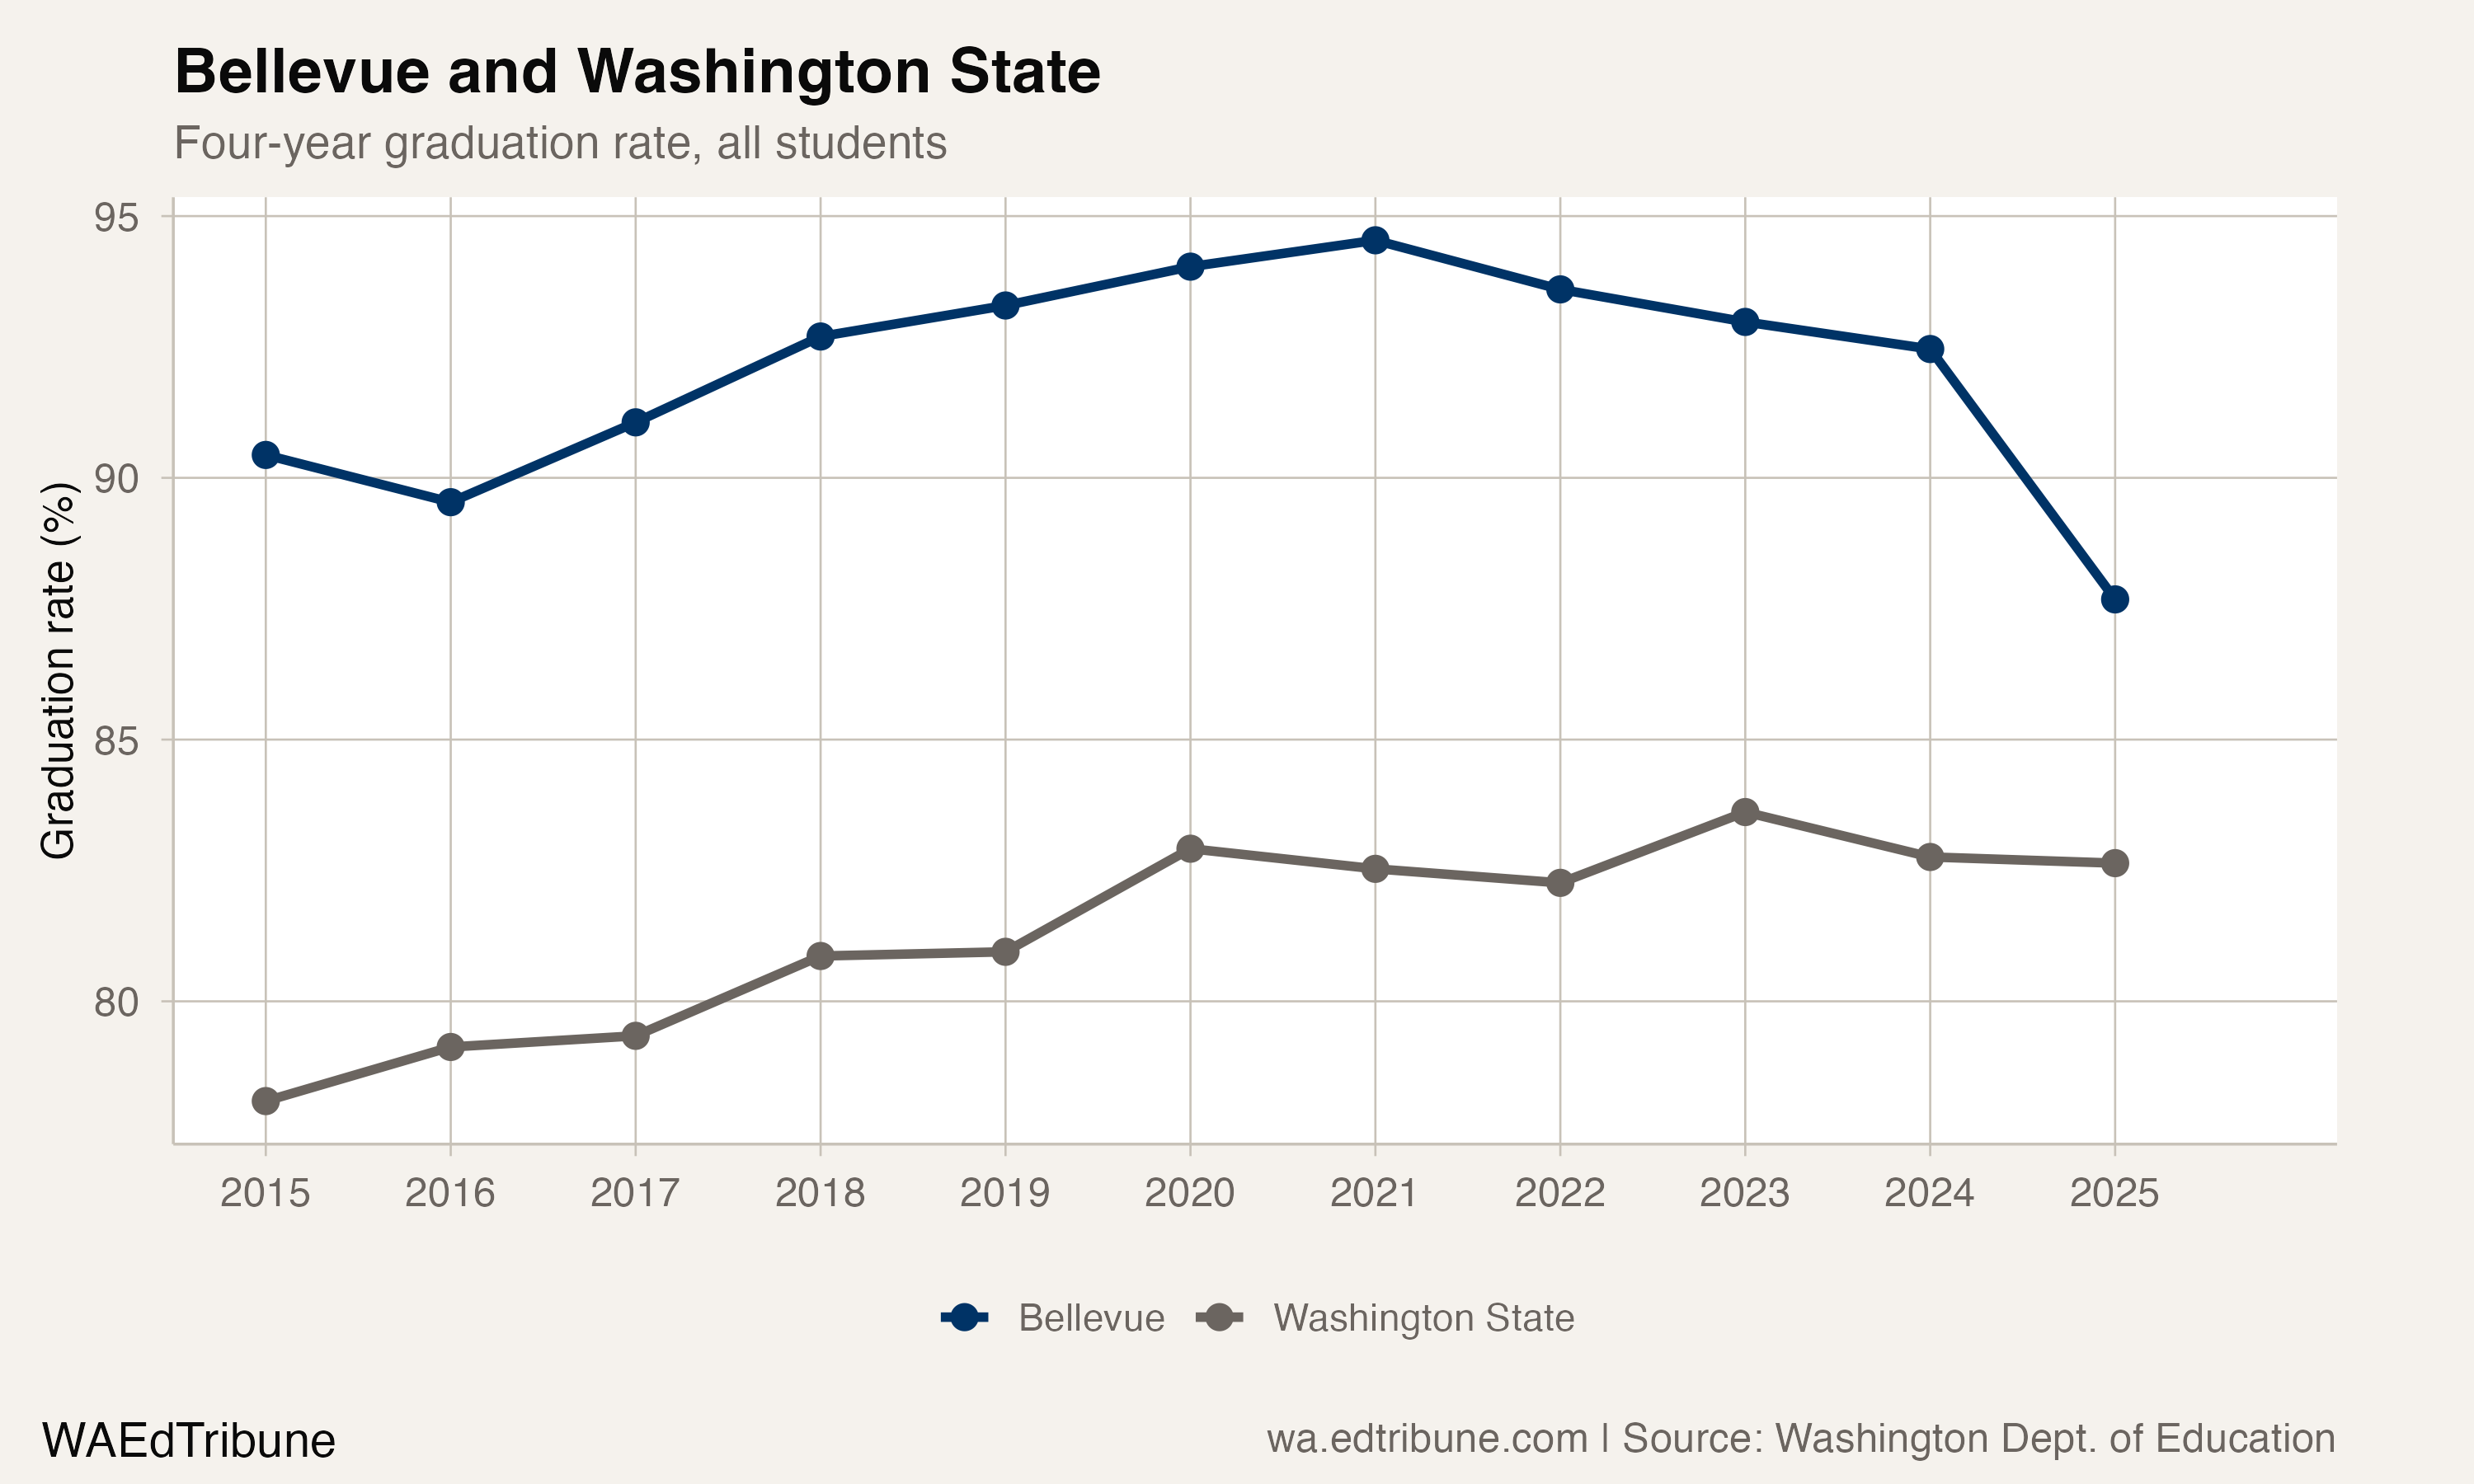
Washington's statewide rate was 82.6% for the Class of 2025, leaving Bellevue 5.0 points above the state average. Bellevue's overall result therefore remained higher than the state rate even as its long-standing margin narrowed.
A decline in four steps
Bellevue's rate fell in each of the four years after the 2020-21 peak: 0.9 points to 93.6% in 2021-22, 0.6 points to 93.0% in 2022-23, 0.5 points in 2023-24 and 4.8 points in 2024-25.
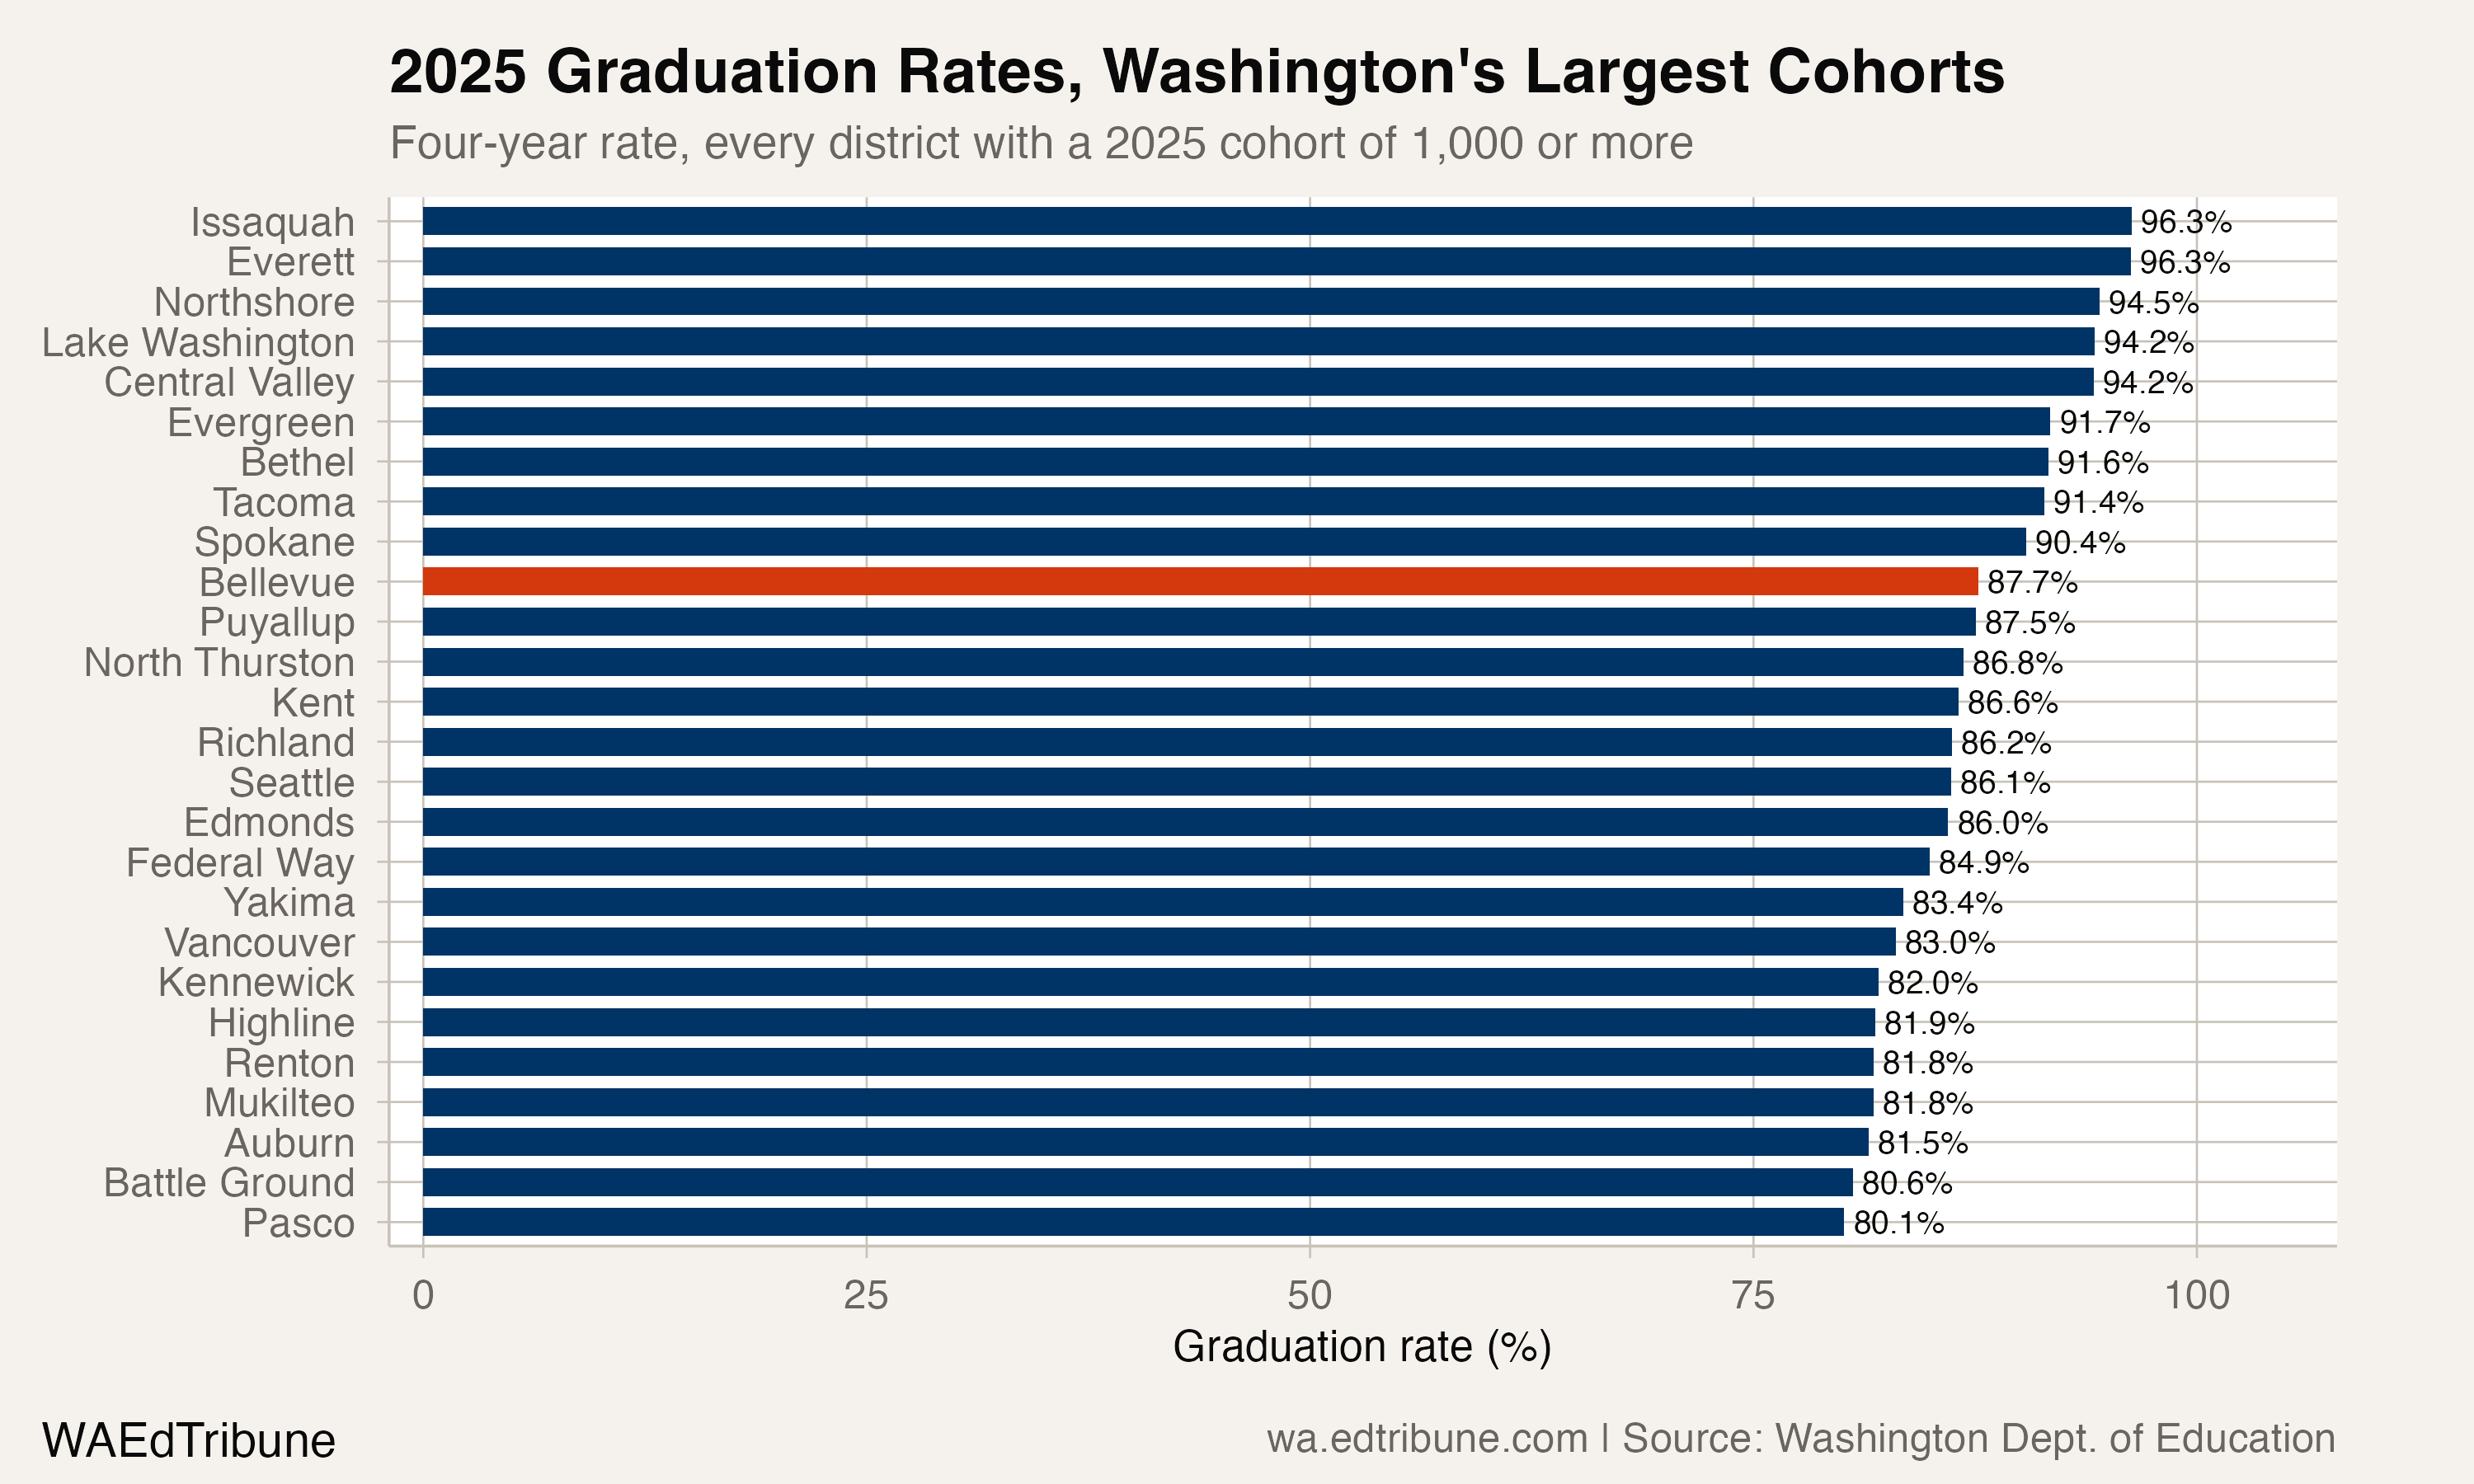
Among the 26 Washington districts with a 2025 cohort of at least 1,000 students, Bellevue ranked 10th by four-year graduation rate. That comparison describes position in the published large-cohort universe; it does not explain the district's decline.
The decline was uneven across groups
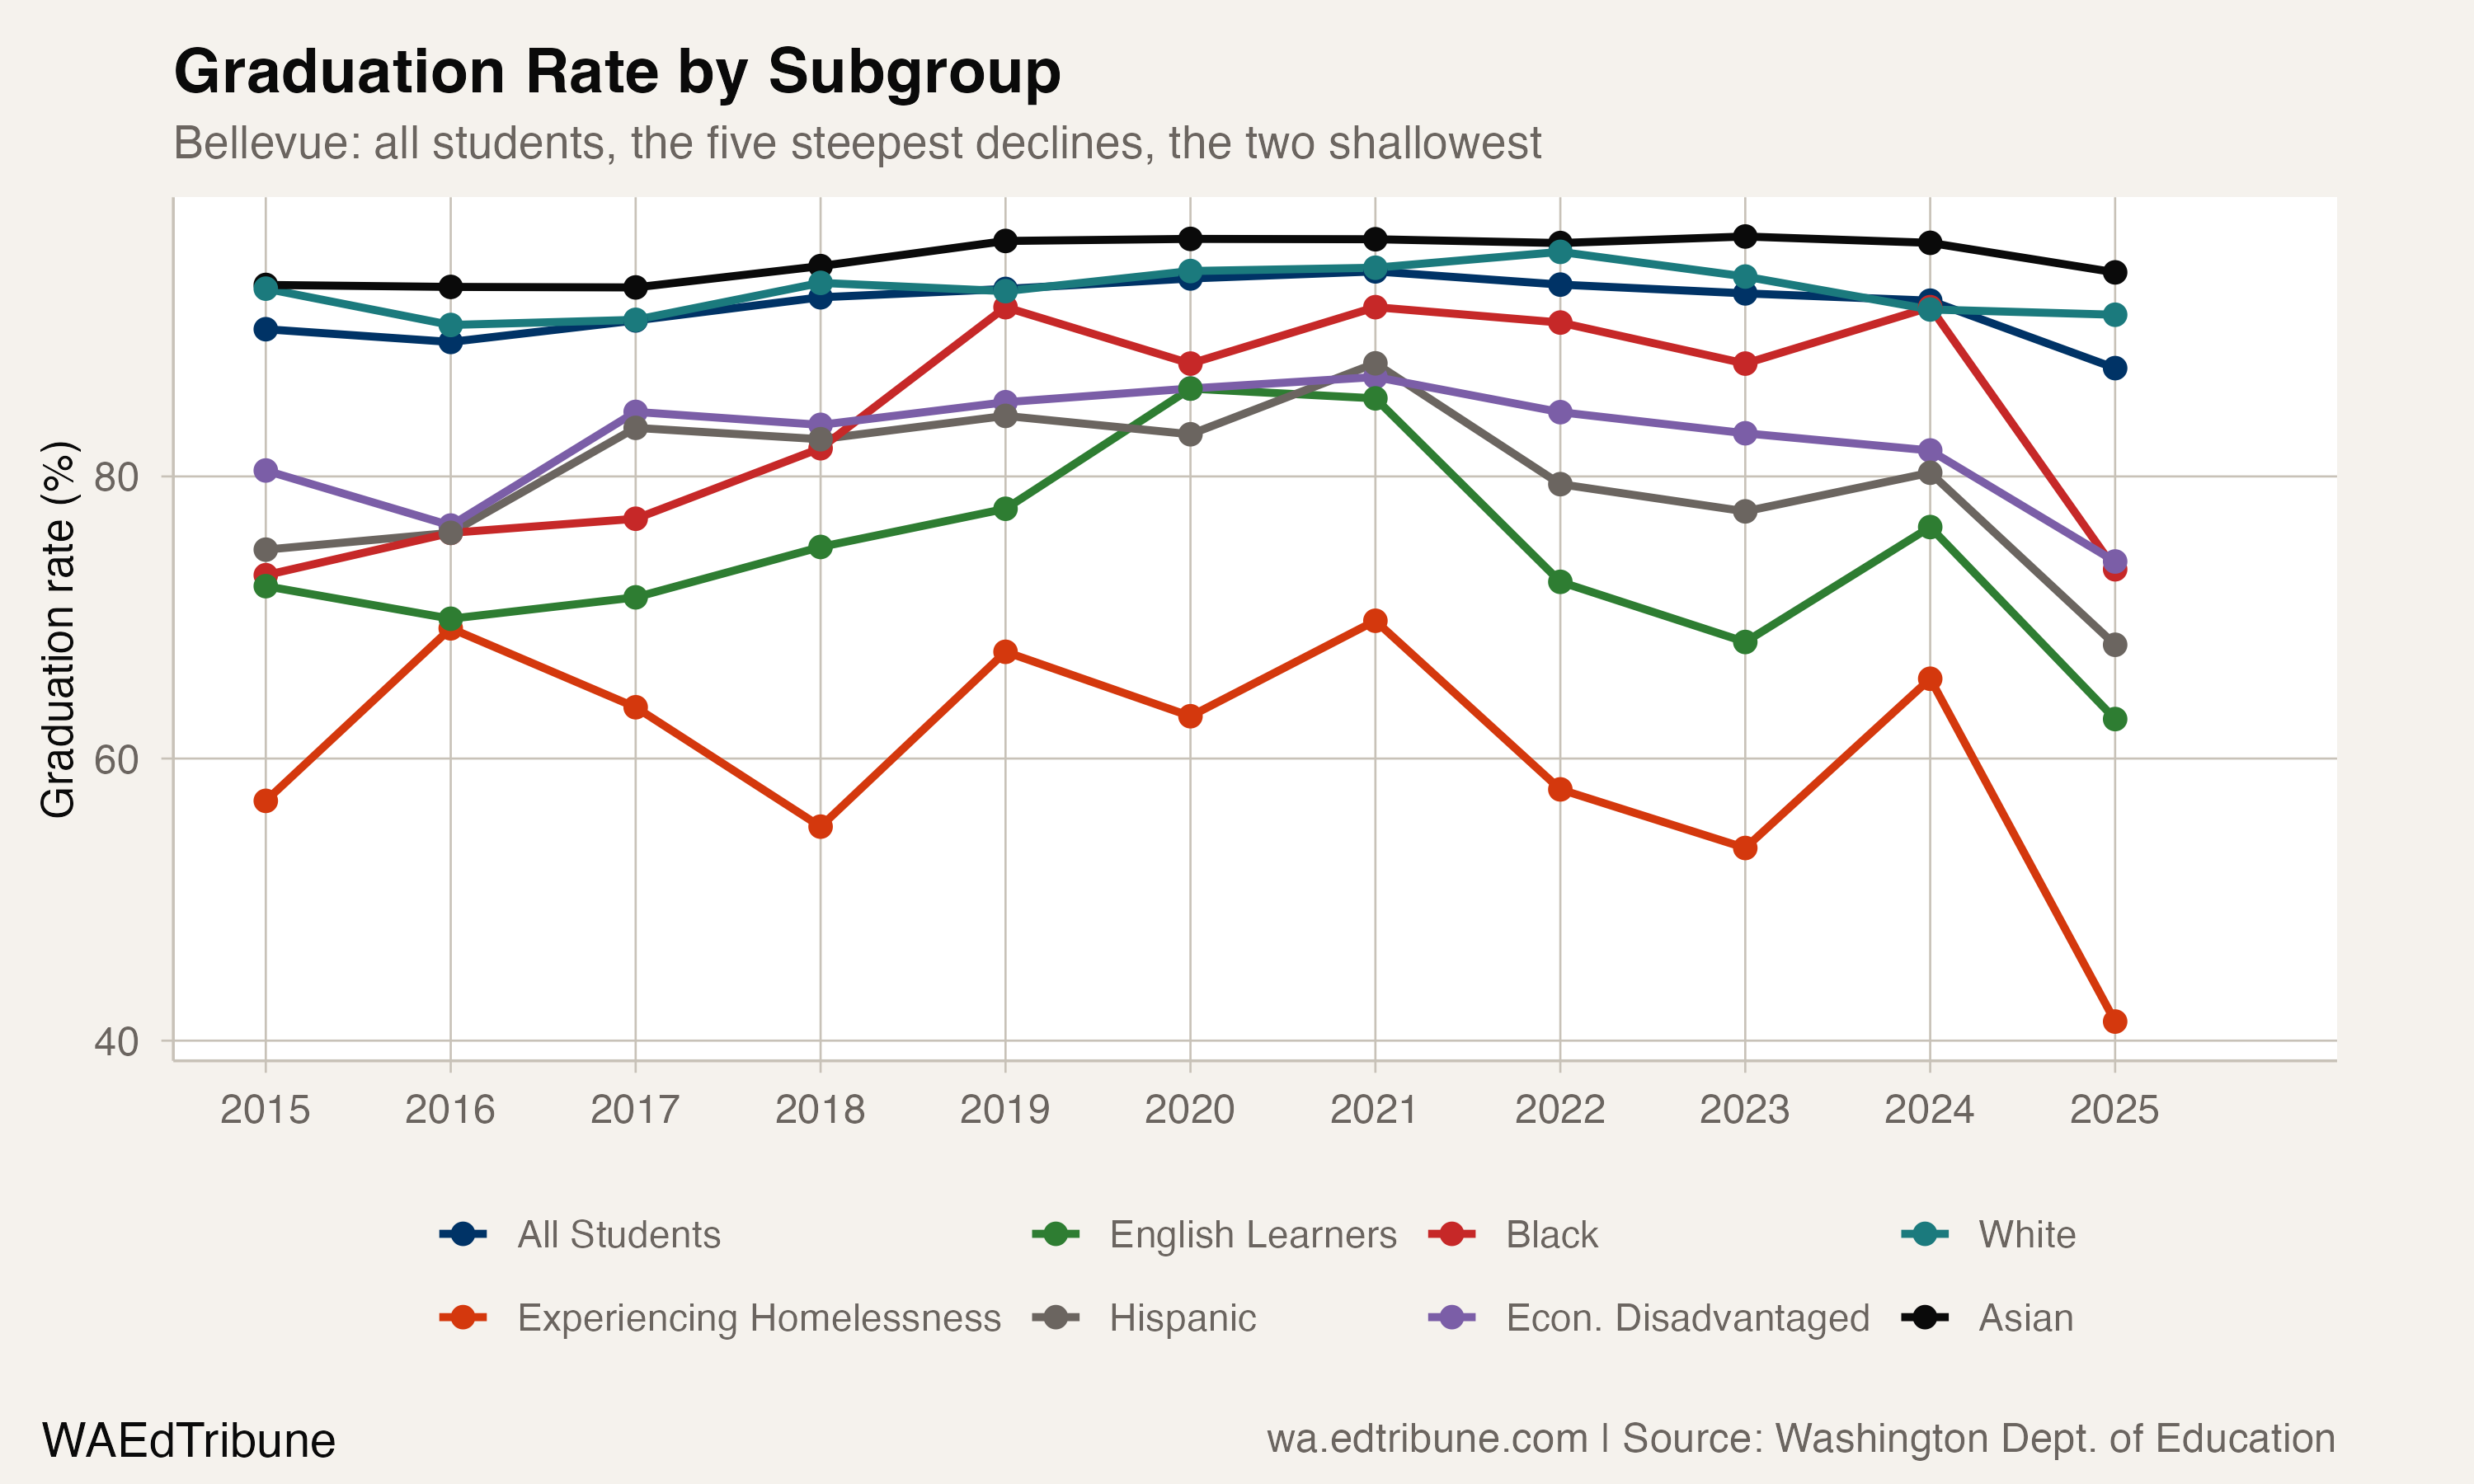
Students experiencing homelessness had the steepest decline among Bellevue subgroups with published rates in both 2020-21 and 2024-25: from 69.8% to 41.4%, a 28.4-point drop. Their 2024-25 cohort contained 133 students.
English learners fell from 85.5% to 62.8%, a 22.7-point decline. Hispanic students fell from 88.0% to 68.1%, a 20.0-point decline. Black students fell from 92.0% to 73.4%, an 18.6-point decline.
The decline was smaller for economically disadvantaged students, from 87.0% to 74.0%, or 13.1 points. White students fell 3.3 points, from 94.8% to 91.5%, while Asian students fell 2.3 points, from 96.8% to 94.5%.
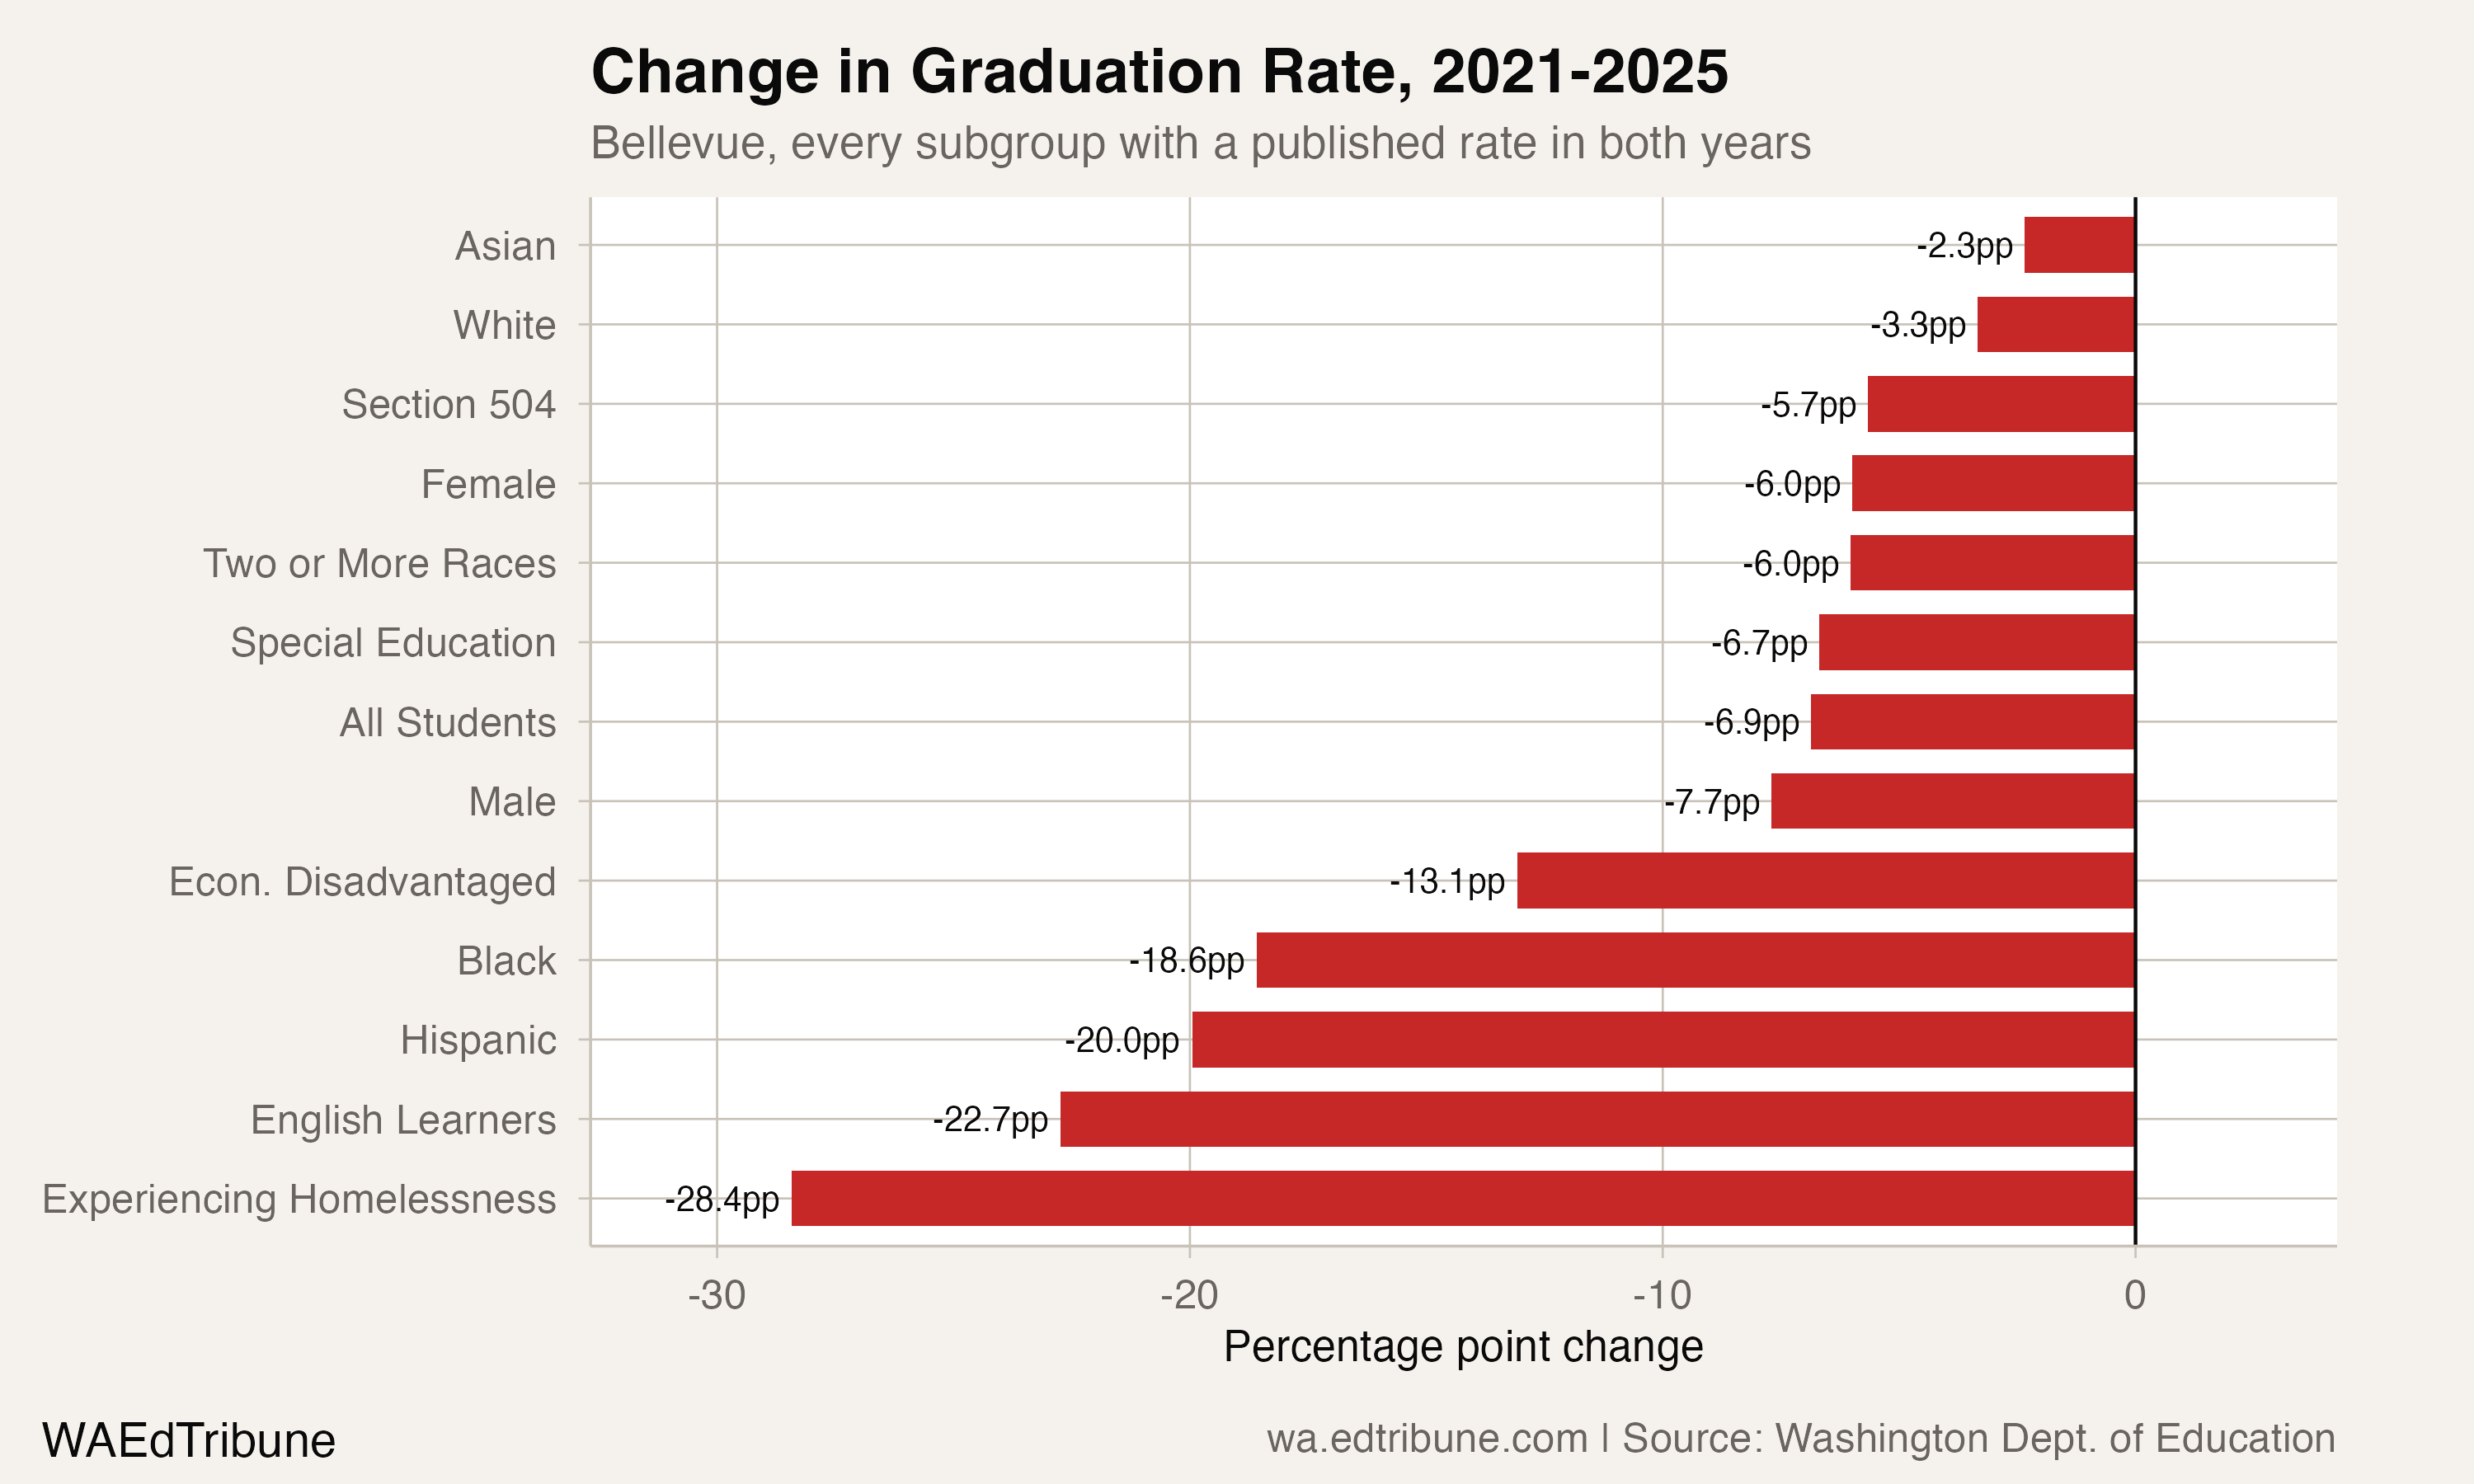
The subgroup results are descriptive. They show where the published rates moved most, but the graduation file does not identify why a group changed or whether the same students remained in the district across cohorts.
Cohort size is part of the context
Bellevue's 2024-25 cohort contained 1,826 students. The size of the cohort and the size of its subgroups matter when interpreting a percentage: a smaller group can move more sharply when a few outcomes change. The 2024-25 Black cohort contained 79 students, while the Hispanic and English learner cohorts contained 310 and 293 students, respectively.
The rate file cannot establish whether enrollment changes, transfers, program participation, attendance, staffing, or other factors produced the subgroup differences. Those are questions for district records beyond the published graduation panel.
What the rate can say
The 2024-25 four-year rate captures students who graduated on time; it does not measure students who finished later. Bellevue's five-year rate for the Class of 2024 was 94.7%, but five-year and four-year rates describe different reporting windows. The package's diagonal comparison shows that the additional year added between 1.0 and 4.4 points across the 10 classes with both published figures.
Bellevue still exceeded Washington's statewide rate in 2024-25, but by 5.0 points rather than the 12.0-point margin recorded in 2020-21. The next published cohort will show whether the 2024-25 result was a new level or a one-year movement; the current package does not answer that question.
Graduation rates and cohort counts come from the Washington Office of Superintendent of Public Instruction's Report Card. The article does not infer a cause for the decline.
Detailed code that reproduces the analysis and figures in this article is available exclusively to EdTribune subscribers.
Discussion
Sign in to join the discussion.
Loading comments...