In Auburn School District↗ET, south of Seattle, the four-year graduation rate for Native American students is 41.7%. In Toppenish School District↗ET, on the Yakama Reservation in the Yakima Valley, it is 77.8%. In between those two numbers sits every tension in Washington's effort to close its oldest educational equity gap.
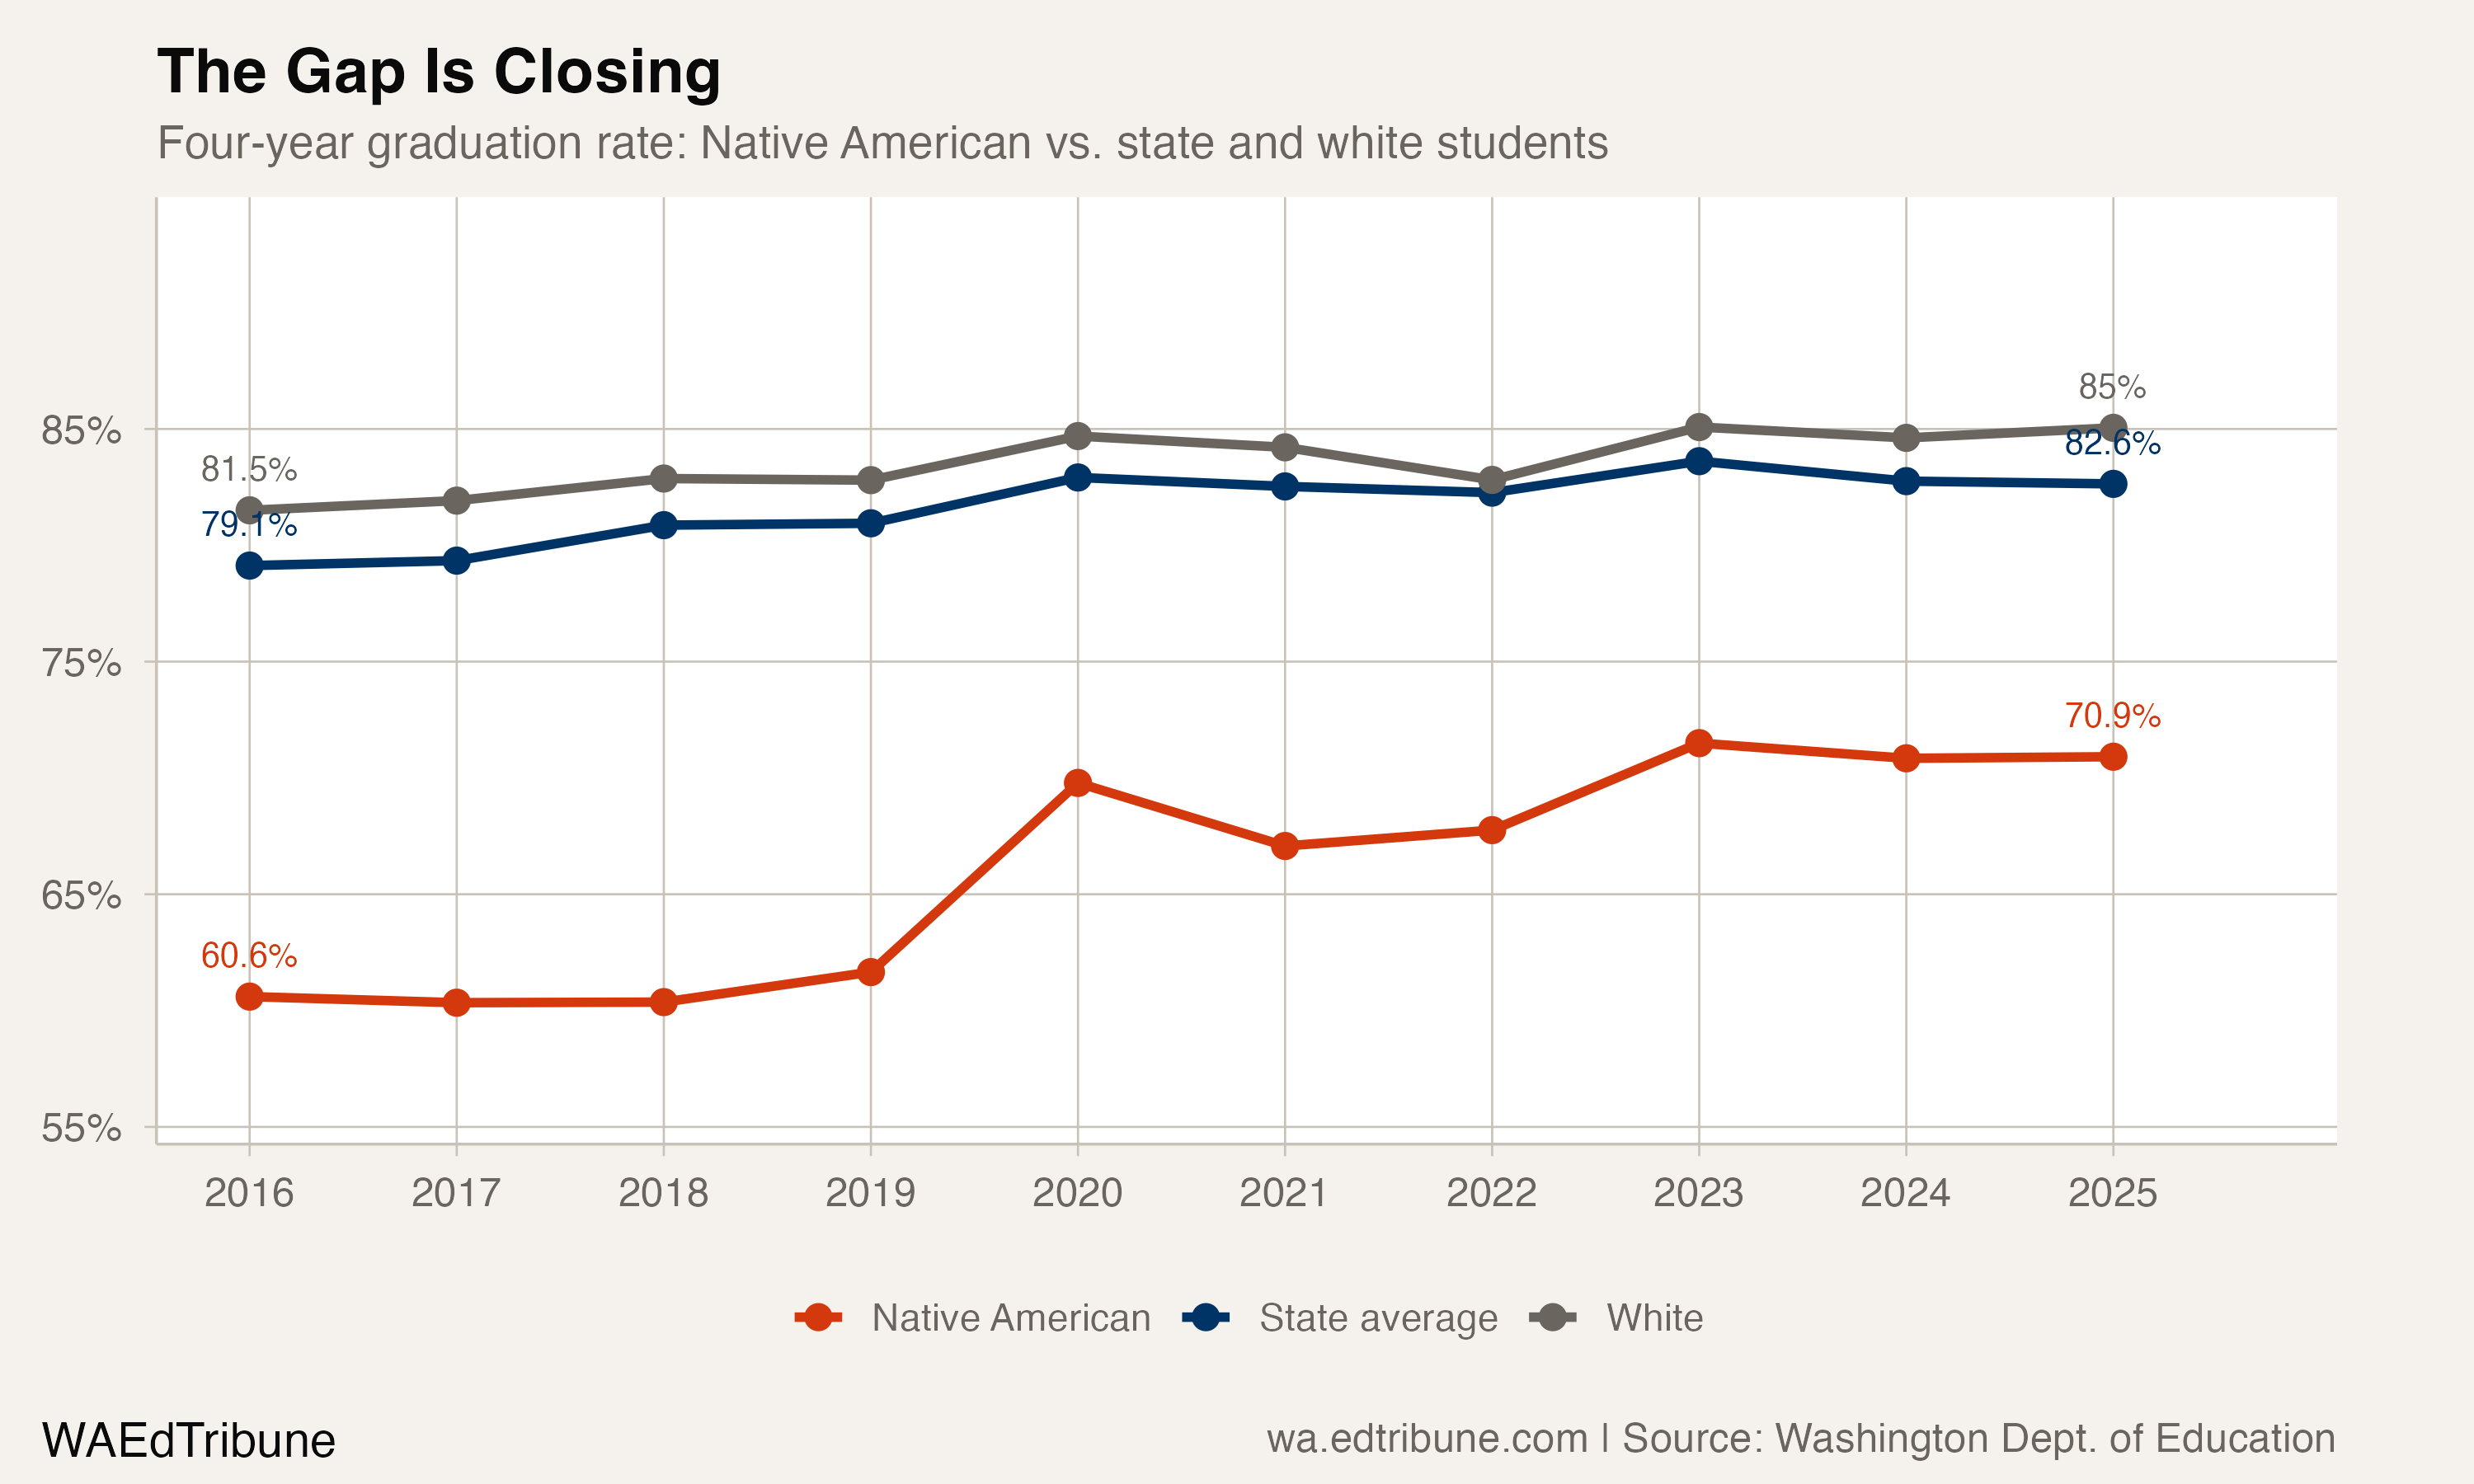
Statewide, Native American students have made more progress toward graduating on time than any other racial or ethnic group. Their four-year completion rate rose from 60.6% in 2015-16 to 70.9% in 2024-25, a gain of 10.3 percentage points. The gap to the state average narrowed from 18.5 points to 11.7. No other racial or ethnic group closed as much ground.
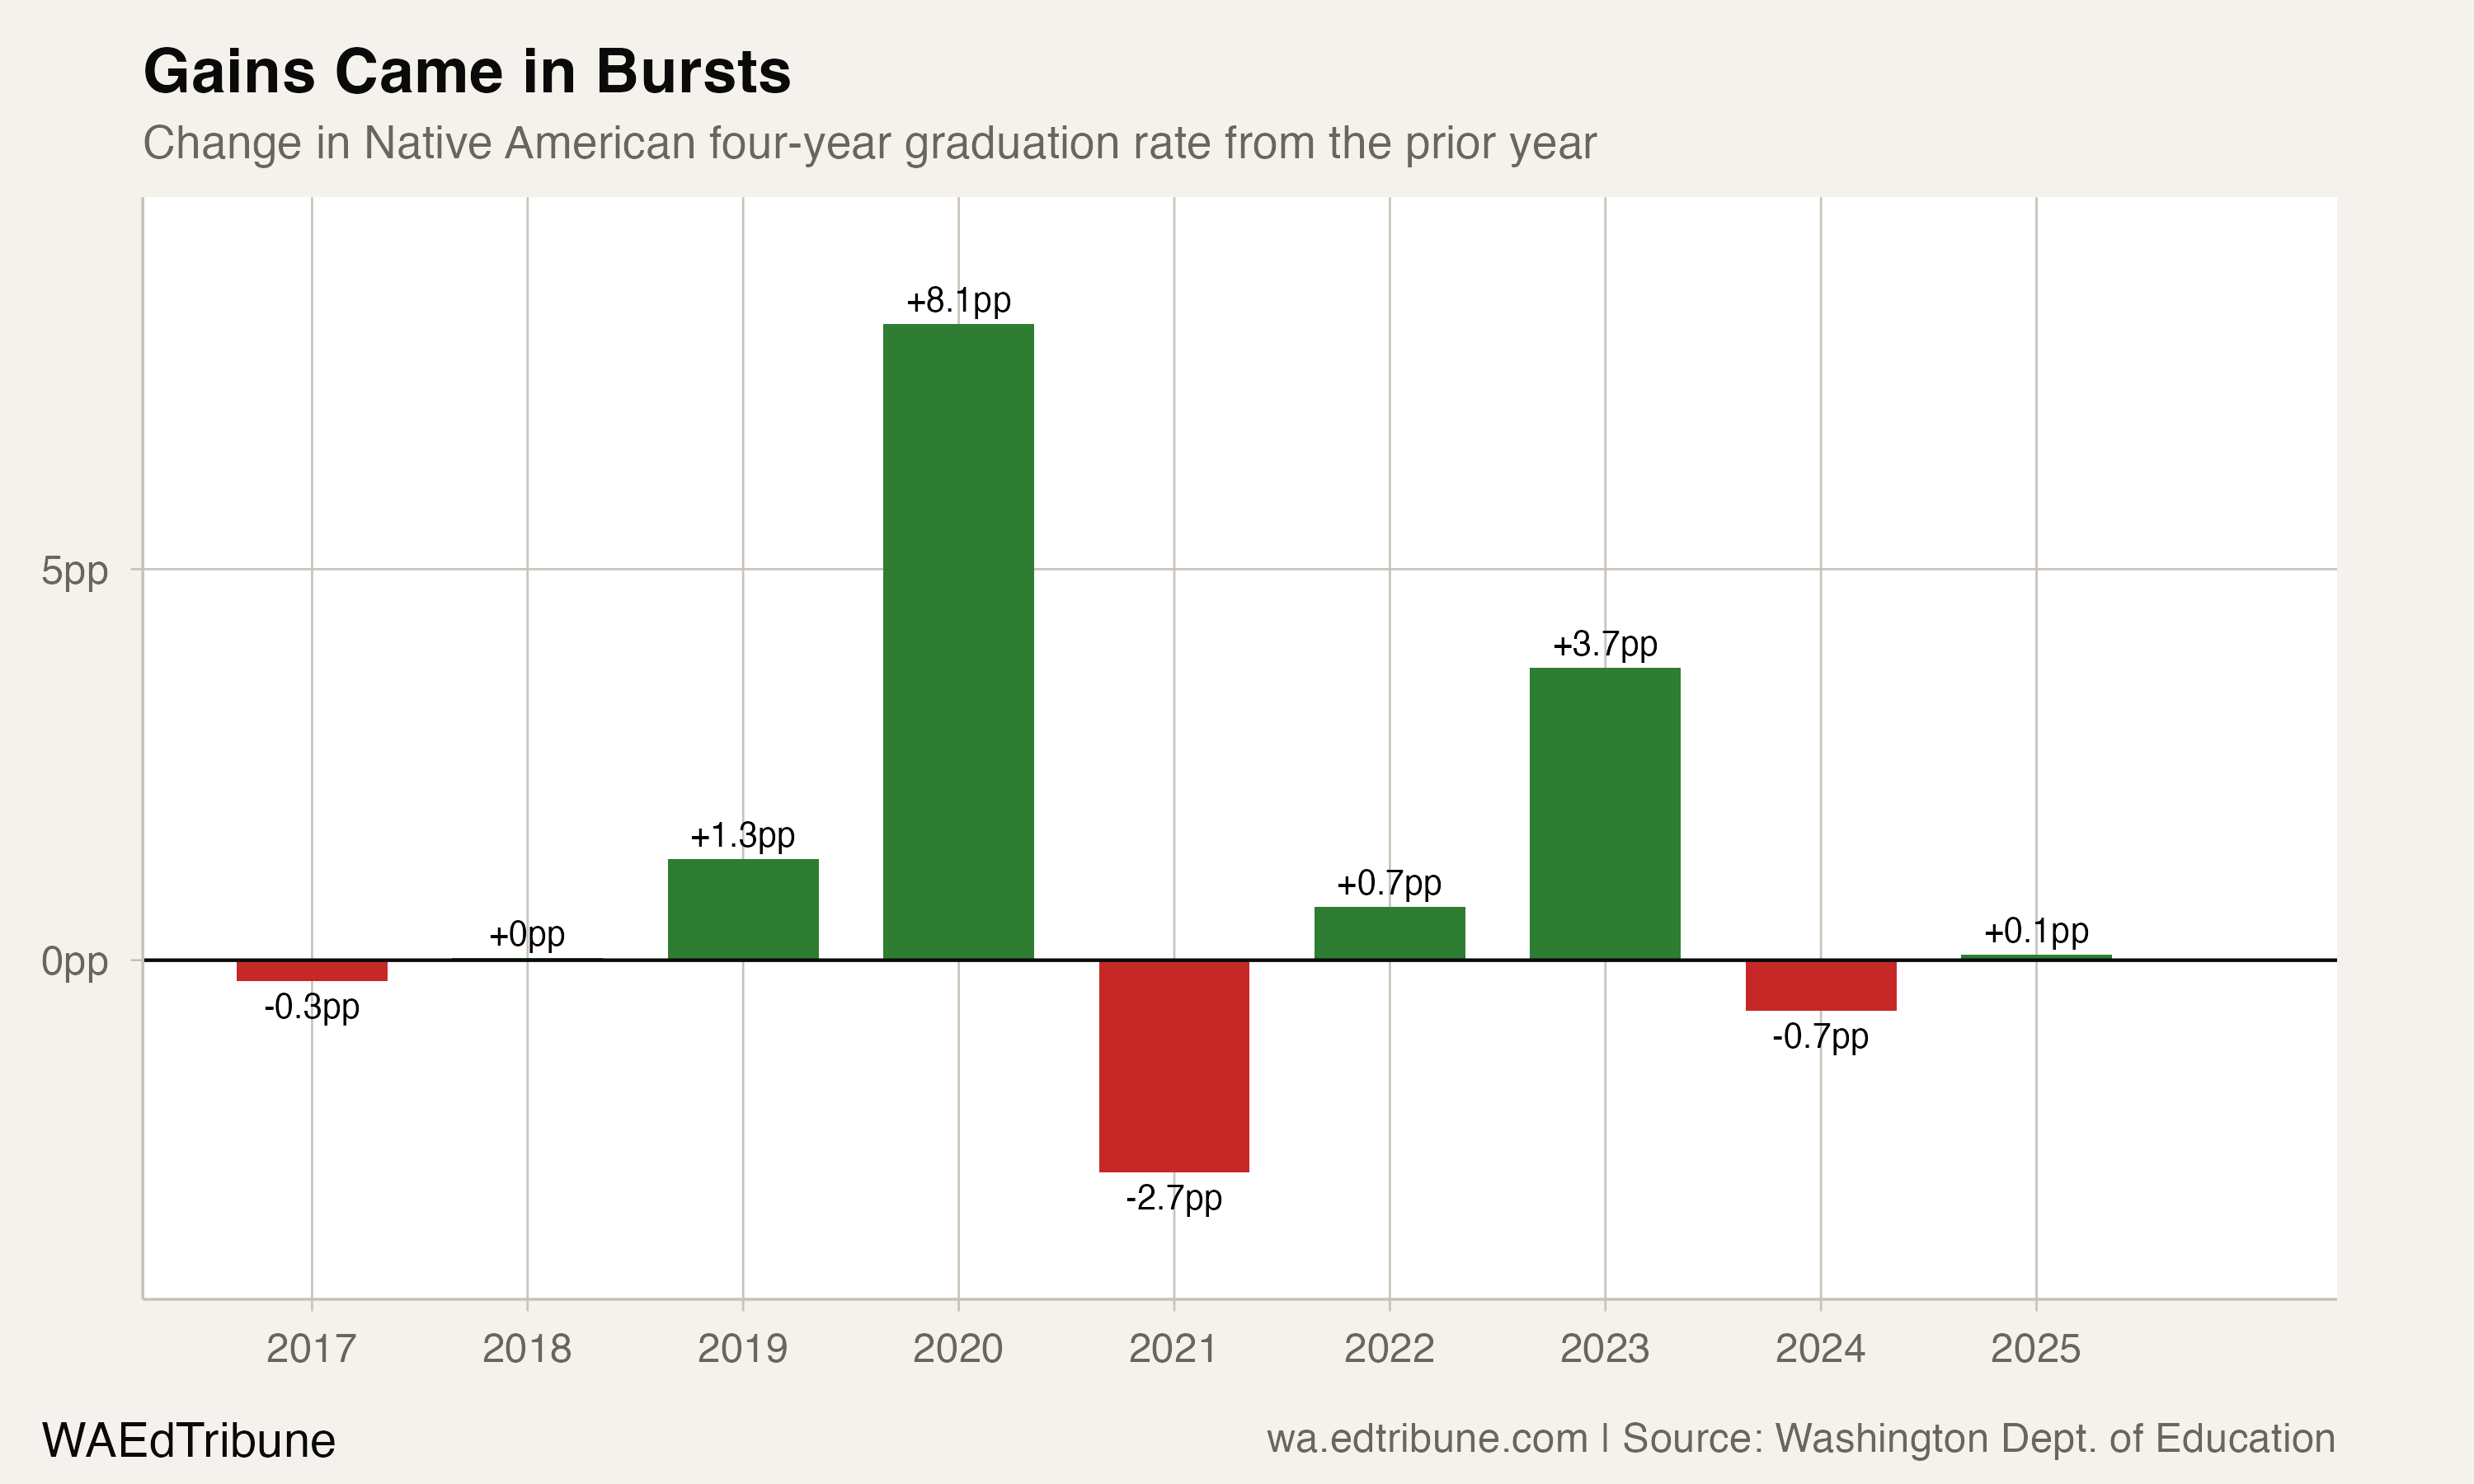
That is the good news. The complication: nearly all of the gain arrived in a two-year window, 2018 to 2020, when the rate surged from 60.4% to 69.8%. Washington's Class of 2020 graduated under emergency diploma waivers. The state waived graduation pathway requirements and allowed districts to excuse up to two course credits for students affected by school building closures. Whether those 9.4 percentage points of improvement reflect real academic progress or policy flexibility is not a question the data alone can settle.
The two eras
The trajectory splits cleanly into before and after COVID.
From 2016 through 2018, Native American graduation barely moved: 60.6%, 60.3%, 60.4%. Three years of stasis while the state average climbed from 79.1% to 80.9%. The gap actually widened, reaching 20.5 points to the state average and 22.5 points to white students in 2018, the widest of any year since 2016.
Then the COVID-era jump: 60.4% to 69.8% in just two years, with most of the gain concentrated in the Class of 2020. The state average rose 2.0 points over that same period. Native American students gained 9.4.
After 2020, the rate dipped to 67.1% for the Class of 2021, edged up to 67.8% for the Class of 2022, then climbed back to 71.5% by 2023 before settling into a narrow band: 70.8% (2024), 70.9% (2025). Three consecutive years within a single percentage point of each other. That post-COVID plateau is the strongest evidence that the gains, whatever their origin, have stuck.
The waiver question
Washington's emergency graduation waivers, adopted in April 2020 and extended through the Class of 2024, allowed districts to waive up to two course credits and graduation pathway requirements for students whose learning was disrupted by building closures. For the Class of 2022, 9,049 students, or about 13% of graduates, received some form of waiver. The State Board of Education found that students identifying as Native American or Alaska Native, along with Black, Hispanic, and Pacific Islander students, used credit and pathway waivers "at rates higher than the state rate."
That finding does not prove the graduation rate improvement is artificial. It does mean the 9.4-point jump from 2018 to 2020 cannot be attributed entirely to instructional gains. Some students who would not have graduated under pre-pandemic rules received diplomas through the waiver pathway.
The counterargument: the rate held after the waivers expired. The Class of 2025, the first cohort with no COVID-era graduation flexibility, posted 70.9%, essentially matching the 2023 and 2024 rates. If waivers were the primary driver, a significant decline should have materialized by now.
Where the gains land unevenly
The statewide number masks enormous district-level variation. Washington reports Native American graduation data for 21 districts, though most suppress cohort counts for privacy (only three districts report 10 or more Native American students in the 2025 cohort).
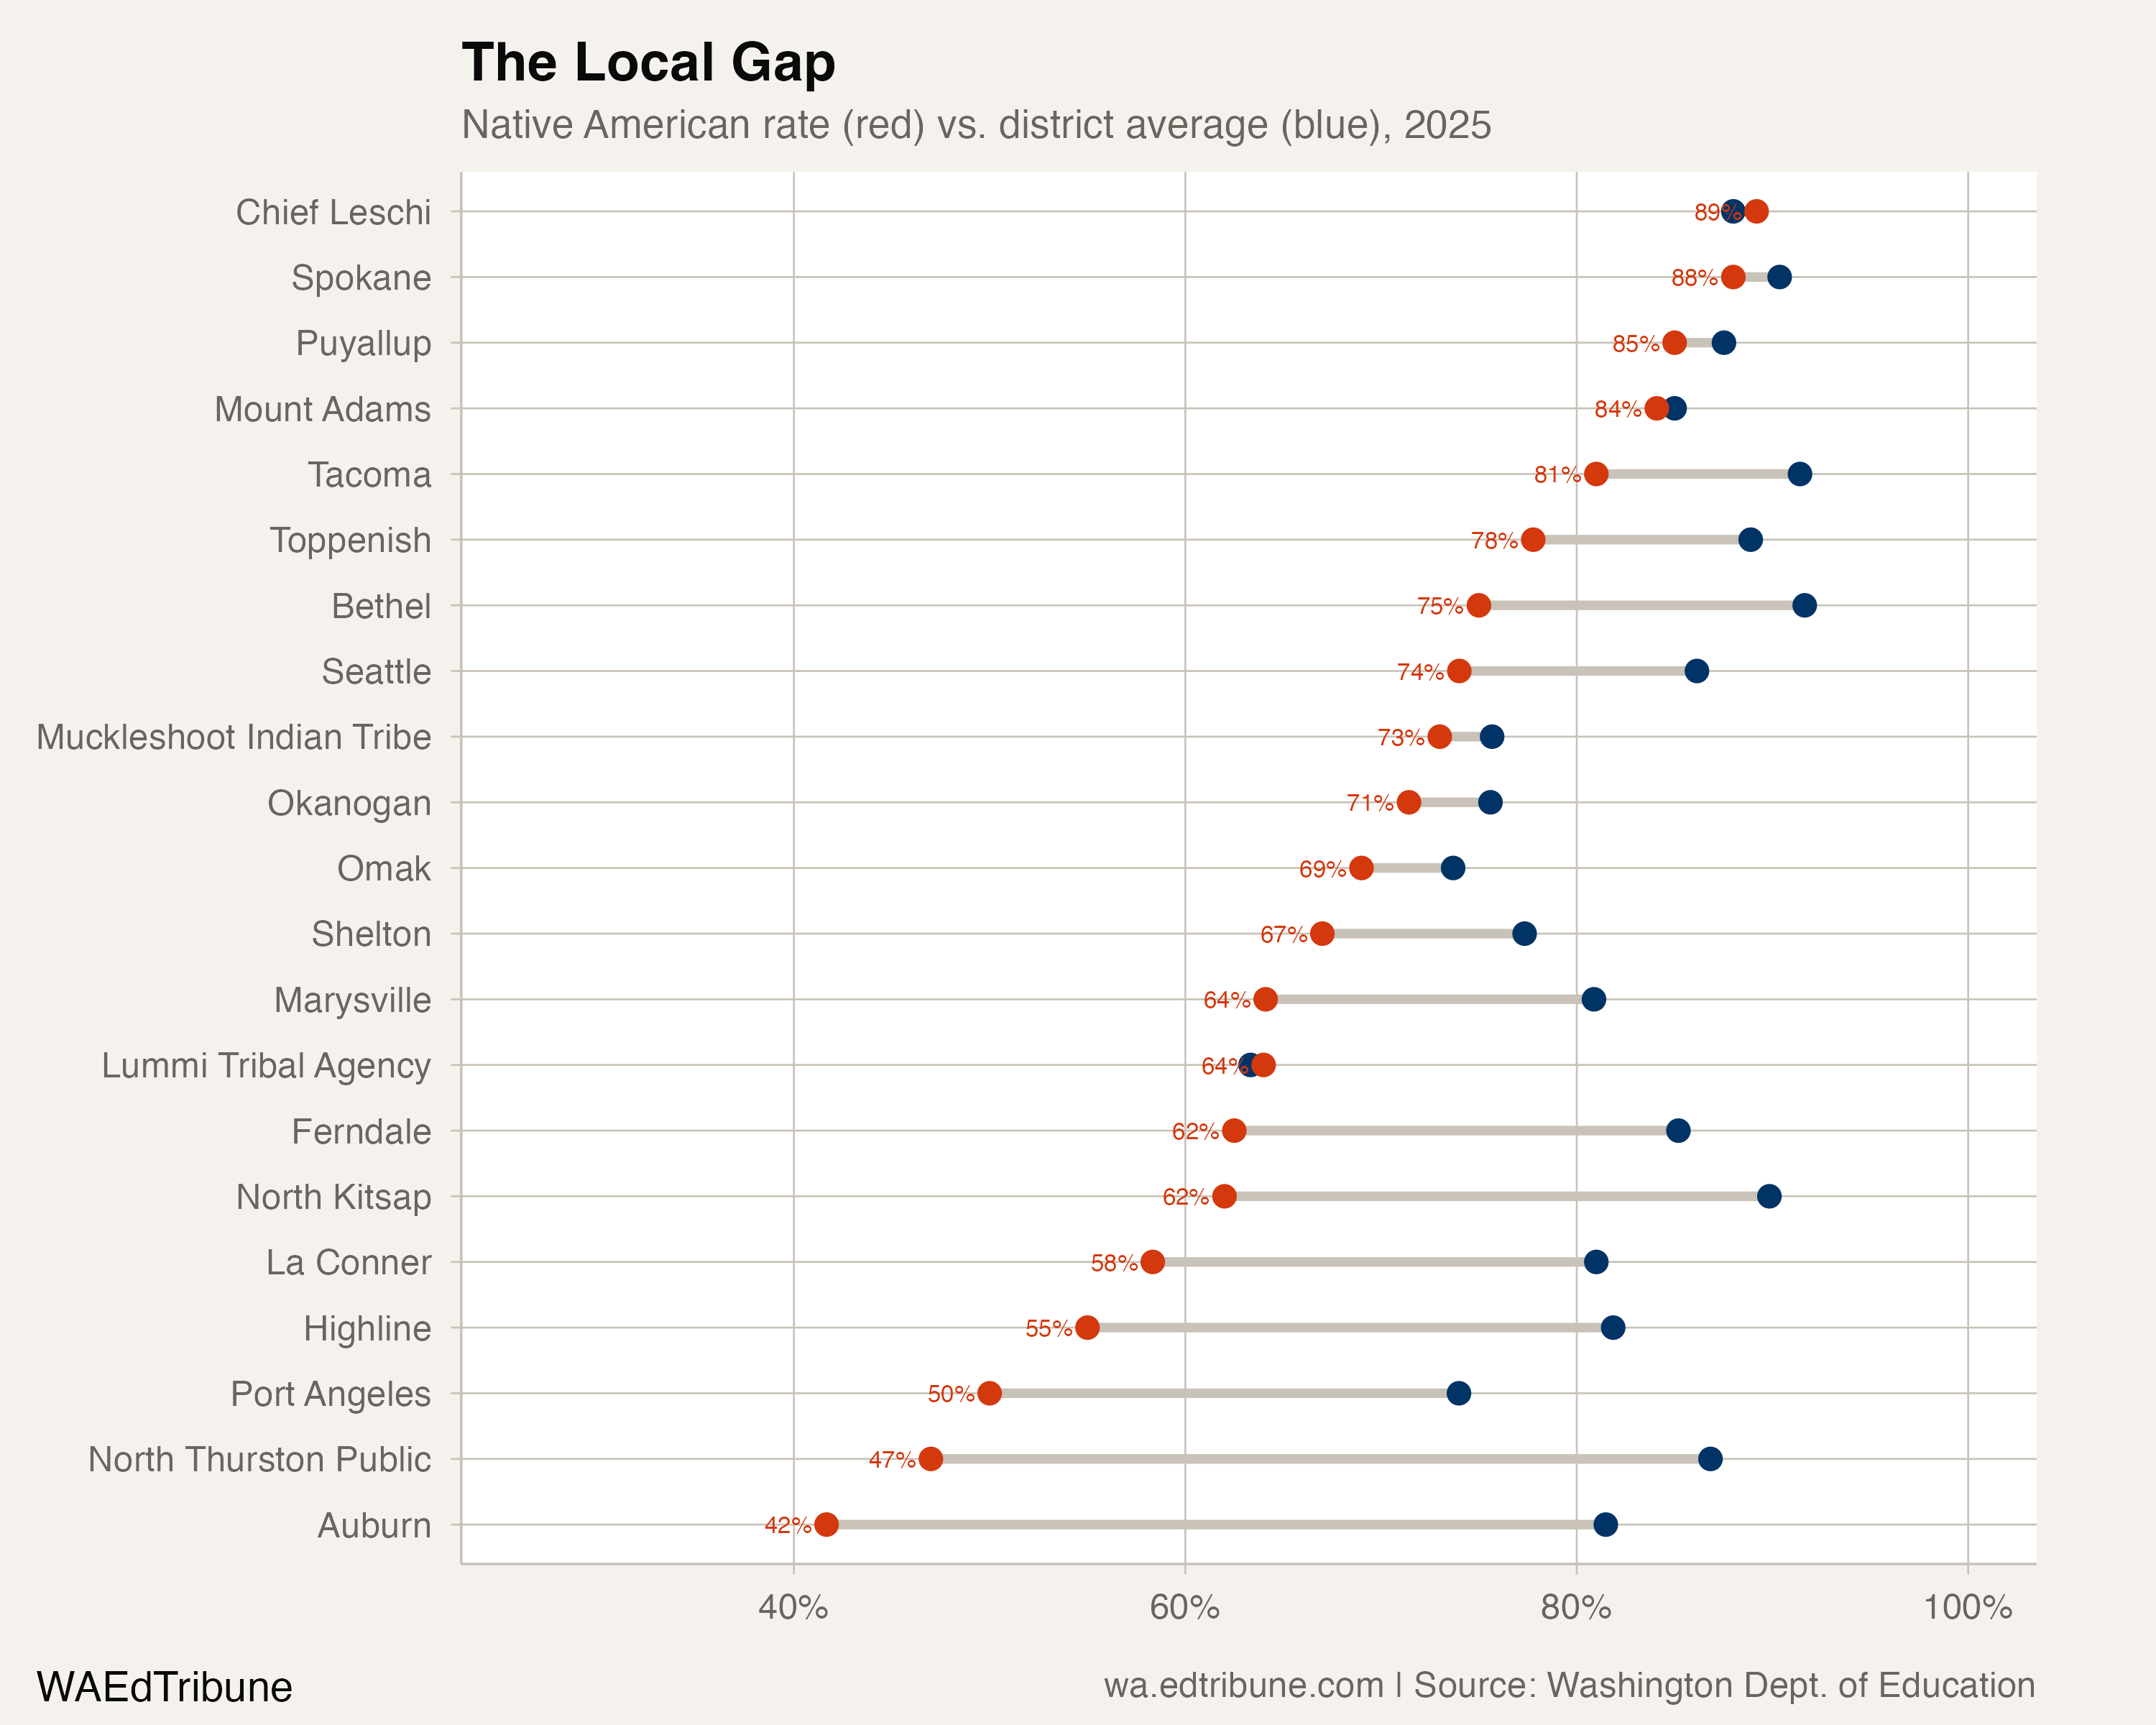
The widest gaps sit outside reservation communities. Auburn, a suburban district southeast of Seattle, reports a 41.7% Native American graduation rate against an 81.5% district average, a 39.8-point gap. North Thurston, near Olympia, shows 47% against 86.8%. In these districts, Native American students represent a small fraction of the cohort, and support structures built for the dominant population may not address their needs.
Reservation-adjacent districts tell a different story. Toppenish, where the district serves the Yakama Reservation, rose from 61.3% overall in 2016 to 88.9% in 2025. Its Native American rate climbed from 71% to 77.8% over the same period. Mount Adams School District↗ET, deeper in the Yakima Valley, saw its Native American rate jump from 60% to 84.1%, though small cohort sizes (24 to 41 students in the years the state published one) make single-year numbers volatile.
The Muckleshoot Indian Tribe↗ET school, a tribal compact school in King County, posted a 73% Native American rate in 2025, up from 46.7% in 2016. Chief Leschi Schools, another state-tribal compact, reported 89.2%.
The compact school model
Washington's State-Tribal Education Compact Schools, authorized by the Legislature in 2013, allow tribes to operate elementary and secondary schools exempt from most state statutes while receiving public funding. Chief Leschi Schools, Muckleshoot Tribal School, and Lummi Nation Schools are among the eight compact schools operating statewide.
The model rests on a premise: that schools governed by tribal communities, staffed with educators who share students' cultural context, and free to design curriculum around tribal sovereignty produce better outcomes than traditional districts where Native students are a small minority. The 2025 data offers partial support. Chief Leschi's 89.2% rate and Muckleshoot's 73% both exceed the 70.9% statewide Native American average. Lummi Tribal Agency, at 64%, does not.
Washington also mandates the Since Time Immemorial curriculum, requiring all public schools to teach tribal sovereignty, history, and government. The Legislature passed the mandate in 2015, but implementation has been uneven. No deadline for compliance was set, and as of 2022 Cascade PBS reported that it was unlikely the curriculum had been fully implemented across all grade levels in any district. The Tulalip Tribes estimated spending at least $400,000 on curriculum creation and training since 2016.
Faster than any other racial or ethnic group
Among the racial and ethnic groups Washington reports, Native American students posted the largest graduation rate gain since 2016: 10.3 percentage points. Black students gained 7.6 points, students of two or more races 6.2, Hispanic students 4.7, white students 3.5, Pacific Islander students 3.4, and Asian students 2.9.
Across all 16 subgroups the state published in both 2016 and 2025, Native American students rank second. Students in foster care gained more, rising 11.4 points from 39.9% to 51.3%, and students in migrant families gained 10.1. English learners gained 9.9 points (from 57.6% to 67.5%), students experiencing homelessness gained 7.7, students with disabilities gained 7.5, and students from low-income families gained 6.9. White students gained 3.5, matching the state average.
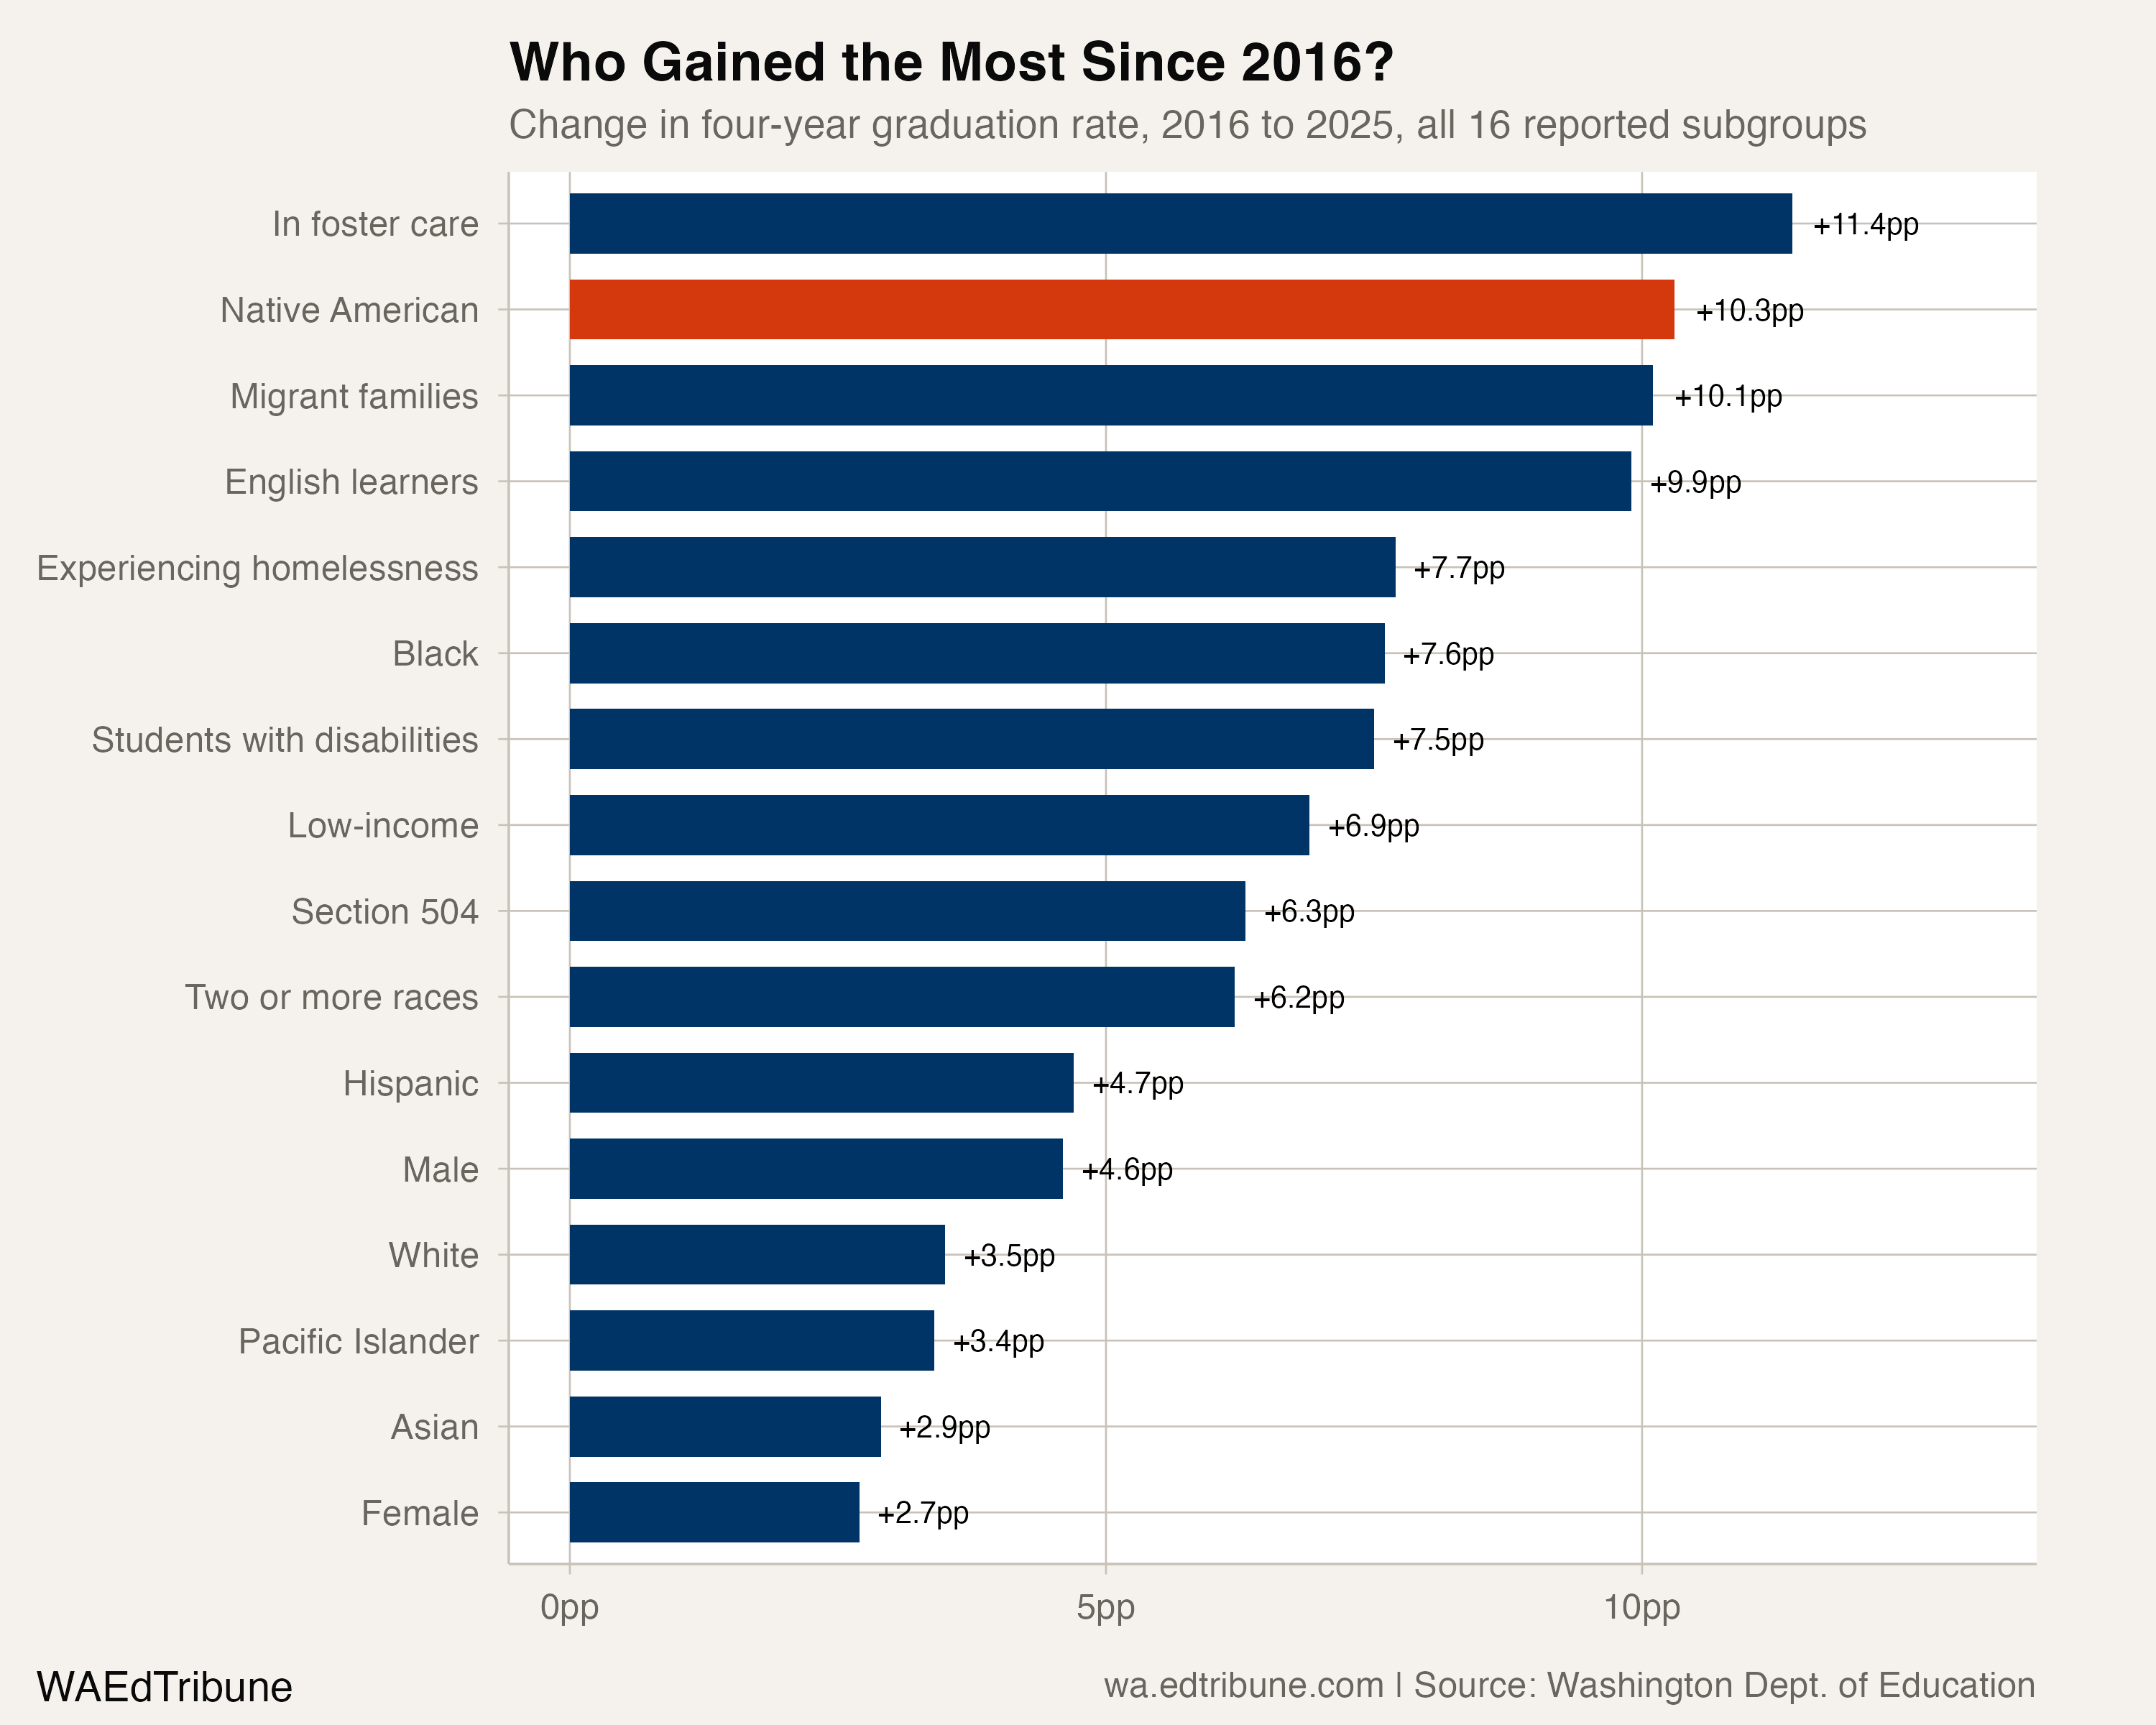
The gap to the state average shrank by 6.8 percentage points, also the largest equity gap reduction of any racial or ethnic group. The gap to white students narrowed from 20.9 to 14.1 points.
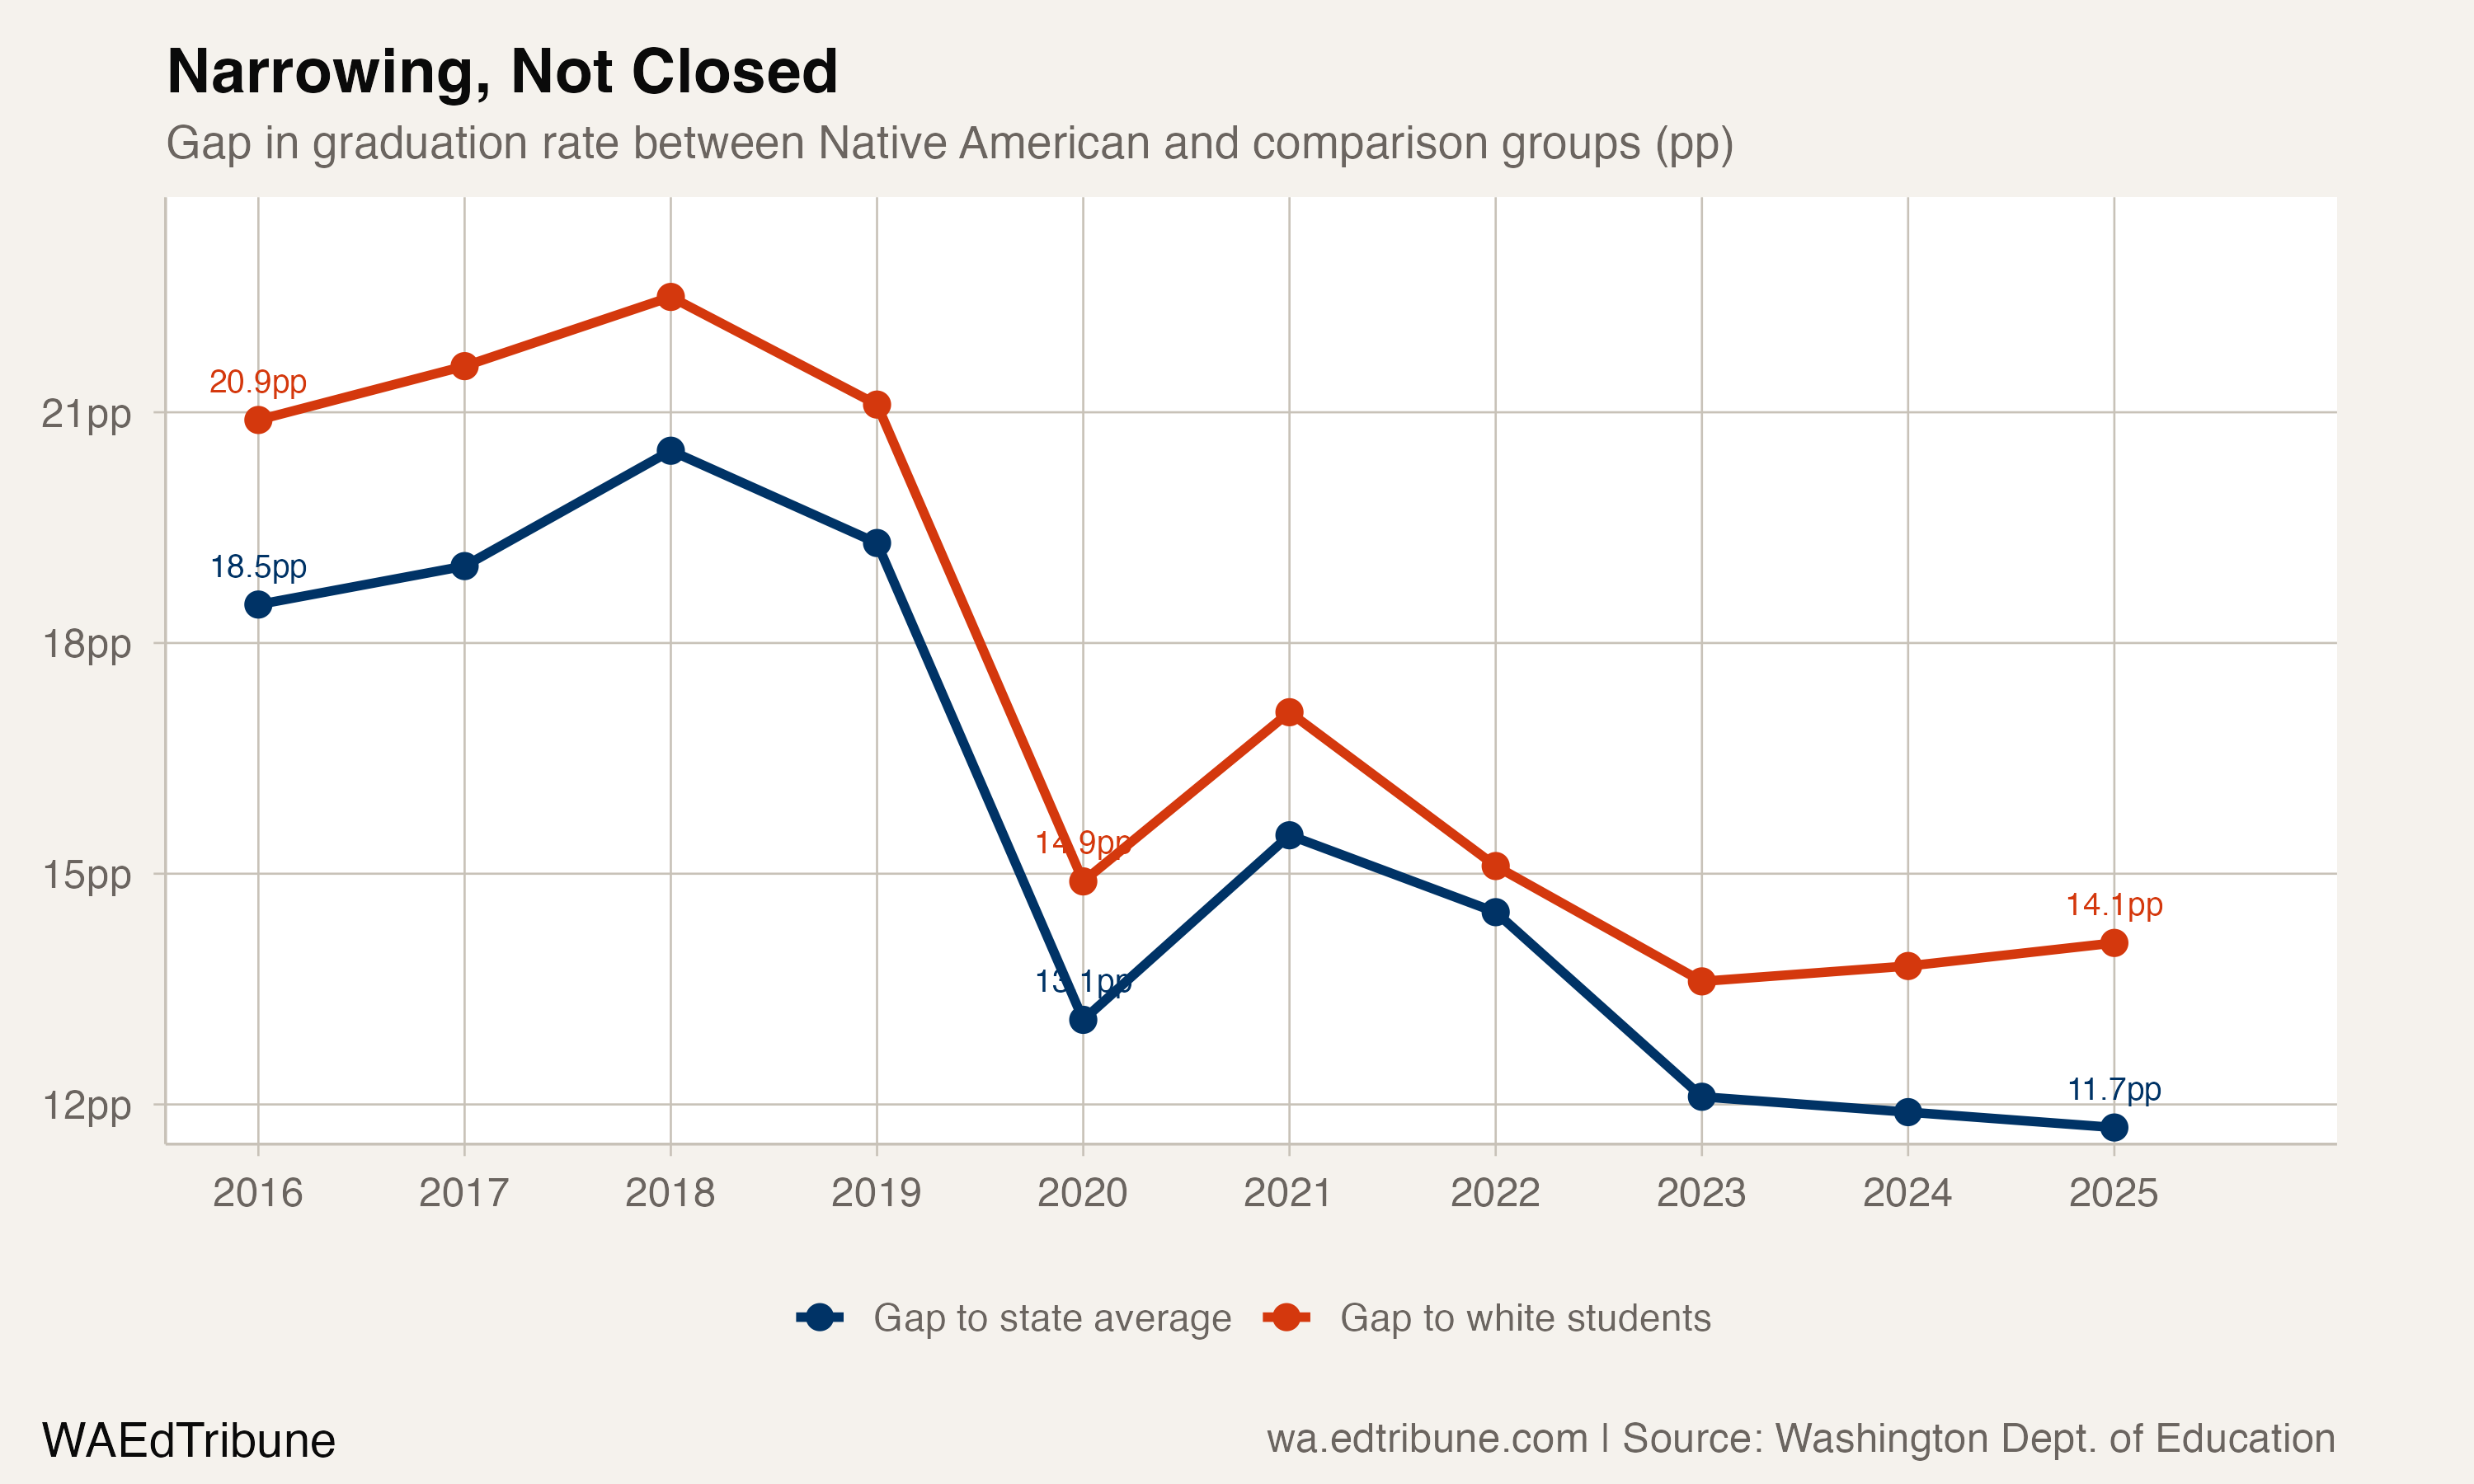
Yet 14.1 points remains substantial. The gap to white students closed 6.8 points over nine years, so at that pace the remaining distance would take roughly another 19 years to close, and that assumes steady gains in a period that has, so far, produced a plateau. Since 2023 the gap to white students has in fact widened slightly, from 13.6 points to 14.1.
The five-year graduation rate tells a similar story, one cohort behind. Washington's five-year rate published for 2025 describes the class of 2024, which reached 74.4%, up from 62.8% for the class of 2015. That 11.6-point gain suggests that roughly three-quarters of each Native American cohort eventually completes a diploma, up from closer to two-thirds a decade ago.
What higher graduation does not guarantee
A diploma does not guarantee readiness for what follows. Cascade PBS reported in 2023 that enrollment by American Indian and Alaska Native students at Washington's community and technical colleges fell 38% between 2019 and 2022, and that nationally only about 17% of Native American high school graduates enroll in college, against 60% of the student population overall.
"A $100 application bill can seem insurmountable." -- Zoe Higheagle Strong, WSU Vice Provost for Native American Programs, Cascade PBS, Oct. 2023
Washington has established a Native American endowed scholarship that offers up to $2,000 to 10 to 15 students a year. Oregon, by comparison, allocated $19 million for the first year of a tuition waiver covering tuition, housing, and books.
The cohort is shrinking
One trend the graduation rate conceals: the number of Native American students in the four-year cohort declined from 1,264 in 2016 to 1,107 in 2025, a drop of 12.4%. The state cohort moved the other way over the same period, growing 11.4% from 81,041 to 90,315. Native American students represented about 1.6% of the graduation cohort in 2016. They now represent 1.2%.
A shrinking cohort can mechanically improve a graduation rate if the students who leave the cohort (by moving, dropping out before ninth grade, or enrolling elsewhere) are disproportionately those who would not have graduated. The data does not distinguish between these causes. But the rate improvement is real on its own terms: 785 Native American students received diplomas in 2025, compared to 766 in 2016, despite the smaller cohort. More students are finishing, even if fewer are in the pipeline.
The question for the coming years is whether the plateau at 70-71% represents a ceiling or a resting point. Marysville School District↗ET, just north of Everett, has seen its Native American graduation rate swing between 35.6% and 74.3% over the past decade, never staying in one place long enough to call it a trend. Auburn has swung between 30.8% and 71% since 2016, landing at 41.7% for the Class of 2025. The statewide number is stable precisely because it averages over volatility that, in any individual community, feels like chaos.
Detailed code that reproduces the analysis and figures in this article is available exclusively to EdTribune subscribers.
Discussion
Sign in to join the discussion.
Loading comments...