Correction (October 11, 2026): Washington's state education agency republished its attendance data on September 30, 2026, with recalculated counts for every year, and this article now reflects that edition. Sixteen districts, not 18, meet all three tests. Arlington and Orting each had a 2022 rate of 39.9% in the restated data, just under the 40% threshold. The 16 districts enrolled 37,532 students. College Place's reduction, 24.6 points, is now the second-largest rather than the third. Nine districts, not 11, improved every year; 15 of the 16 remain above their 2019 rates; and 12, not 13, recovered more than half of their increase. The statewide rate for 2025 is 27.3%, not 27.1%.
Correction (September 30, 2026): An earlier version of this article said 19 districts met all three of its tests (a 2022 rate of at least 40%, a 2025 rate below 30%, and at least 500 students). One of them, Chewelah, does not hold up once its rate is checked against its own schools. Chewelah's published rate fell from 41.7% in 2022 to 28.6% in 2025, but about a fifth of its students attend two programs whose attendance the state does not publish school by school, and across Chewelah's schools that do publish counts the rate was 49.9% in 2022 and 34.3% in 2025, above the 30% ceiling. The list is 18 districts enrolling 46,101 students. The counts of districts that improved every year, stayed above 2019 and recovered more than half of their increase were recomputed, and the article now notes the same measurement issue for Okanogan and Newport, both of which still meet every test. College Place's figures did not change.
Correction (July 21, 2026): The original analysis kept using a cached data file after detecting that it differed from the state's current published attendance data. This version derives every displayed rate from the published student-count fields. It also corrects the statewide recovery share and removes economic-status, causal, policy, and predictive claims that the analysis did not establish.
Update (August 17, 2026): We asked College Place for context before publication and Superintendent Jim Fry sent a detailed written account of the district's attendance work on July 9. It did not reach the article when it published on July 15. That was our error, and this version adds it. No figure in the piece has changed.
In 2022, 112 Washington school districts had published chronic-absence rates of at least 40%. By 2025, 16 of those districts had rates below 30% and enrollments of at least 500 students. Together, the 16 districts enrolled 37,532 students in 2025.
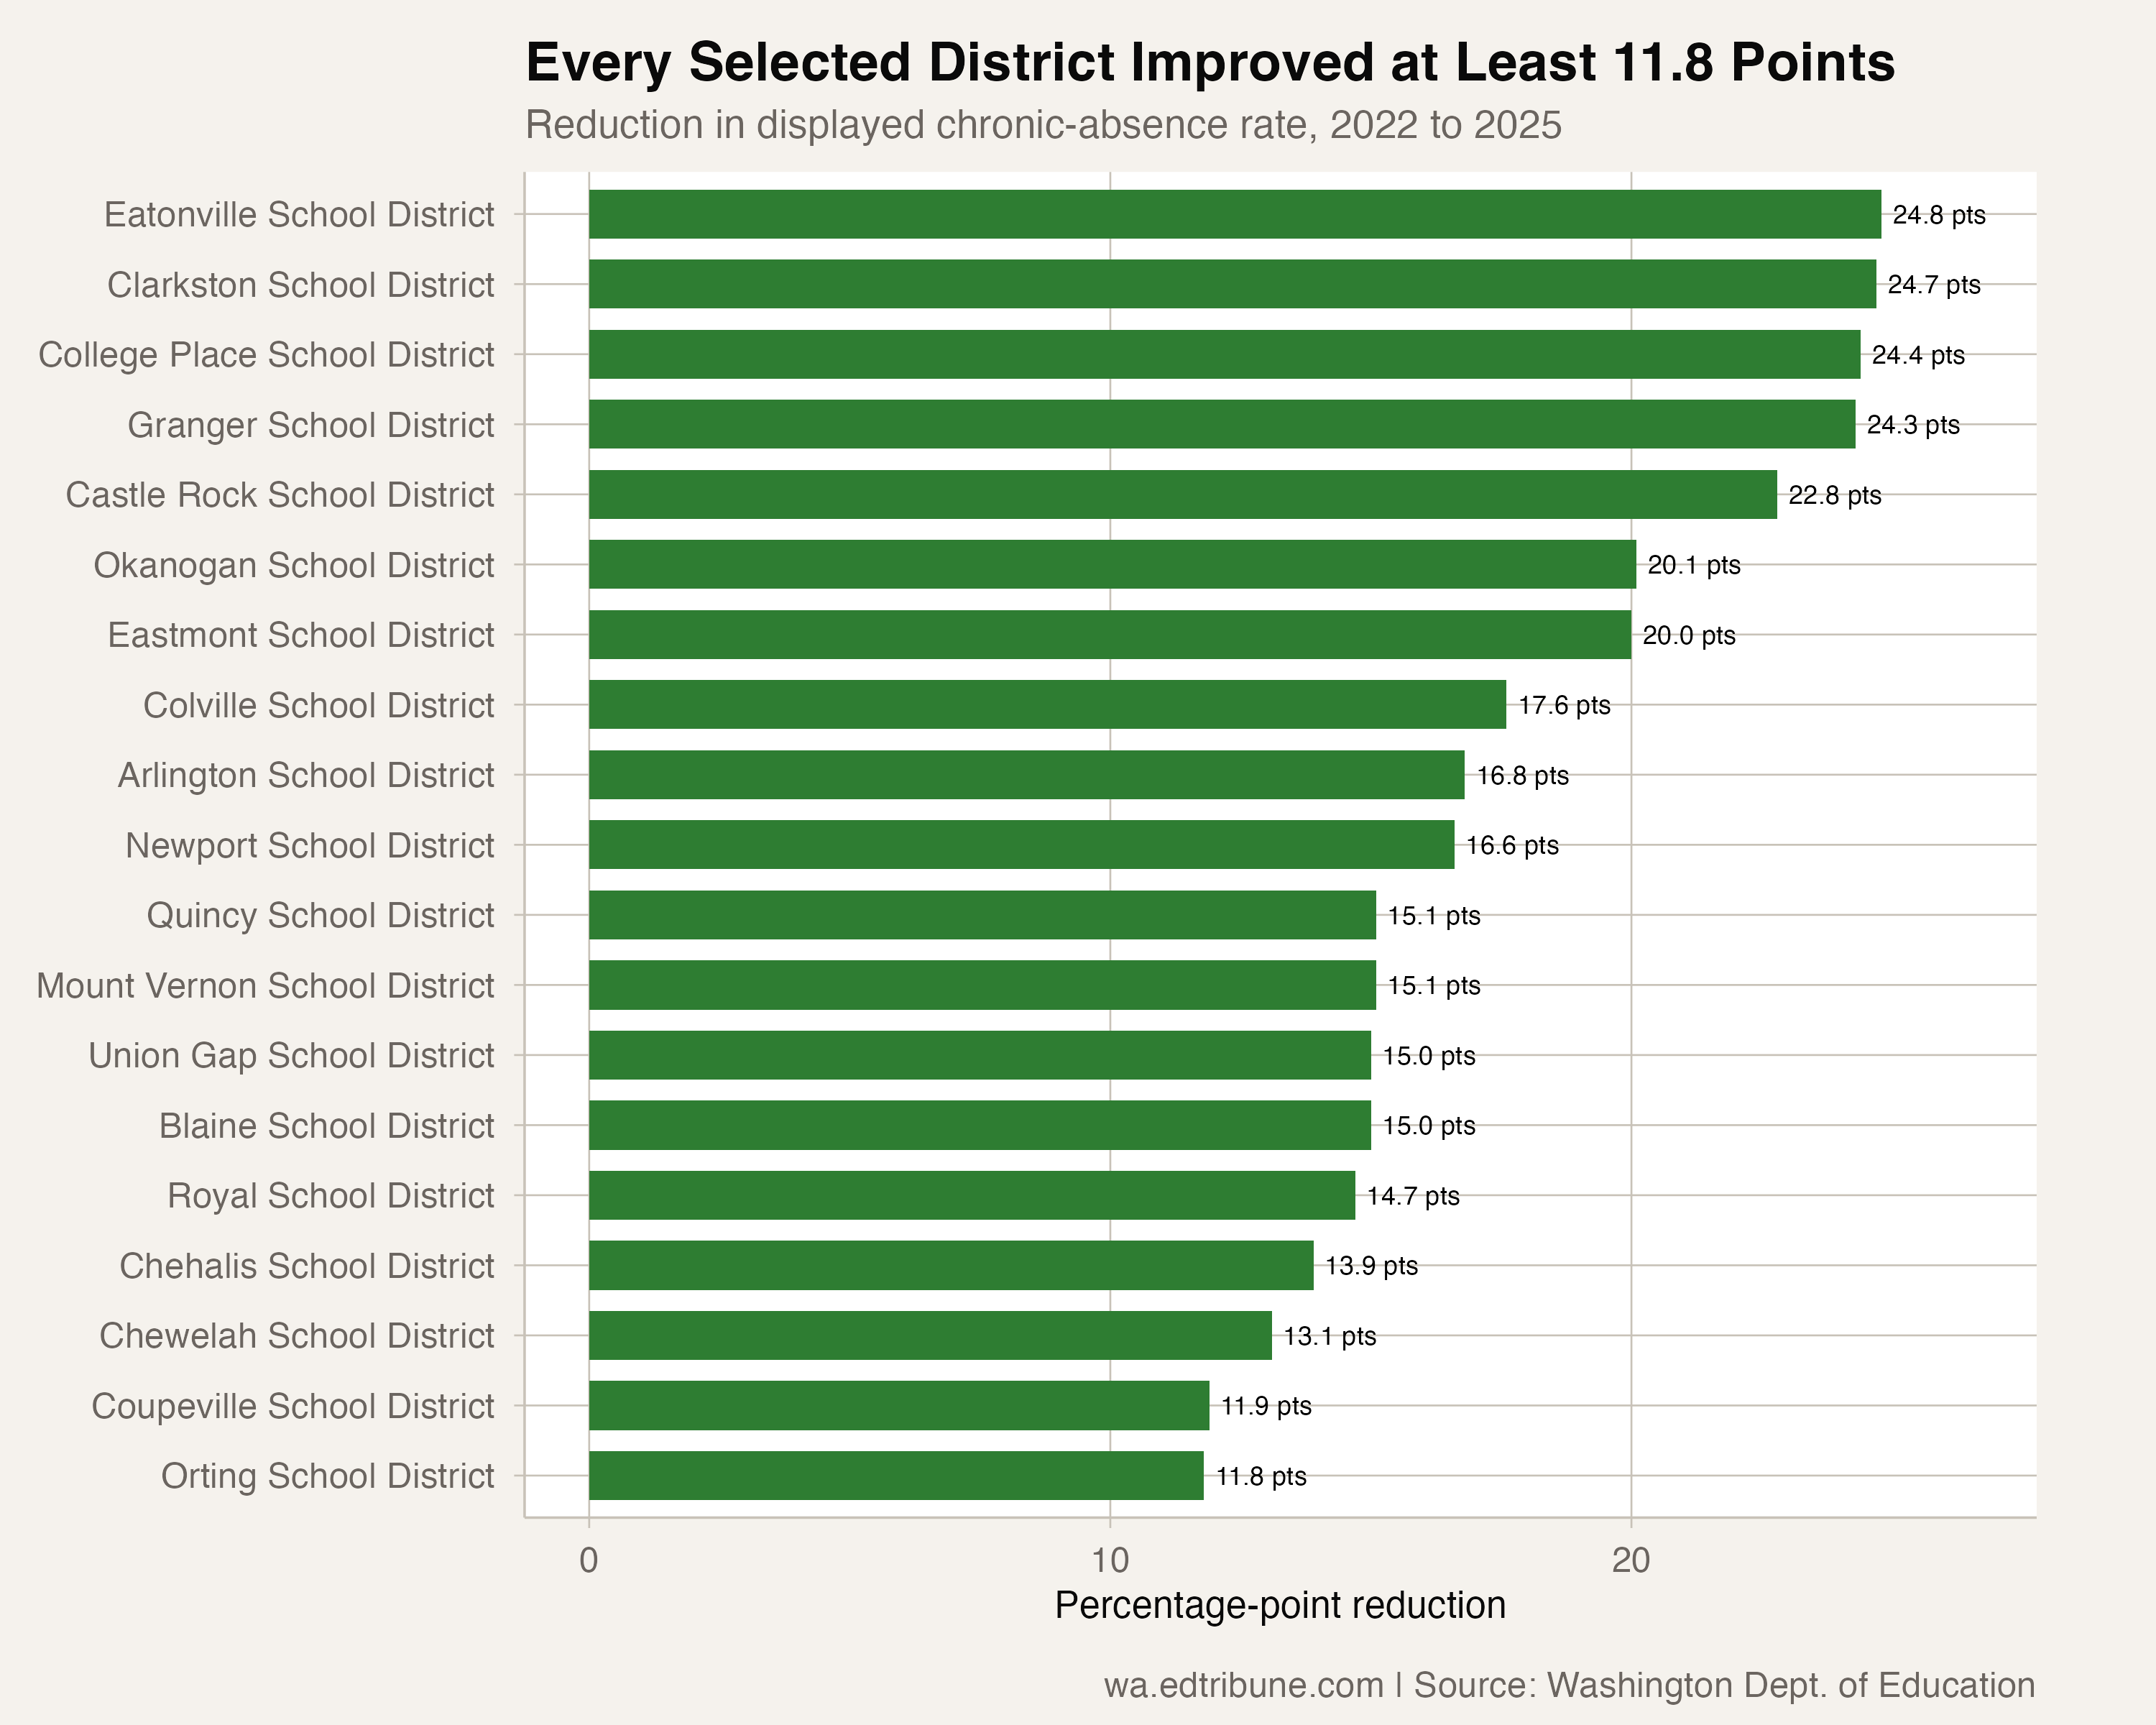
The four largest reductions were in Eatonville↗ET, down 24.7 percentage points; College Place↗ET, down 24.6 points; Clarkston↗ET, down 24.5 points; and Granger↗ET, down 24.3 points.
The Scale of the Improvement
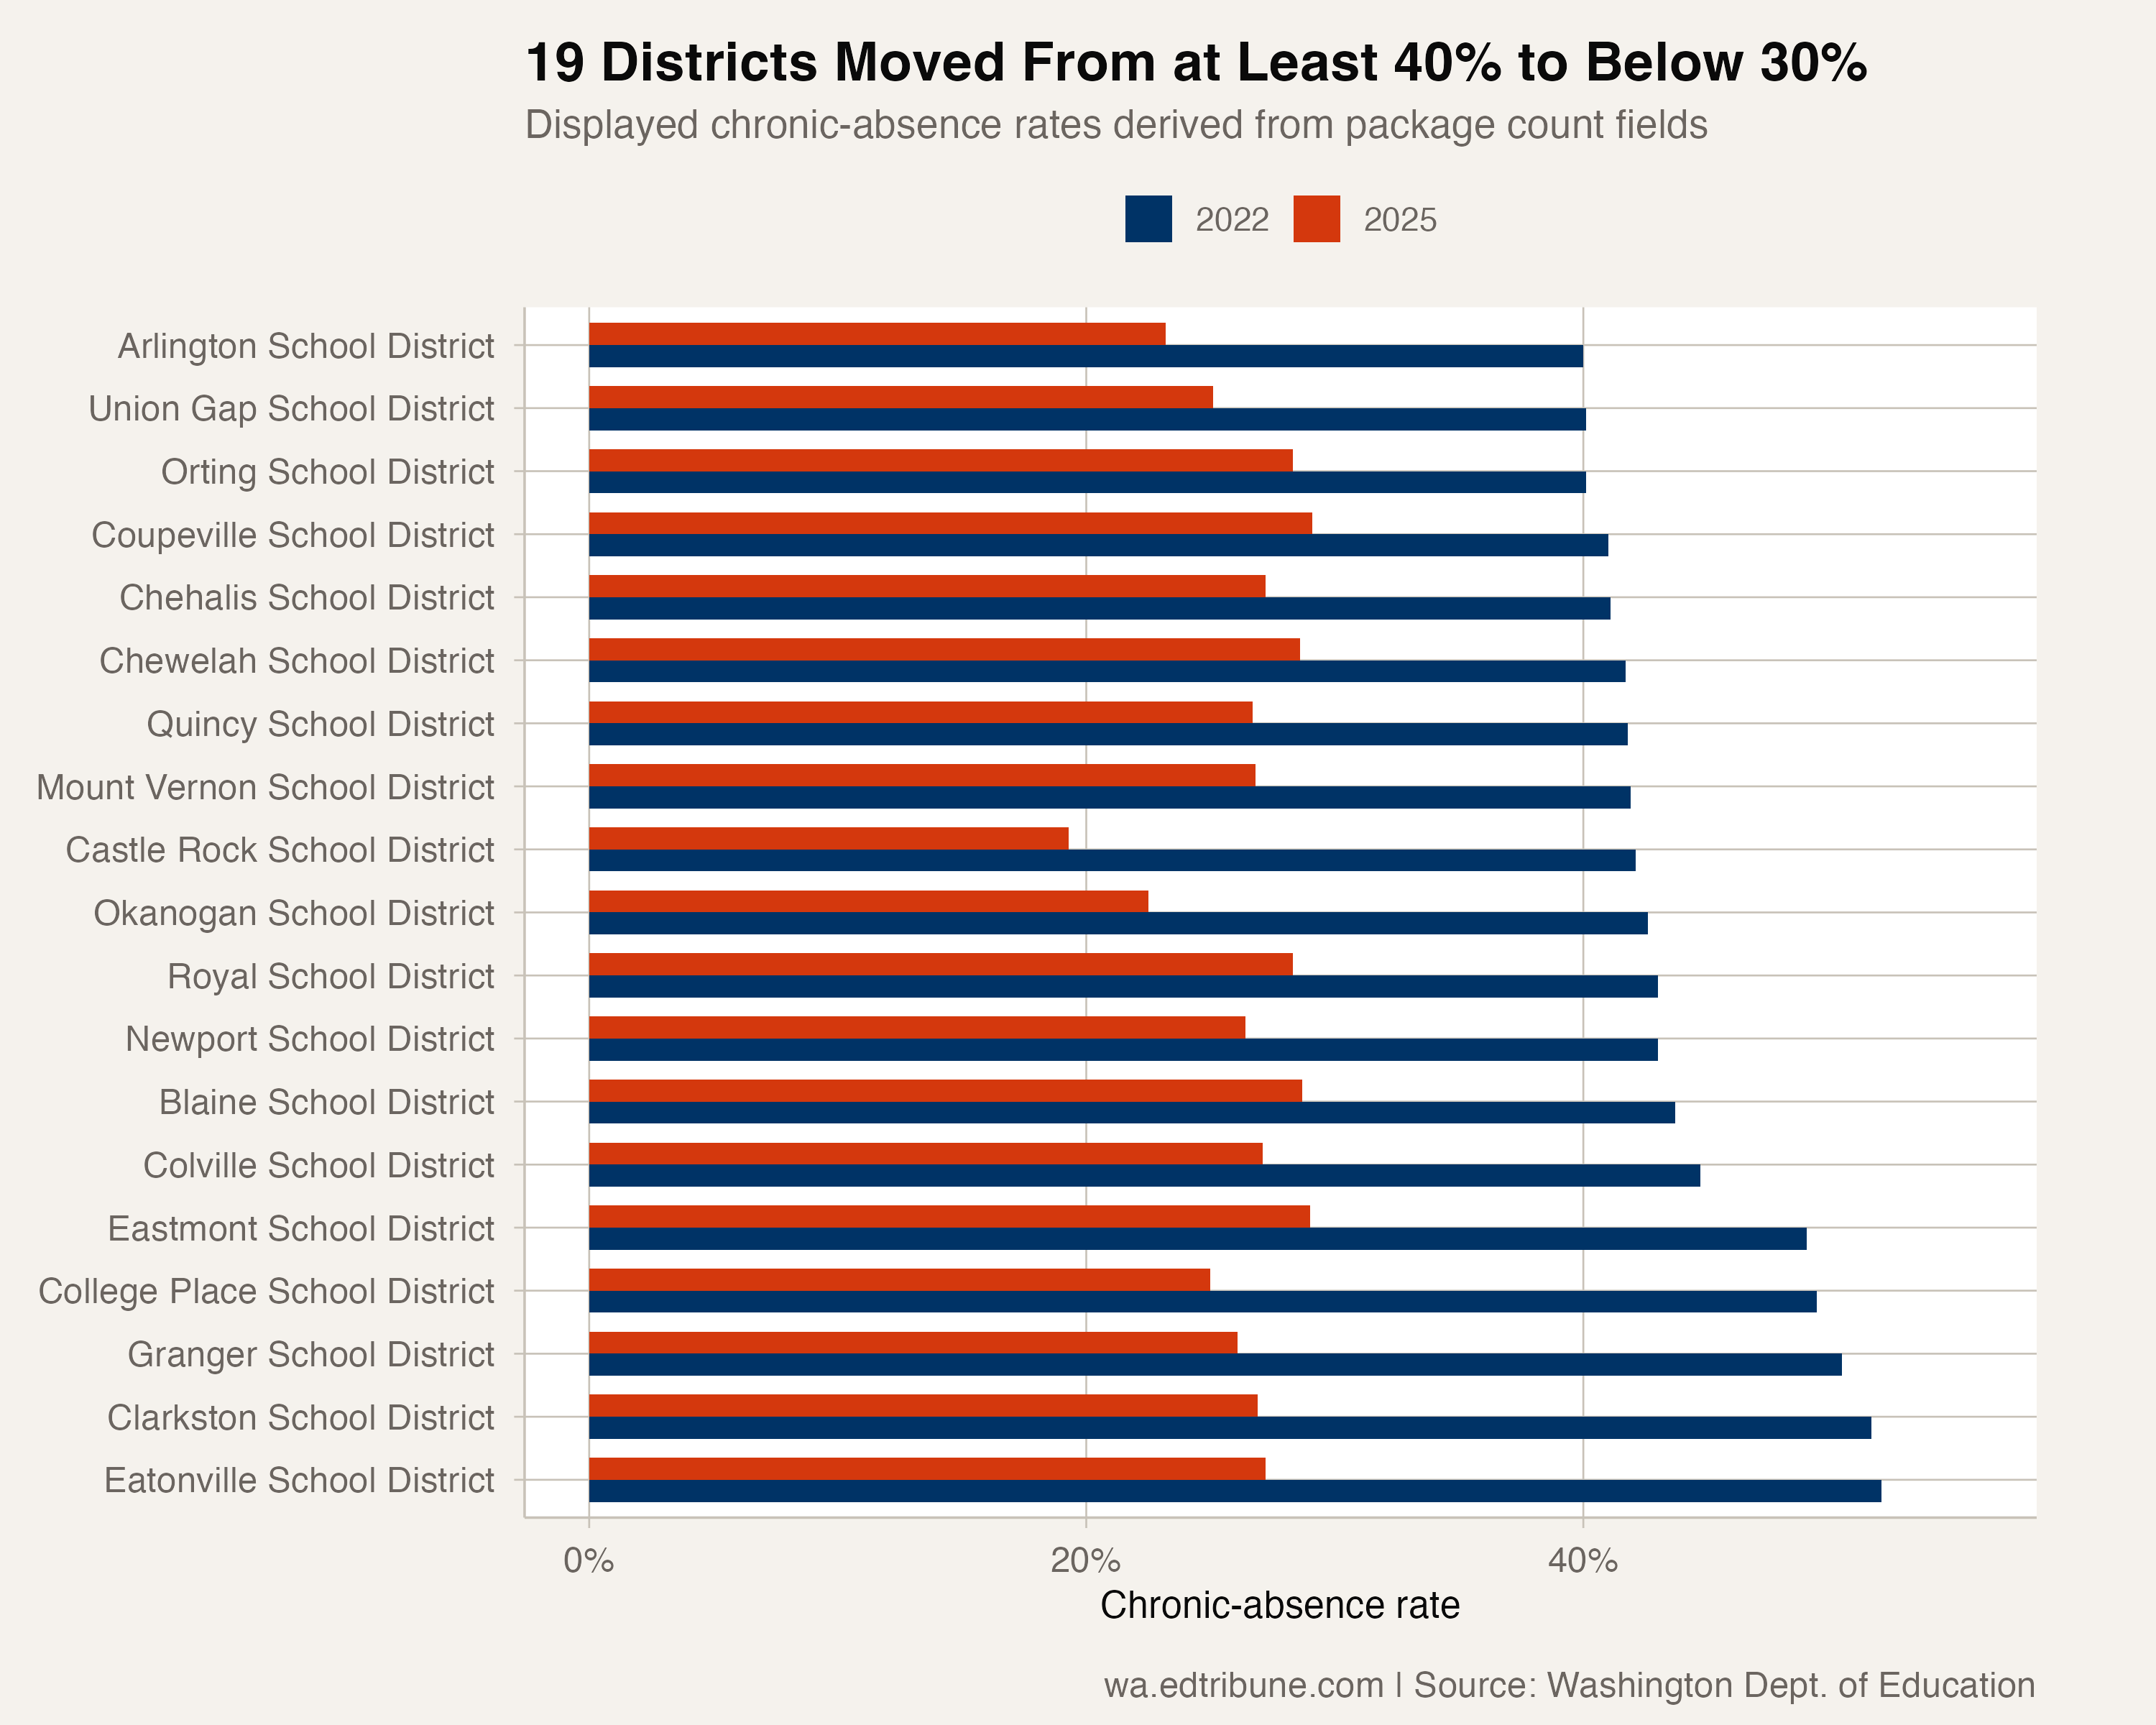
Every district on this list started at 40% or higher in 2022 and finished below 30% in 2025. Their reductions ranged from 11.7 to 24.7 percentage points.
Statewide, Washington moved from 32.8% in 2022 to 27.3% in 2025, a 5.5-point reduction. The 16 selected districts' reductions were between 2.1 and 4.5 times the statewide reduction.
Results Across District Sizes
Castle Rock↗ET, with 1,458 students in 2025, moved from 42.0% to 19.3%. Okanogan↗ET, with 1,092 students, moved from 41.9% to 22.5%. Okanogan's district rate includes several small schools and programs whose attendance the state does not publish school by school; across the Okanogan schools that do publish counts, the rate fell from 46.0% to 24.8%, so the district meets both tests either way.
The group also included larger systems. Eastmont↗ET, with 5,994 students, moved from 49.0% to 29.0%. Blaine, with 2,027 students, moved from 43.7% to 28.7%. Arlington↗ET, which an earlier version of this article listed, is no longer on it: in the state's restated data its 2022 rate was 39.9%, just under the 40% test, before it fell to 23.2% in 2025.
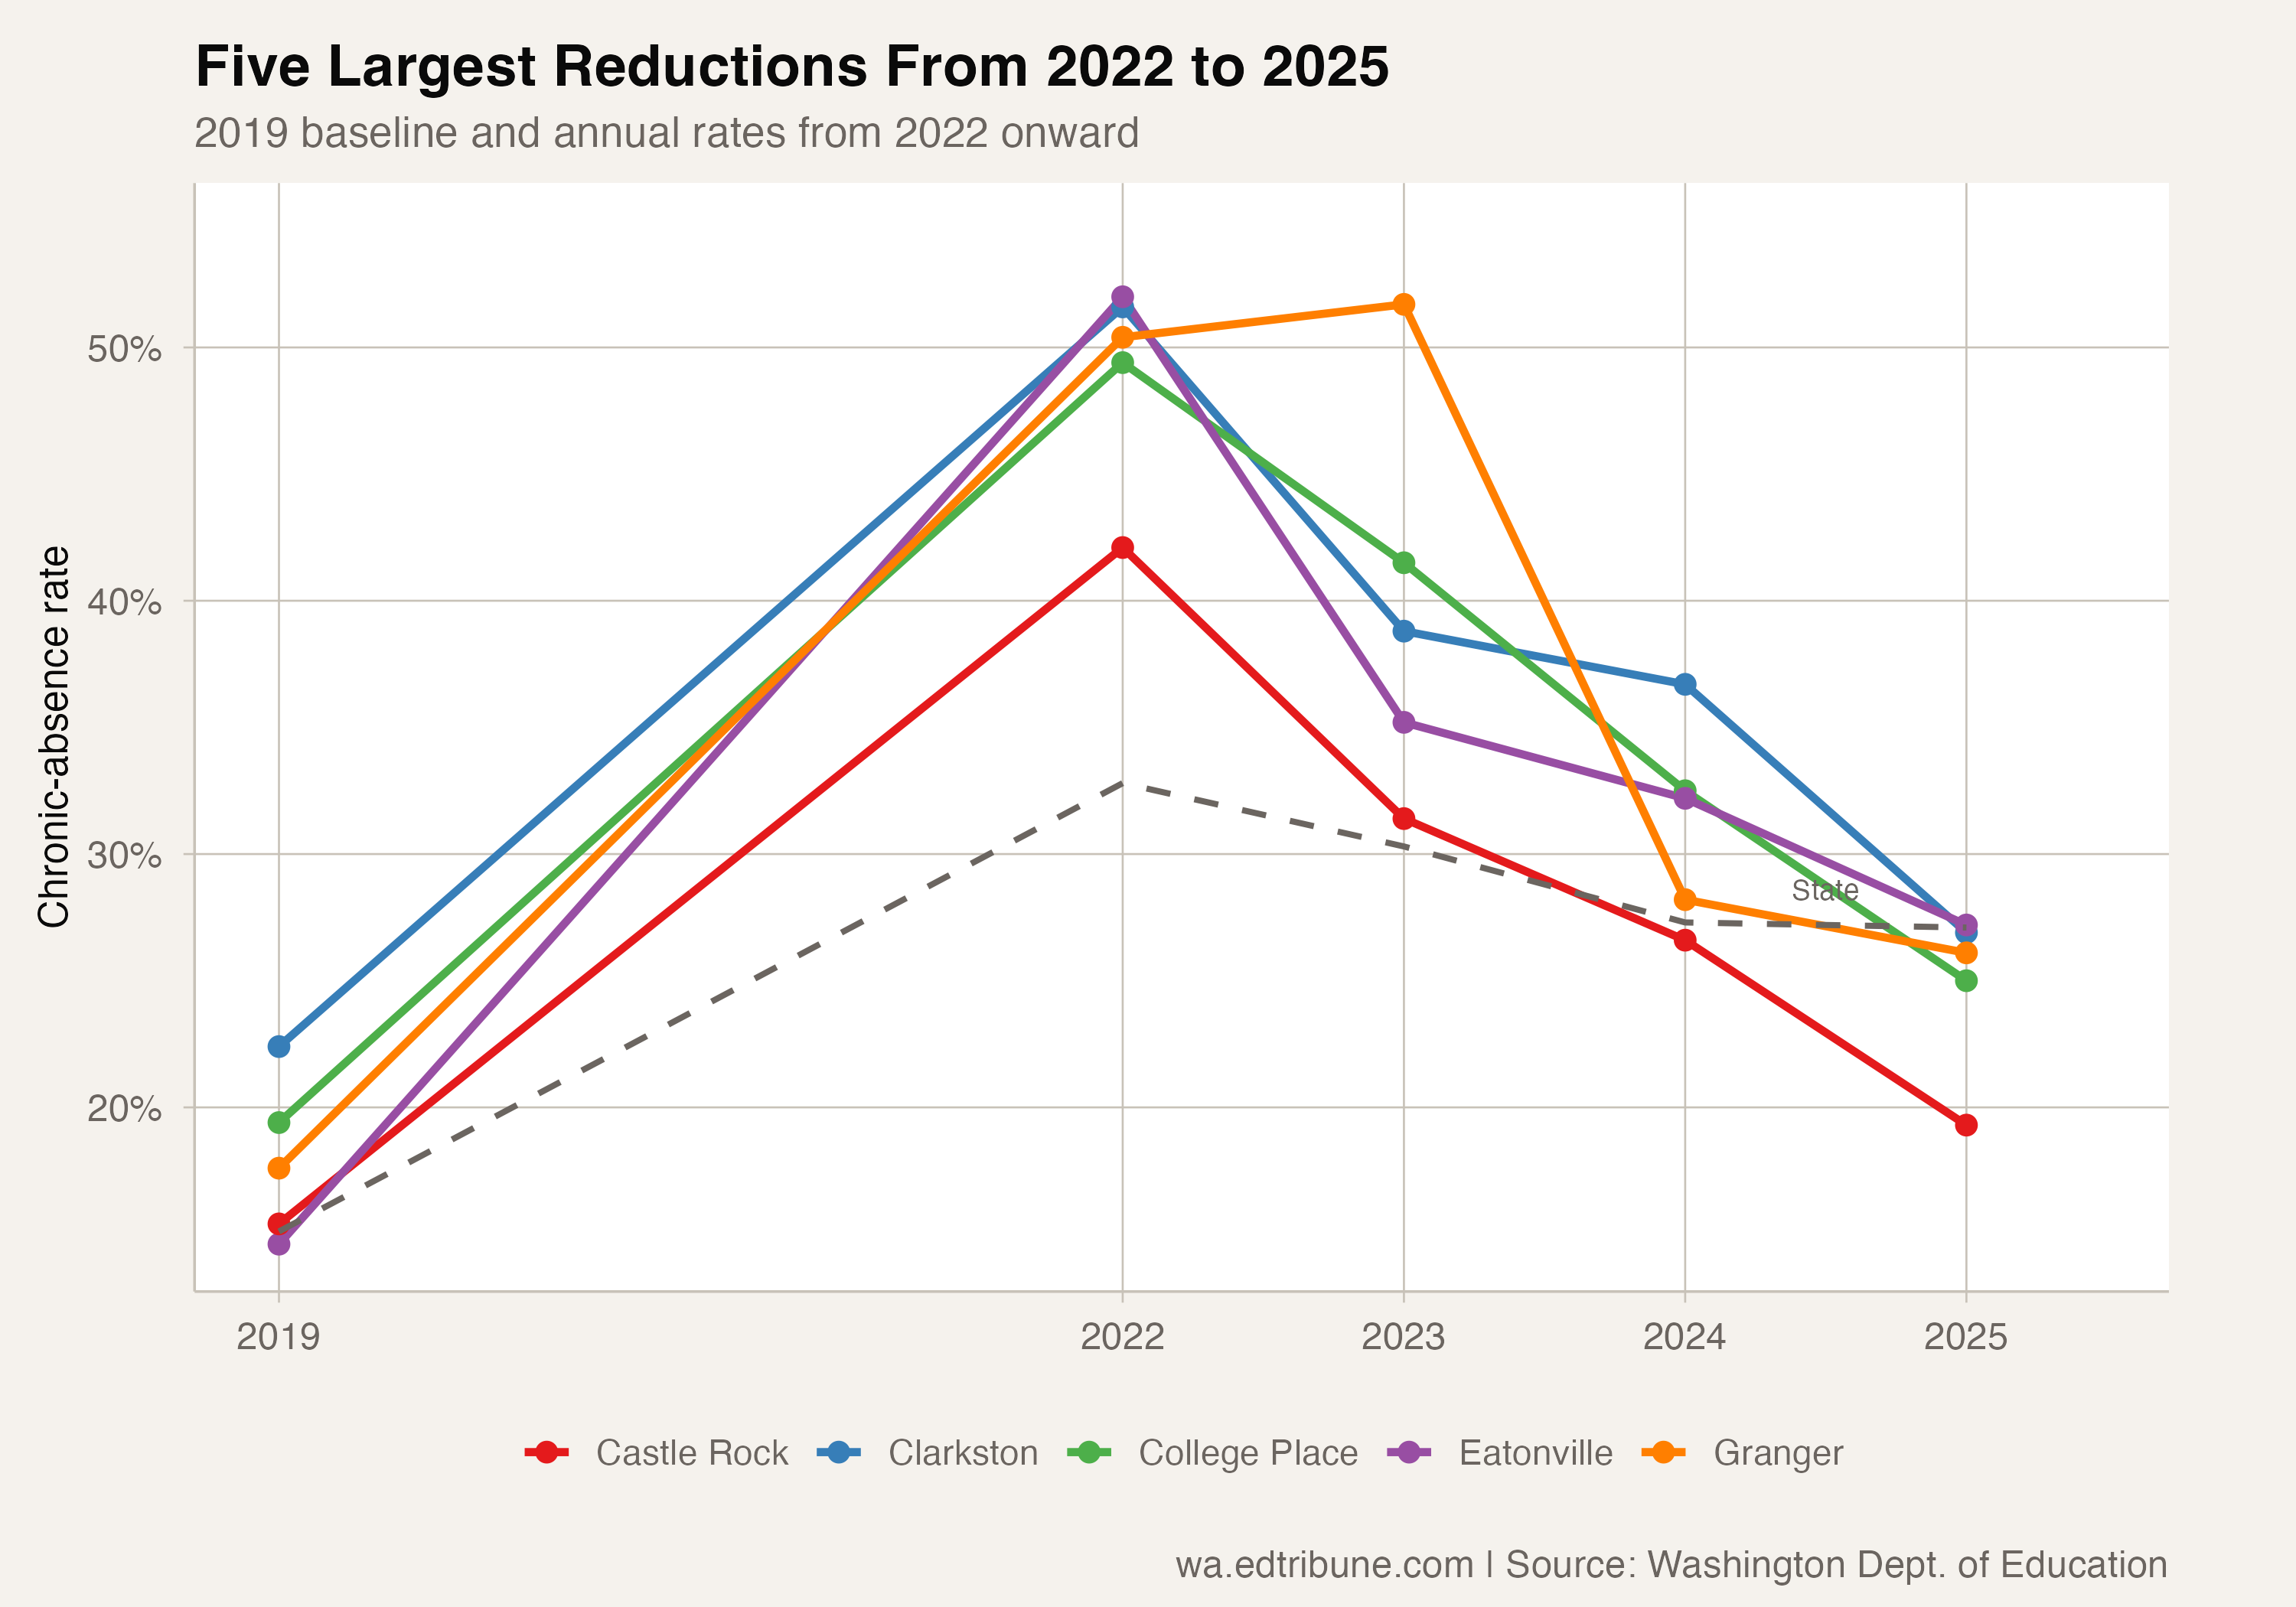
Nine of the 16 districts recorded a lower chronic-absence rate in each annual transition from 2022 through 2025. The analysis identifies the pattern but does not establish why rates changed.
What One District Says It Did
The data cannot say why any district's rate fell. College Place can, and Superintendent Jim Fry set out the district's account in writing when we sent him the draft before publication. What follows is the district's description of its own work. It is not something the attendance data establishes, and it is offered as one district's answer to a question the numbers leave open.
Fry asked first that the credit go elsewhere. Ambra Bryant, assistant principal at College Place High School, built the framework and presented it to the school board at the end of June 2026. "While reducing chronic absenteeism has truly been a team effort involving administrators, teachers, counselors, nurses, office staff, and community partners, Ambra developed and championed the systems that fundamentally changed how we approached attendance," Fry wrote. "She deserves tremendous credit for the progress we've made."
The district stopped letting each school run attendance its own way. It standardized definitions, attendance codes, excused-absence procedures and intervention protocols across every building, and audited its student information system so that students at athletics, field trips, testing and academic events were coded correctly rather than counted as absent. "Everyone was operating from the same playbook," Fry wrote.
Each school then formed an Attendance Coalition of administrators, counselors, teachers, specialists, office staff and data personnel. Weekly reports flag students with three unexcused absences in a rolling thirty-day period, three excused absences in the same window, excessive tardies, class skipping, and subgroup attendance trends. Each report triggers a defined intervention, which is the part that moves the work ahead of the problem rather than behind it.
The change Fry describes as the largest is a change in the question. The district moved from asking why a student was not coming to asking what barrier was preventing them from coming. Students sit for attendance barrier interviews, trusted adults are deliberately paired with students, and the intervention is chosen from the barrier the student named rather than the one the adults assumed. "That philosophical shift changed everything," he wrote.
Much of what surfaced was not about school at all. Fry writes that after the pandemic many families held a different view of when a child should stay home and for how long, and that part of the district's work became rebuilding parents' confidence that its nurses, counselors, mental health professionals and Communities In Schools staff could assess a child during the school day. The district began tracking patterns in chronic illness, mental health, menstrual health, sleep and recurring medical concerns so that teams could reach families before a barrier became a chronic absence.
It also went outside its own walls. College Place convened Community Engagement Boards with business owners, the mayor, law enforcement, court representatives, higher education, faith leaders and nonprofit organizations. Fry is explicit that these were never meant to be punitive, and were built around coordinating resources and shared plans for individual students.
He is equally explicit that none of it is finished. "Perhaps the biggest lesson we learned is that attendance work is never finished," he wrote, describing letters, attendance contracts and barrier forms that keep being rewritten as the district learns more. The belief underneath it, in his words: "every student deserves to be in school every day, and it is our collective responsibility to identify and remove the barriers that stand in the way."
College Place cut its chronic-absence rate 24.6 percentage points over the three years, the second-largest reduction among the 16 districts. The other 15 have their own accounts, and we have not asked them all.
Still Above Pre-Pandemic
15 of the 16 districts remained above their 2019 rates in 2025. The exception is Newport, whose published 2025 rate of 26.3% was below its 2019 rate of 28.0%. That 2025 figure counts students in Newport Home Link, a program whose attendance the state does not publish by school. Across Newport's schools that do publish counts, the 2025 rate was 29.4%, still above 2019. Castle Rock's rate was 15.3% in 2019, 42.0% in 2022, and 19.3% in 2025. Eatonville's rate was 14.5% in 2019, 51.9% in 2022, and 27.2% in 2025.
Washington's statewide rate was 15.1% in 2019. Its 5.5-point reduction from 2022 to 2025 recovered 31.1% of the increase between 2019 and 2022. 12 of the 16 selected districts recovered more than half of their own increase over the same years.
The screen captures a substantial reduction from the 2022 peak. The 2019 comparison shows that, for nearly every district in the group, it was not yet a return to the earlier baseline.
Detailed code that reproduces the analysis and figures in this article is available exclusively to EdTribune subscribers.
Discussion
Sign in to join the discussion.
Loading comments...