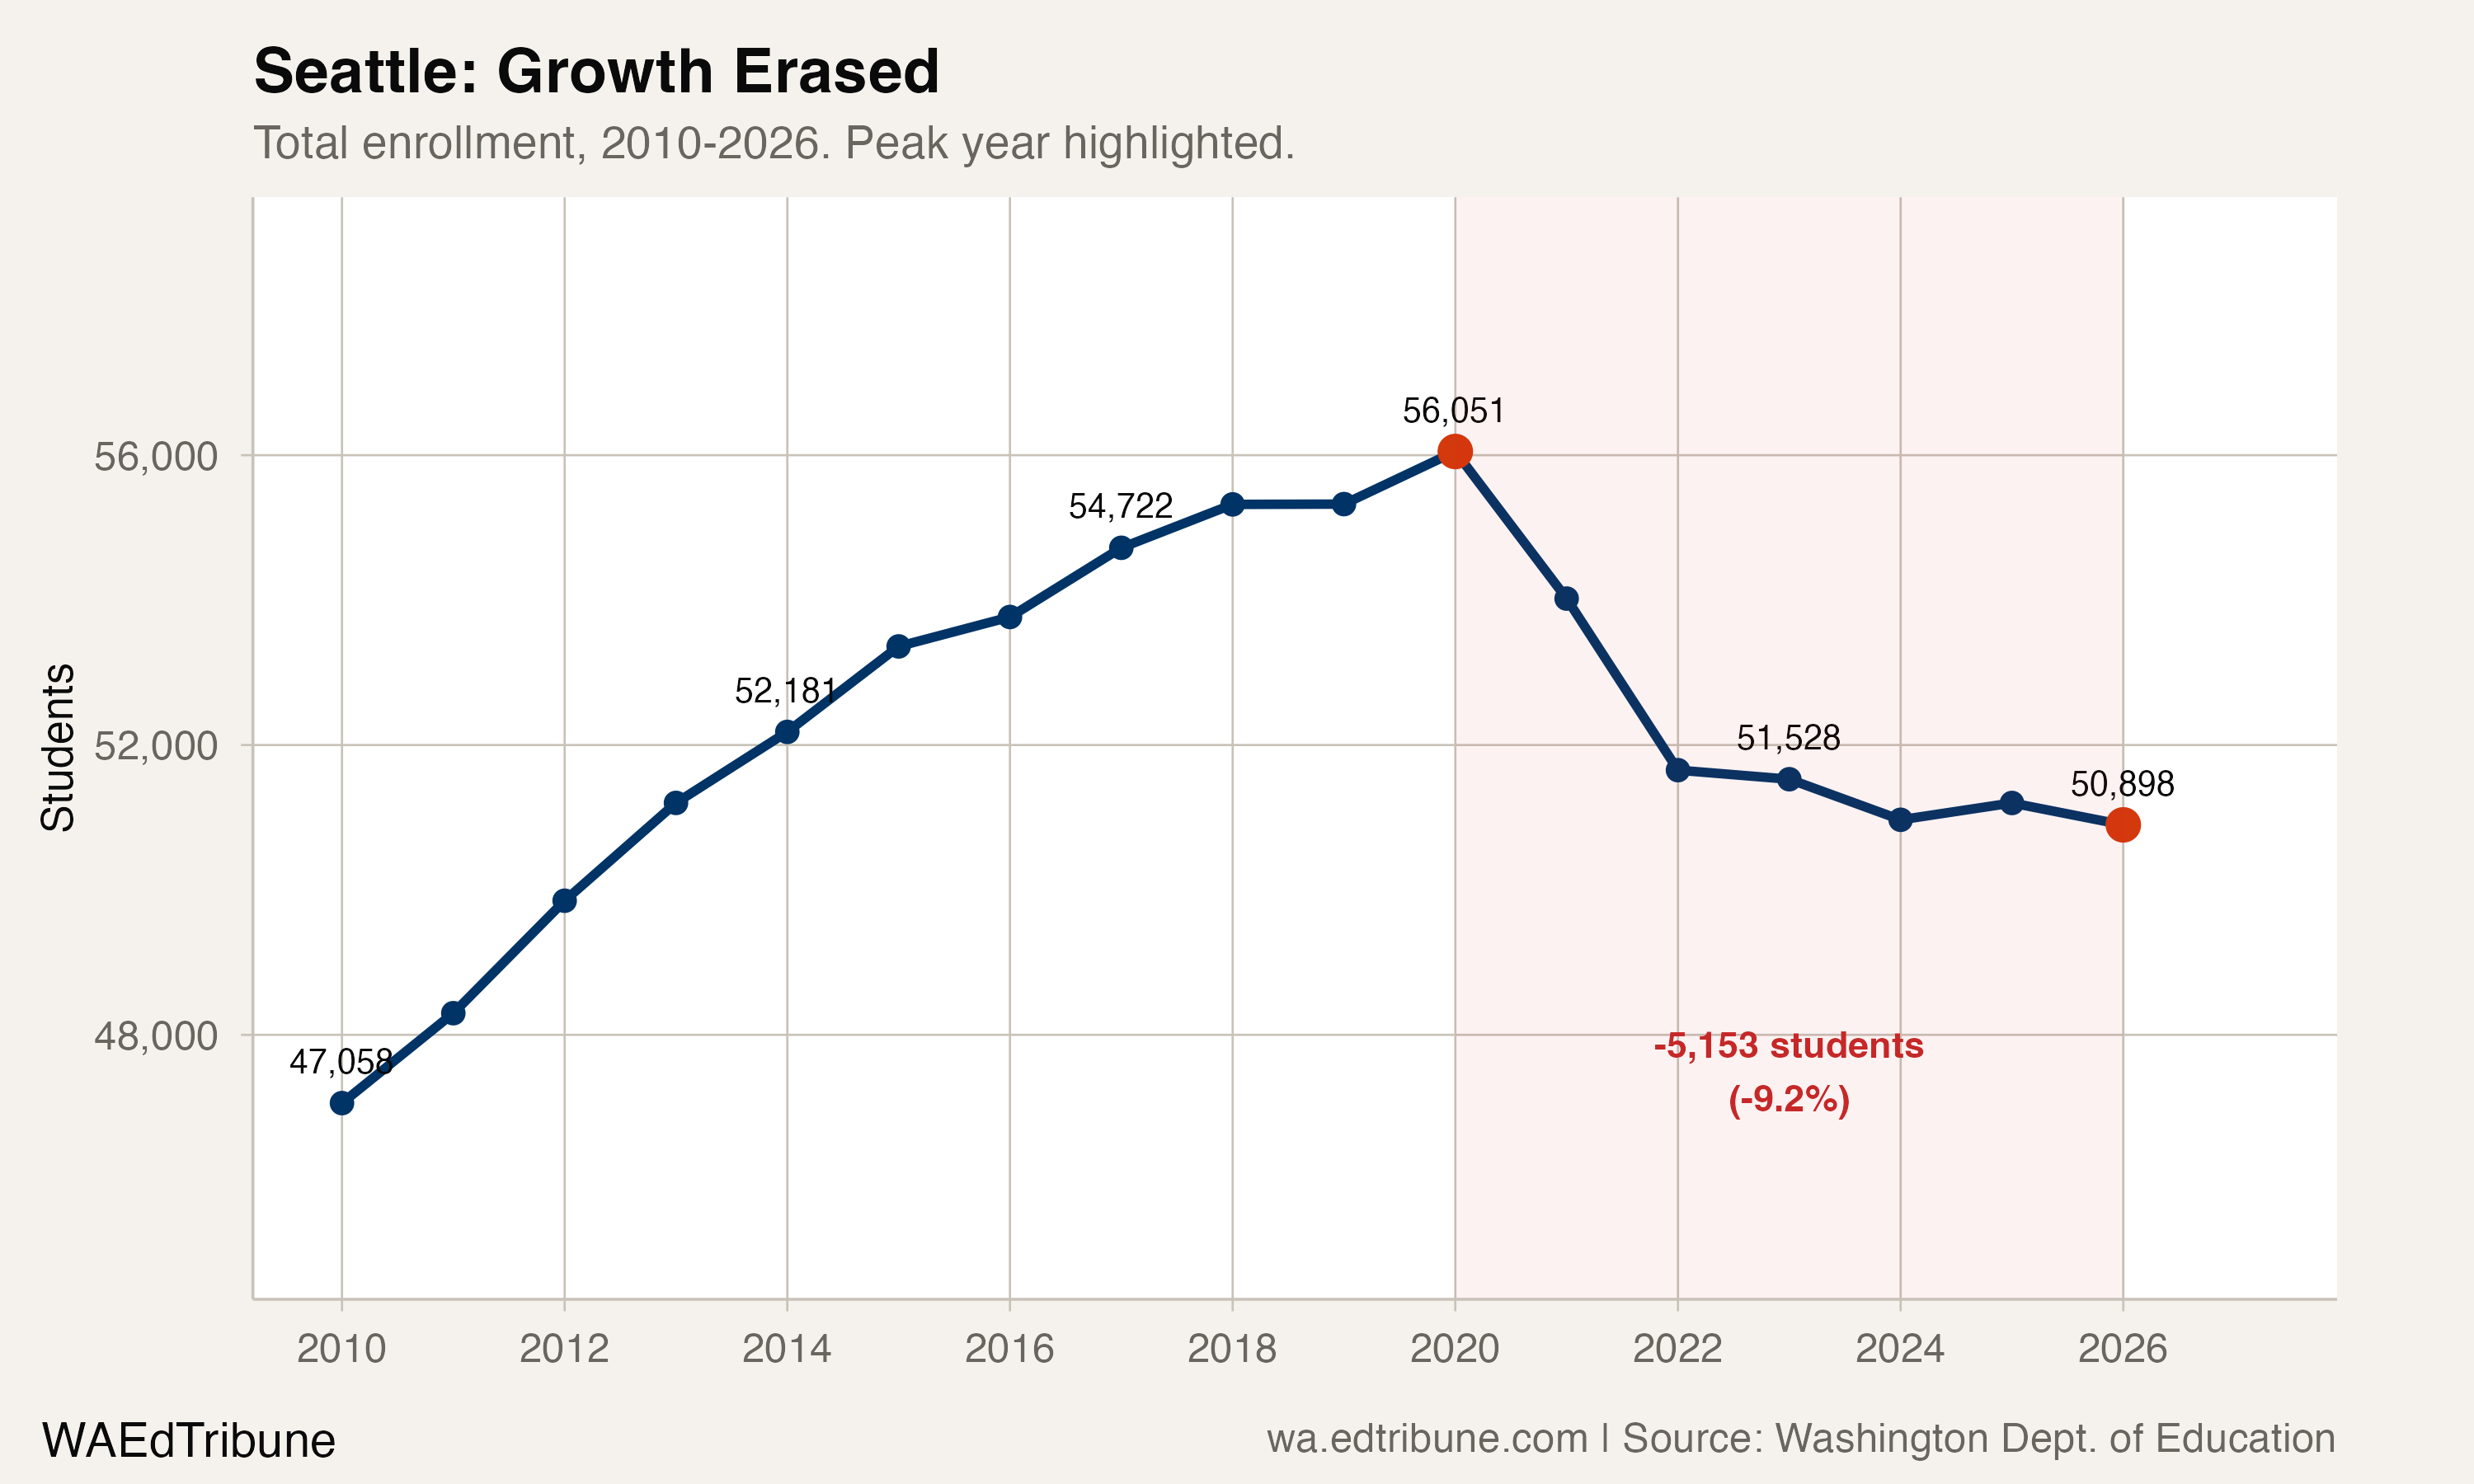
Between 2010 and 2020, Seattle Public Schools↗ET did something almost no large urban district in the country managed: it grew. Not modestly. The district added 8,993 students over a decade, swelling from 47,058 to 56,051, a 19.1% expansion driven by the same tech-fueled population boom that was remaking the city's skyline.
Then the boom ended. Since that 2020 peak, Seattle has shed 5,153 students, a 9.2% decline that has now erased more than half the decade's gains. The district enrolled 50,898 students in 2025-26, its lowest count since 2012. And unlike the pandemic crash that hit every district in 2020-21, this decline has continued year after year, through recovery and reopening, with no floor in sight.
The result is a district caught between a building portfolio designed for 56,000 students and a budget that can support fewer than 51,000.
The growth era and its collapse
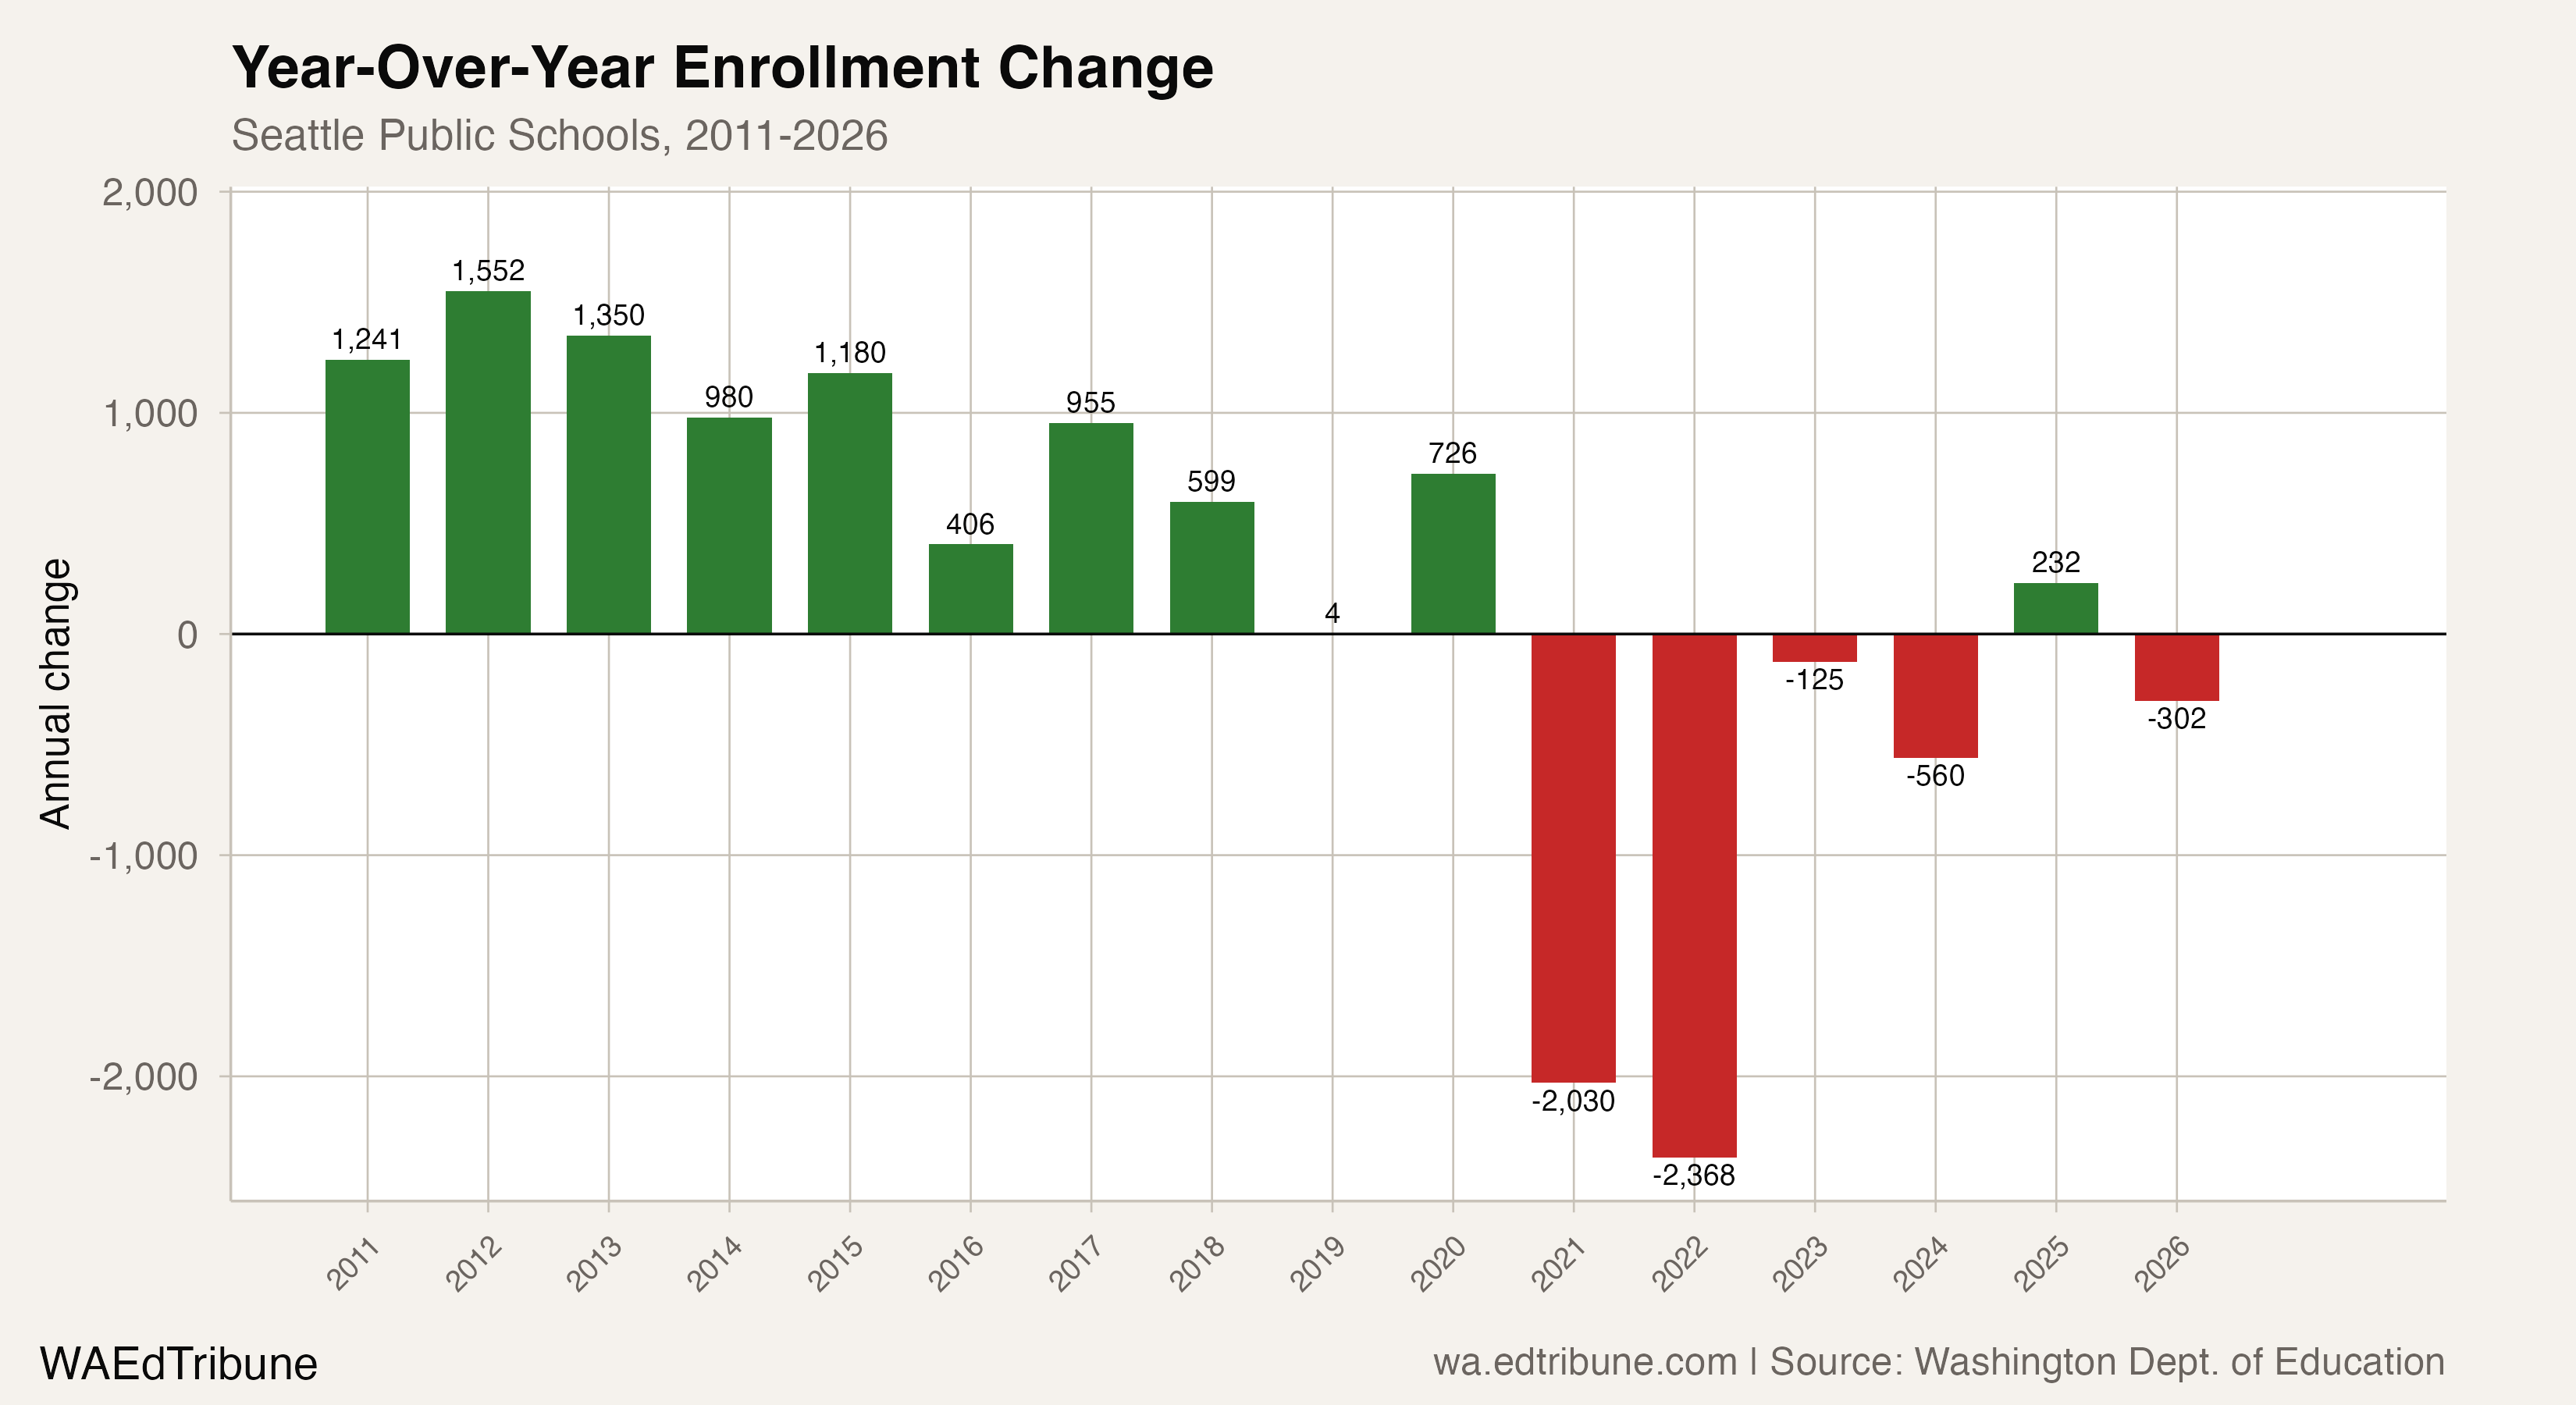
The trajectory splits cleanly at 2020. For 10 consecutive years, from 2011 through 2020, Seattle gained students every single year. The gains ranged from a modest four students in 2019 to 1,552 in 2012. The growth coincided with Seattle's emergence as a global tech hub: Amazon's headcount in the city quintupled, median home prices nearly doubled, and young professionals flooded neighborhoods that had been slowly graying.
The COVID year broke the streak. Seattle lost 2,030 students in 2020-21, then another 2,368 in 2021-22, the steepest single-year decline in the dataset. A brief stabilization in 2022-23 (a loss of just 125) and a small rebound in 2024-25 (+232) briefly suggested the worst had passed. It had not. The district lost another 302 students in 2025-26.
| Year | Enrollment | Change | Pct |
|---|---|---|---|
| 2010 | 47,058 | — | — |
| 2014 | 52,181 | +980 | +1.9% |
| 2017 | 54,722 | +955 | +1.8% |
| 2020 | 56,051 | +726 | +1.3% |
| 2021 | 54,021 | -2,030 | -3.6% |
| 2022 | 51,653 | -2,368 | -4.4% |
| 2025 | 51,200 | +232 | +0.5% |
| 2026 | 50,898 | -302 | -0.6% |
The 2024-25 uptick now looks like noise, not a turning point. Across the full six-year decline, Seattle's net loss of 5,153 students represents 57.3% of the 8,993 it gained over the preceding decade.
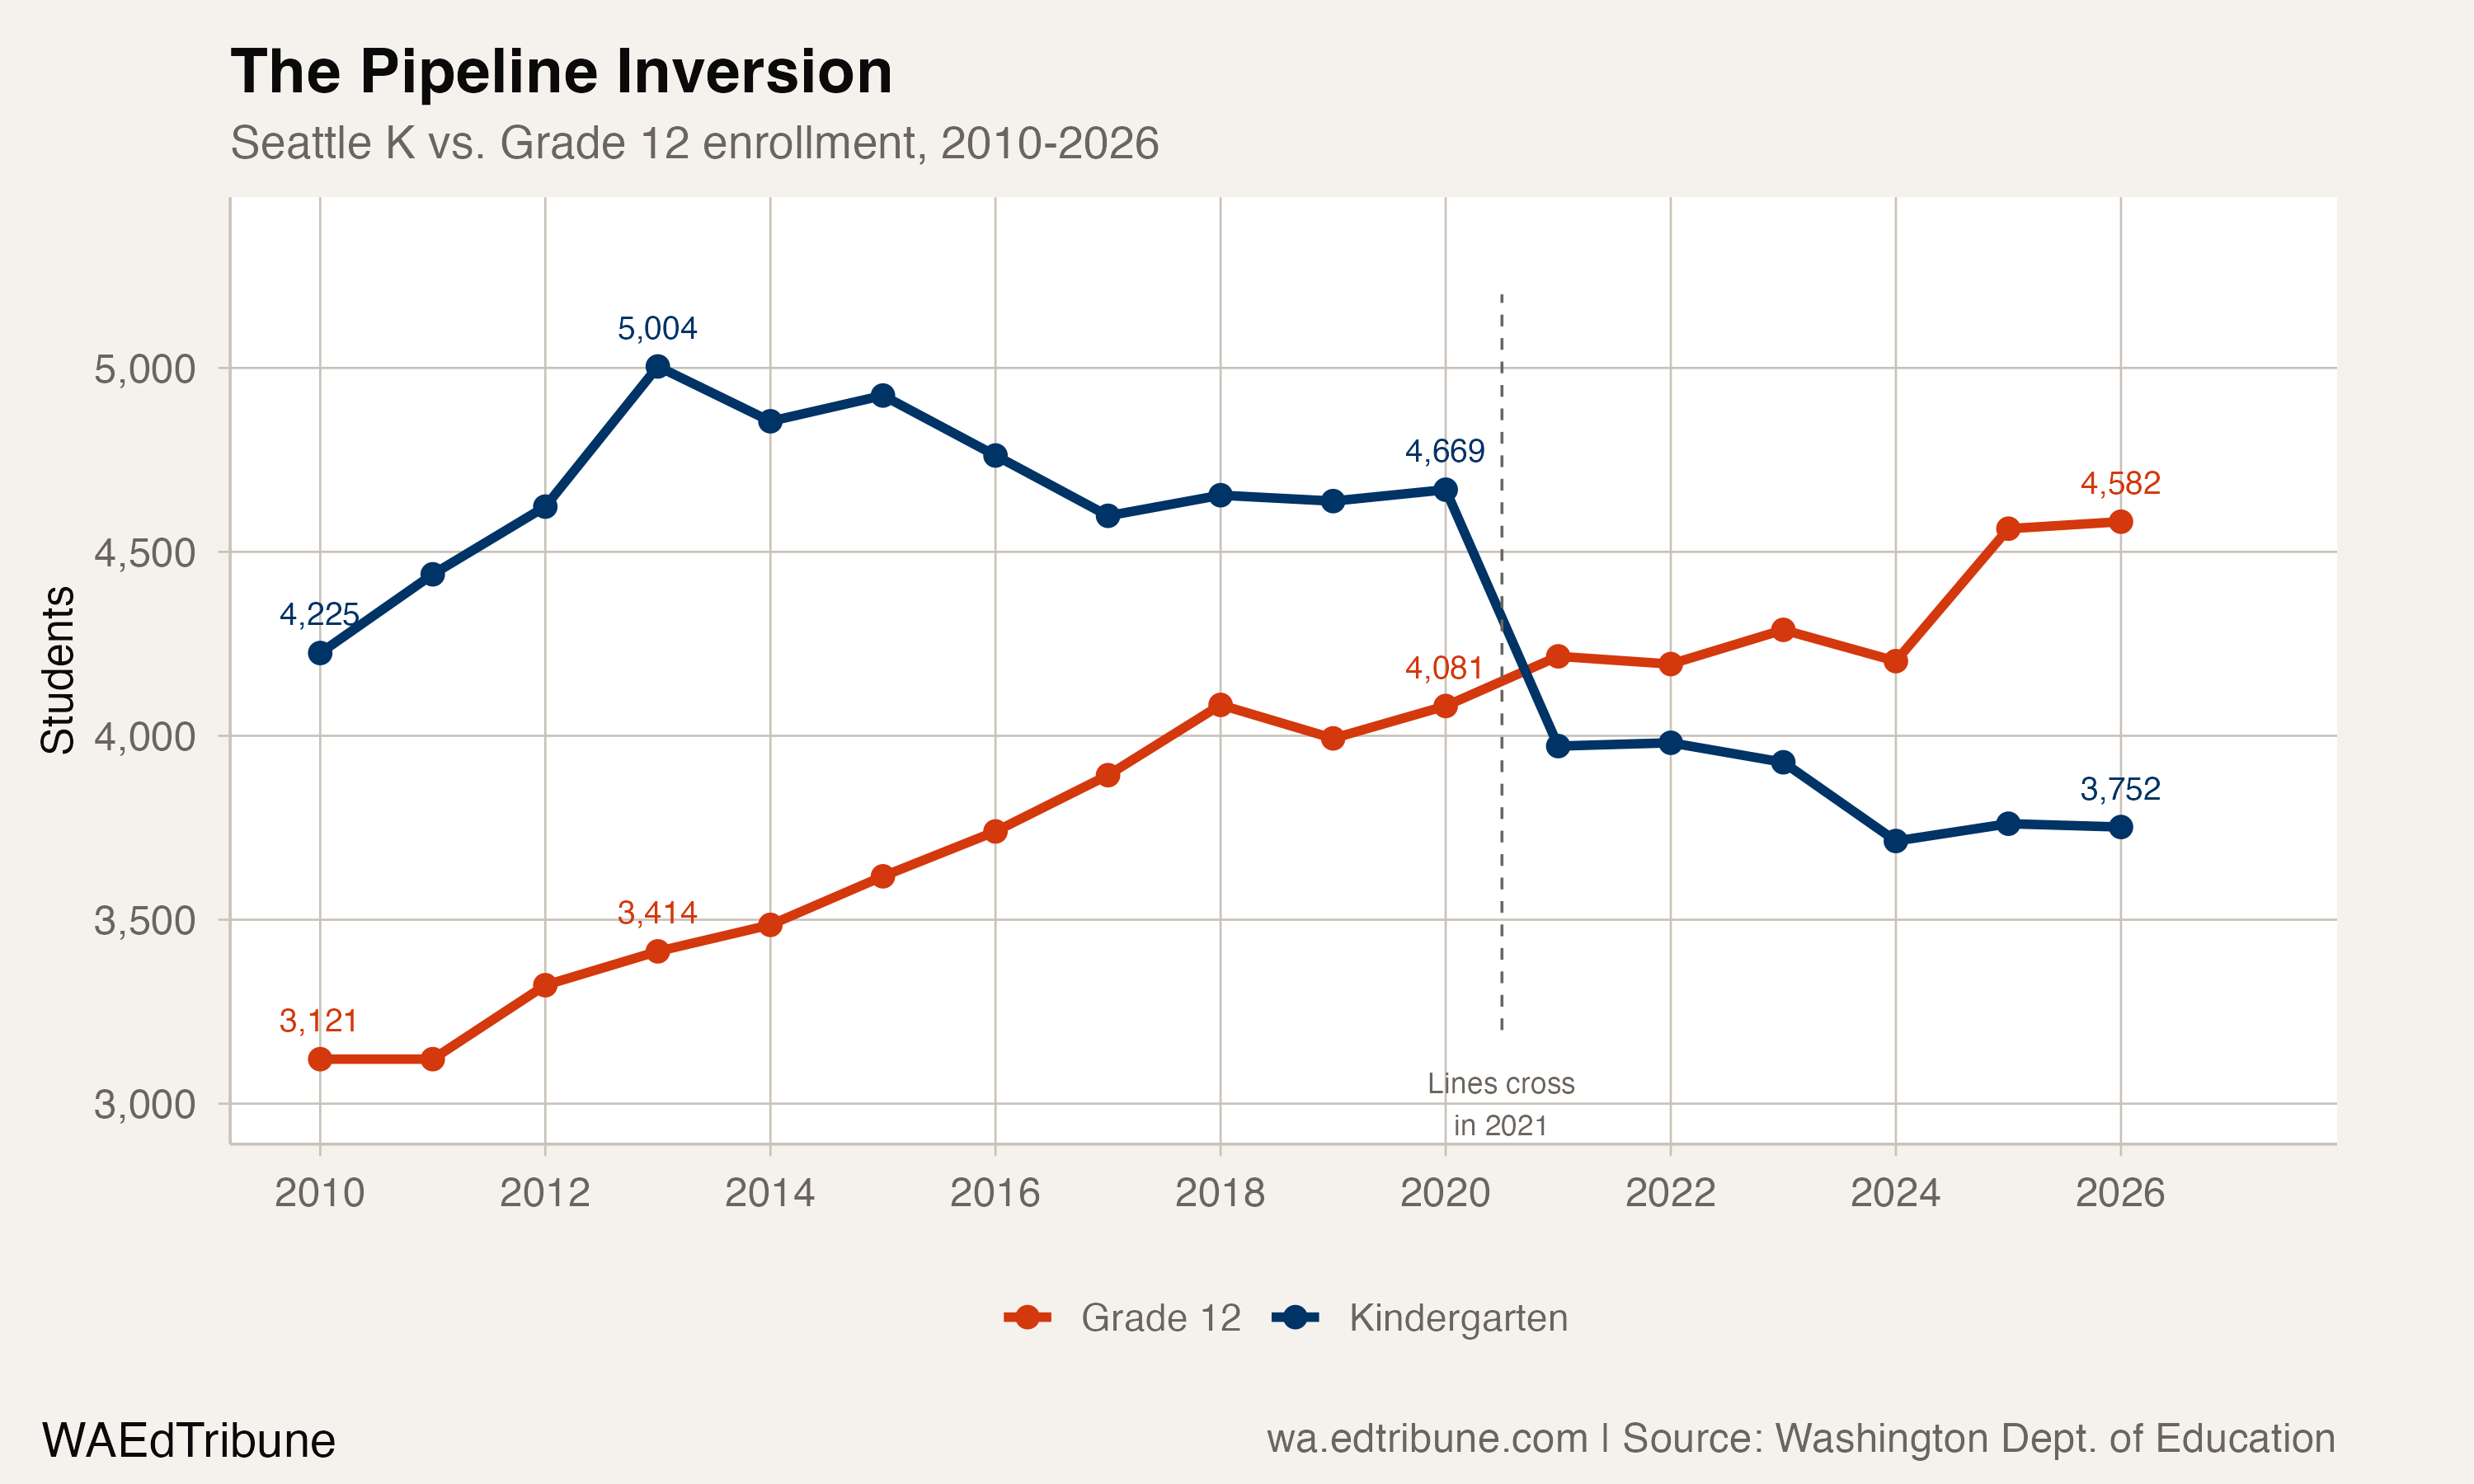
A pipeline running dry
The clearest signal that Seattle's decline is structural, not cyclical, sits in the kindergarten numbers. In 2013, Seattle enrolled 5,004 kindergartners, the peak for the 17-year data window. By 2026, that figure had fallen to 3,752, a 25.0% drop. Over the same span, grade 12 enrollment rose from 3,414 to 4,582, a 34.2% increase.
The kindergarten-to-twelfth-grade ratio tells the story in a single number. In 2013, Seattle enrolled 1.47 kindergartners for every senior. In 2026, it enrolled 0.82. The district now graduates more students than it takes in at the front door.
Fred Podesta, the district's former chief operations officer, put it bluntly in 2024:
"The biggest factor in the district's enrollment decline is that the incoming kindergarten class is smaller than the outgoing 12th-grade class." — The Seattle Times, 2024
Podesta also noted that Seattle's "market share of new kids is not the same as it used to be," meaning the district is capturing a shrinking fraction of King County births. Families are relocating before their children reach school age due to housing costs, transferring to online schooling, or choosing private alternatives.
Who left
The demographic breakdown of Seattle's losses since 2020 reveals a lopsided pattern. White students account for the largest absolute decline: 3,578 fewer white students, a 13.7% drop from 26,060 to 22,482. Asian enrollment fell by 1,228 (-16.5%), and Black enrollment dropped by 551 (-6.8%).
Hispanic enrollment moved in the opposite direction, growing by 518 students (+7.2%) even as the district shrank overall. Hispanic students now make up 15.2% of Seattle's enrollment, up from 11.7% in 2010. Multiracial enrollment dipped by 336.
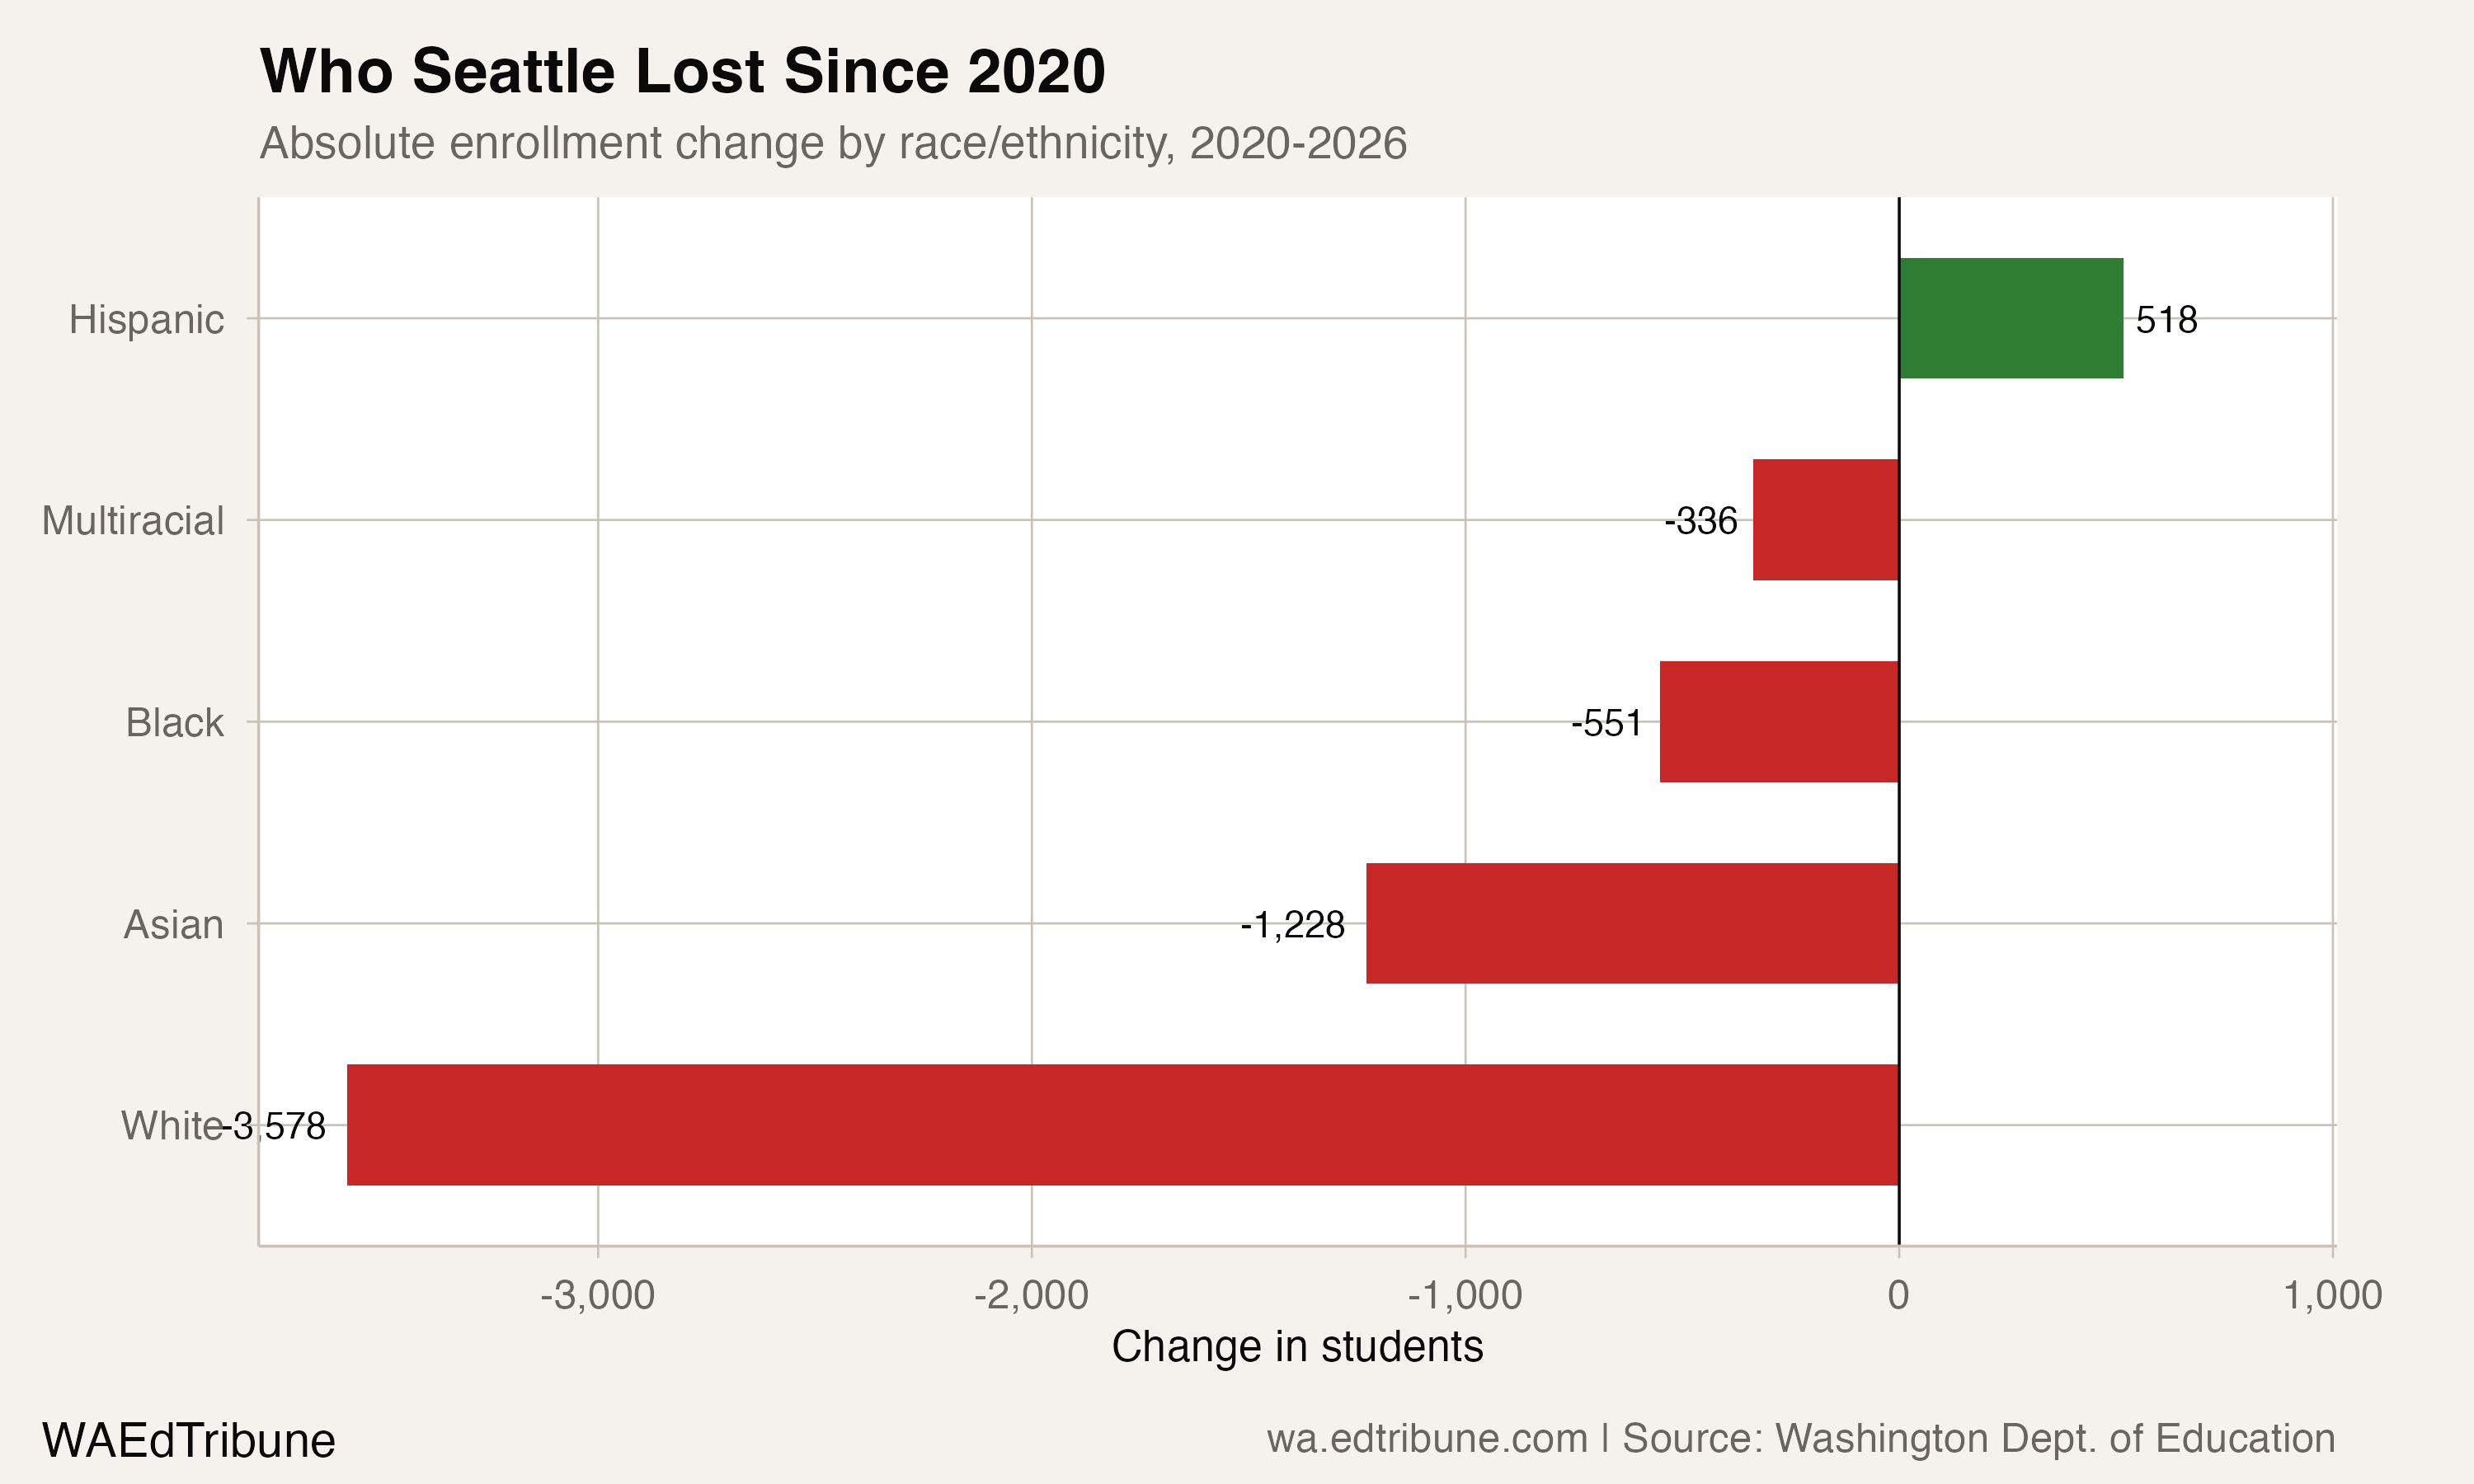
White students made up 46.5% of Seattle's enrollment at the 2020 peak. That share has fallen to 44.2% in 2026, but remains the plurality. The losses track with the broader pattern across Washington, where white enrollment has declined statewide by more than 140,000 students since 2010.
Losing ground among peers
Seattle's 9.2% enrollment decline since 2020 is the steepest among Washington's eight largest districts. Kent↗ET lost 7.5%, Tacoma↗ET 5.7%, Spokane↗ET 5.3%. Even Lake Washington↗ET, the Eastside suburban district that competes directly with Seattle for families, lost only 4.2%. Puyallup↗ET, the most insulated from Puget Sound housing pressures, lost just 1.5%.
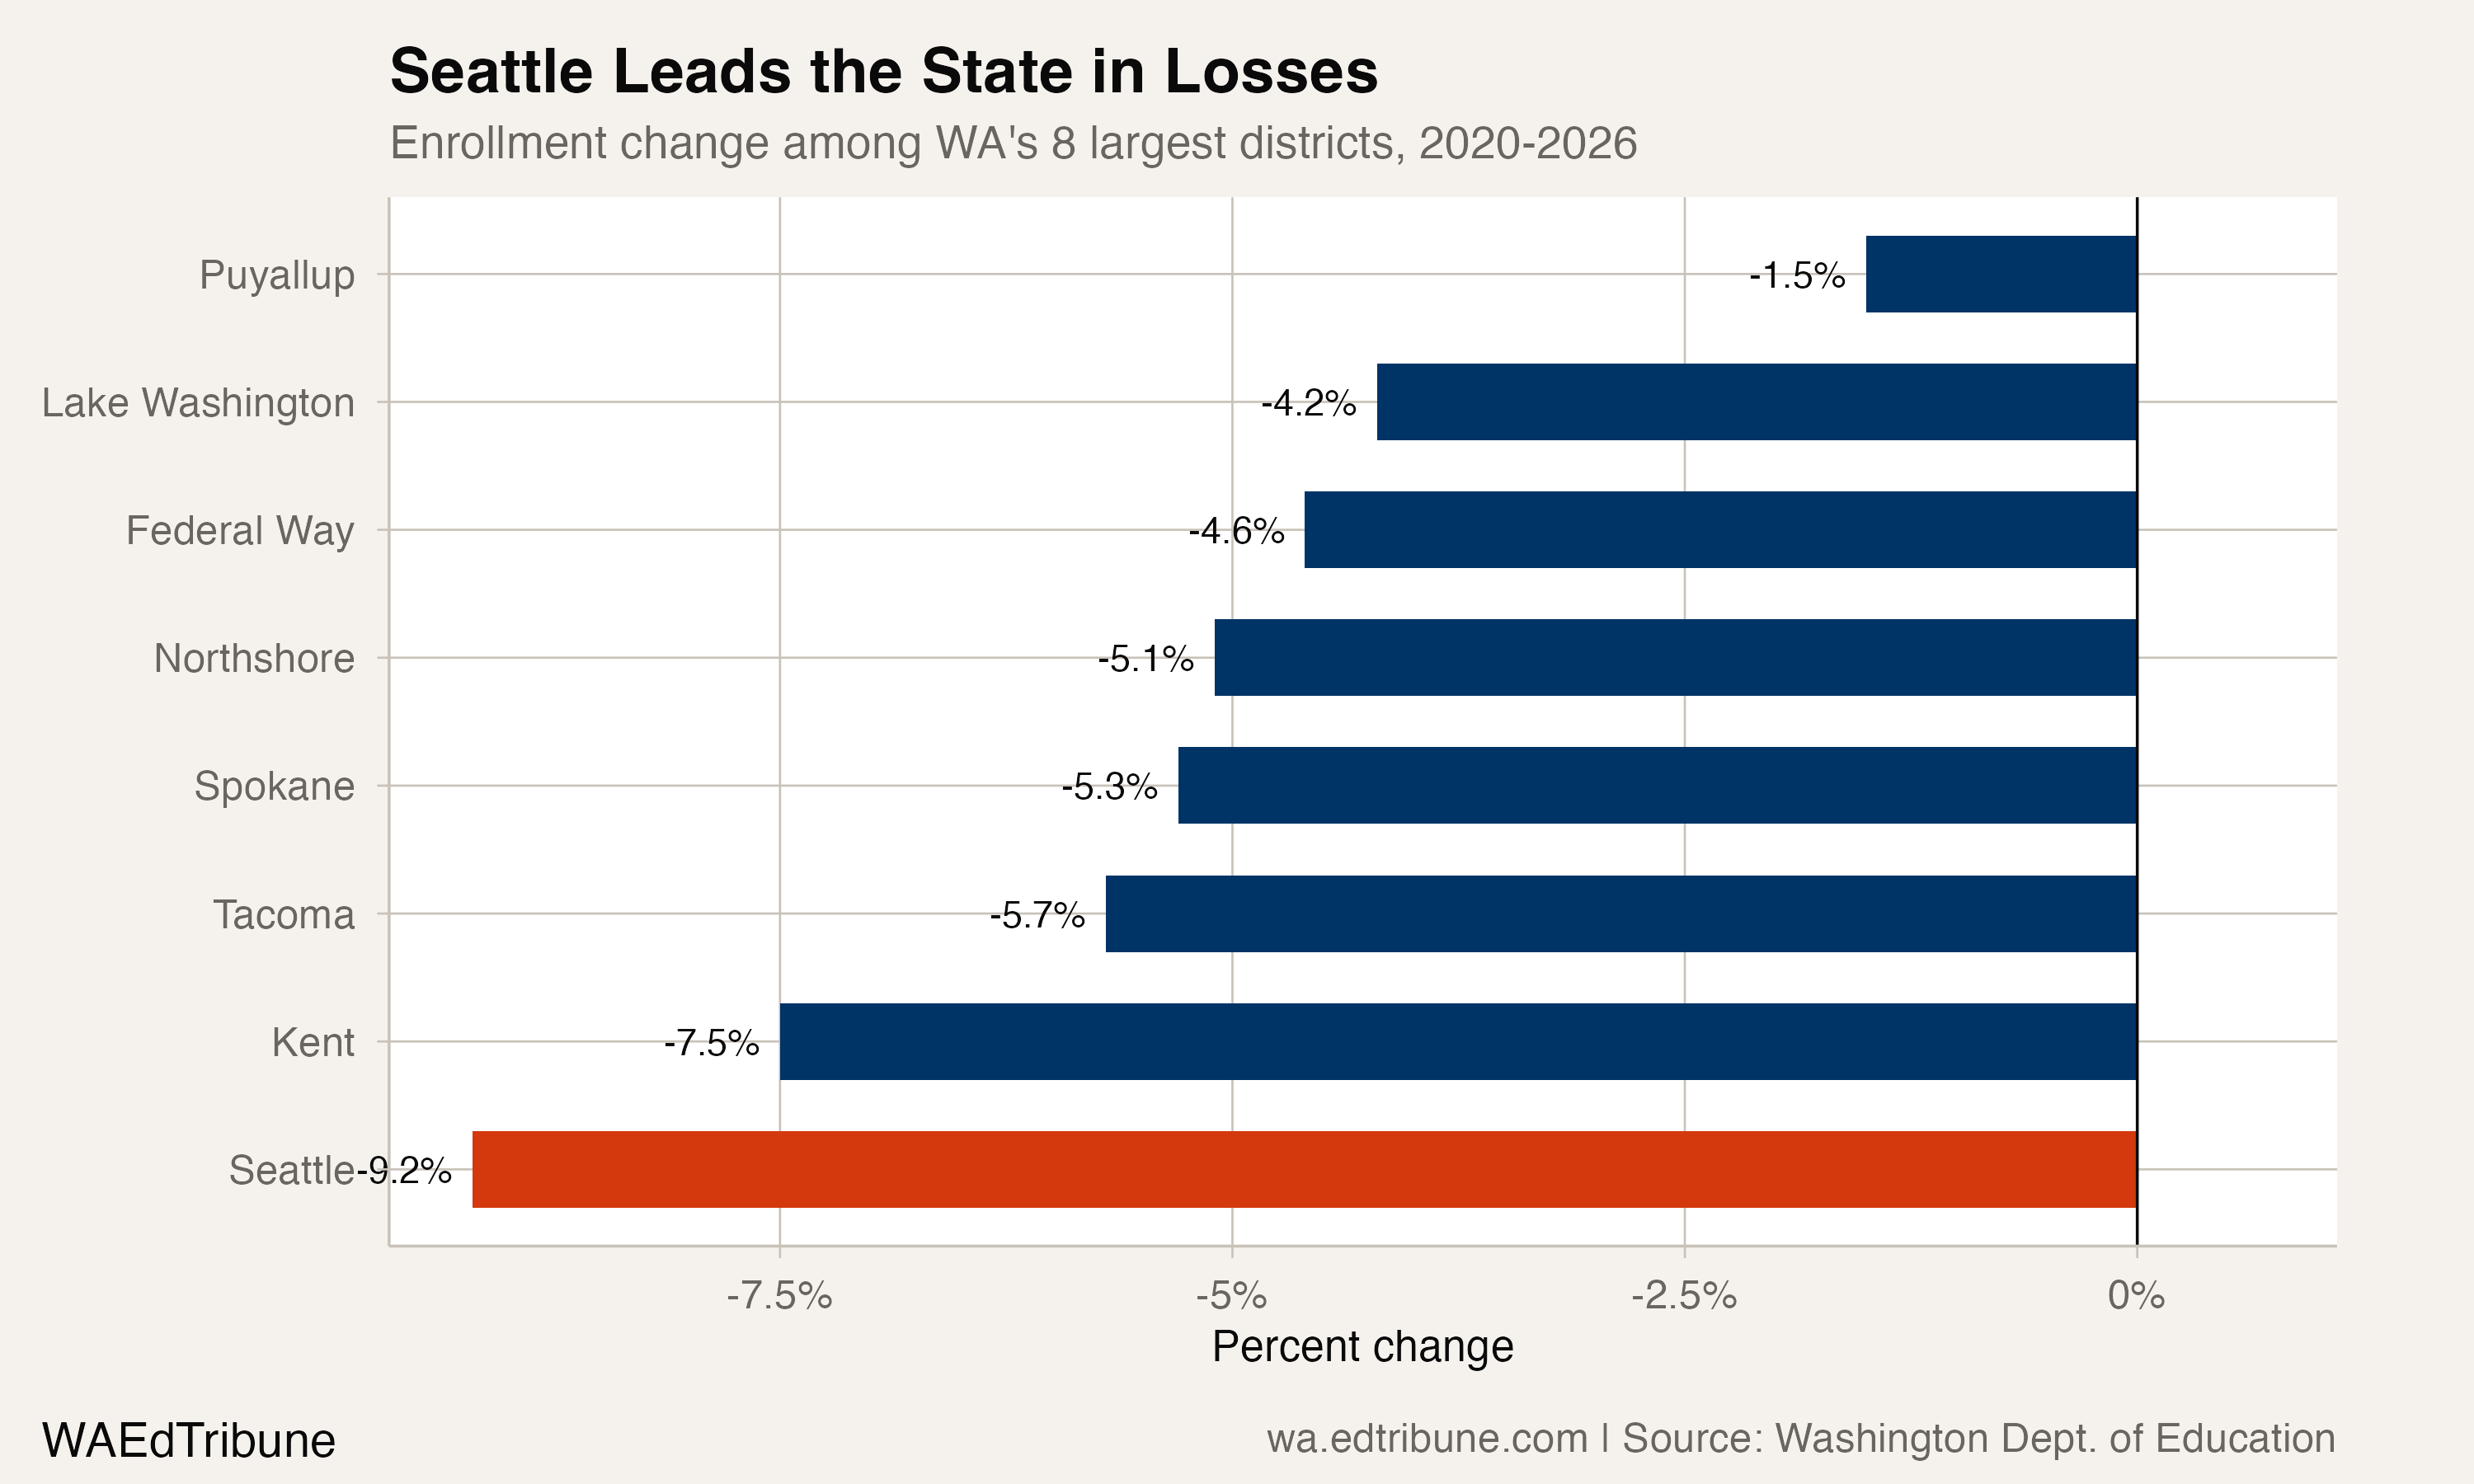
Every large district in the state is shrinking, but Seattle is shrinking fastest, both in absolute terms (5,153 students) and as a percentage of its 2020 base. The district's share of statewide enrollment has slipped from 4.9% to 4.6%, a small but steady erosion.
The fiscal squeeze
The enrollment decline has opened a budget gap that the district has struggled to close. Seattle Public Schools projected a $94 million shortfall for 2024-25, driven by lost per-pupil revenue and the expiration of federal pandemic relief funds.
In September 2024, Superintendent Brent Jones proposed closing as many as 21 schools. That number was scaled back to five, then four elementary schools: North Beach, Sacajawea, Stevens, and Sanislo. Critics pointed out the closures would save only $2.7 million, a fraction of the deficit. In November 2024, the school board voted to withdraw the proposal entirely.
The problem has not gone away. For 2026-27, the district faces an $87 million shortfall and has proposed a hiring freeze, further central office cuts, and mandatory pay-to-play athletic fees of $150 to $550 per student. Newly appointed Superintendent Ben Shuldiner signaled that school closures remain a future possibility:
"Everything needs to be on the table. You don't want me to be your superintendent and then pretend like there's all these things that we can't touch." — KOMO News, 2026
Meanwhile, the special populations the district serves have held steady or grown. English learner enrollment rose 7.4% since 2020, from 7,001 to 7,518 students. Special education enrollment remained essentially flat at 8,779. The instructional programs these students receive carry higher per-pupil costs, and their stability means the district cannot cut proportionally as enrollment falls.
The question the numbers dodge
The enrollment numbers establish the pattern but not its full cause. A district-commissioned enrollment decline study funded by a $100,000 state grant found that housing affordability and family displacement are major drivers, but the data cannot distinguish between families who left Seattle for cheaper suburbs, families who switched to private or online schools, and families who simply never had children in the first place.
The share of the Seattle metro population under age 5 has been declining for nearly two decades. The number of households with children in Seattle fell 16% since 2017, with nearly 70% of departing families moving out of state entirely. That suggests the losses are not being recaptured by neighboring districts. They are leaving the region.
The kindergarten pipeline guarantees continued losses for years. The 2026 kindergarten class of 3,752 is 917 fewer students than the 2020 class. Those smaller cohorts will work through the system grade by grade, each year producing a graduating class larger than the entering one. Unless birth rates reverse or Seattle becomes dramatically more affordable for families, the math is unambiguous. Seattle Public Schools built for growth. Now it must plan for something else.
Detailed code that reproduces the analysis and figures in this article is available exclusively to EdTribune subscribers.
Discussion
Sign in to join the discussion.
Loading comments...