Correction (October 11, 2026): OSPI revised its published 2025-26 enrollment file after this article ran, and the revised file reverses one of its findings. Section 504 plans did not fall by 6,440 in 2025-26; they rose by 2,715, to 63,548 students, or 5.8% of enrollment, about 1 in 17 rather than 1 in 20. Bainbridge Island's rate is 18.4% and Federal Way's is 3.6%, a fivefold gap rather than sixfold. The article's correlation between poverty and 504 rates was computed on a measure Washington does not publish; it now uses the free or reduced-price lunch rate and is -0.69. We have rewritten the section on 2025-26 accordingly.
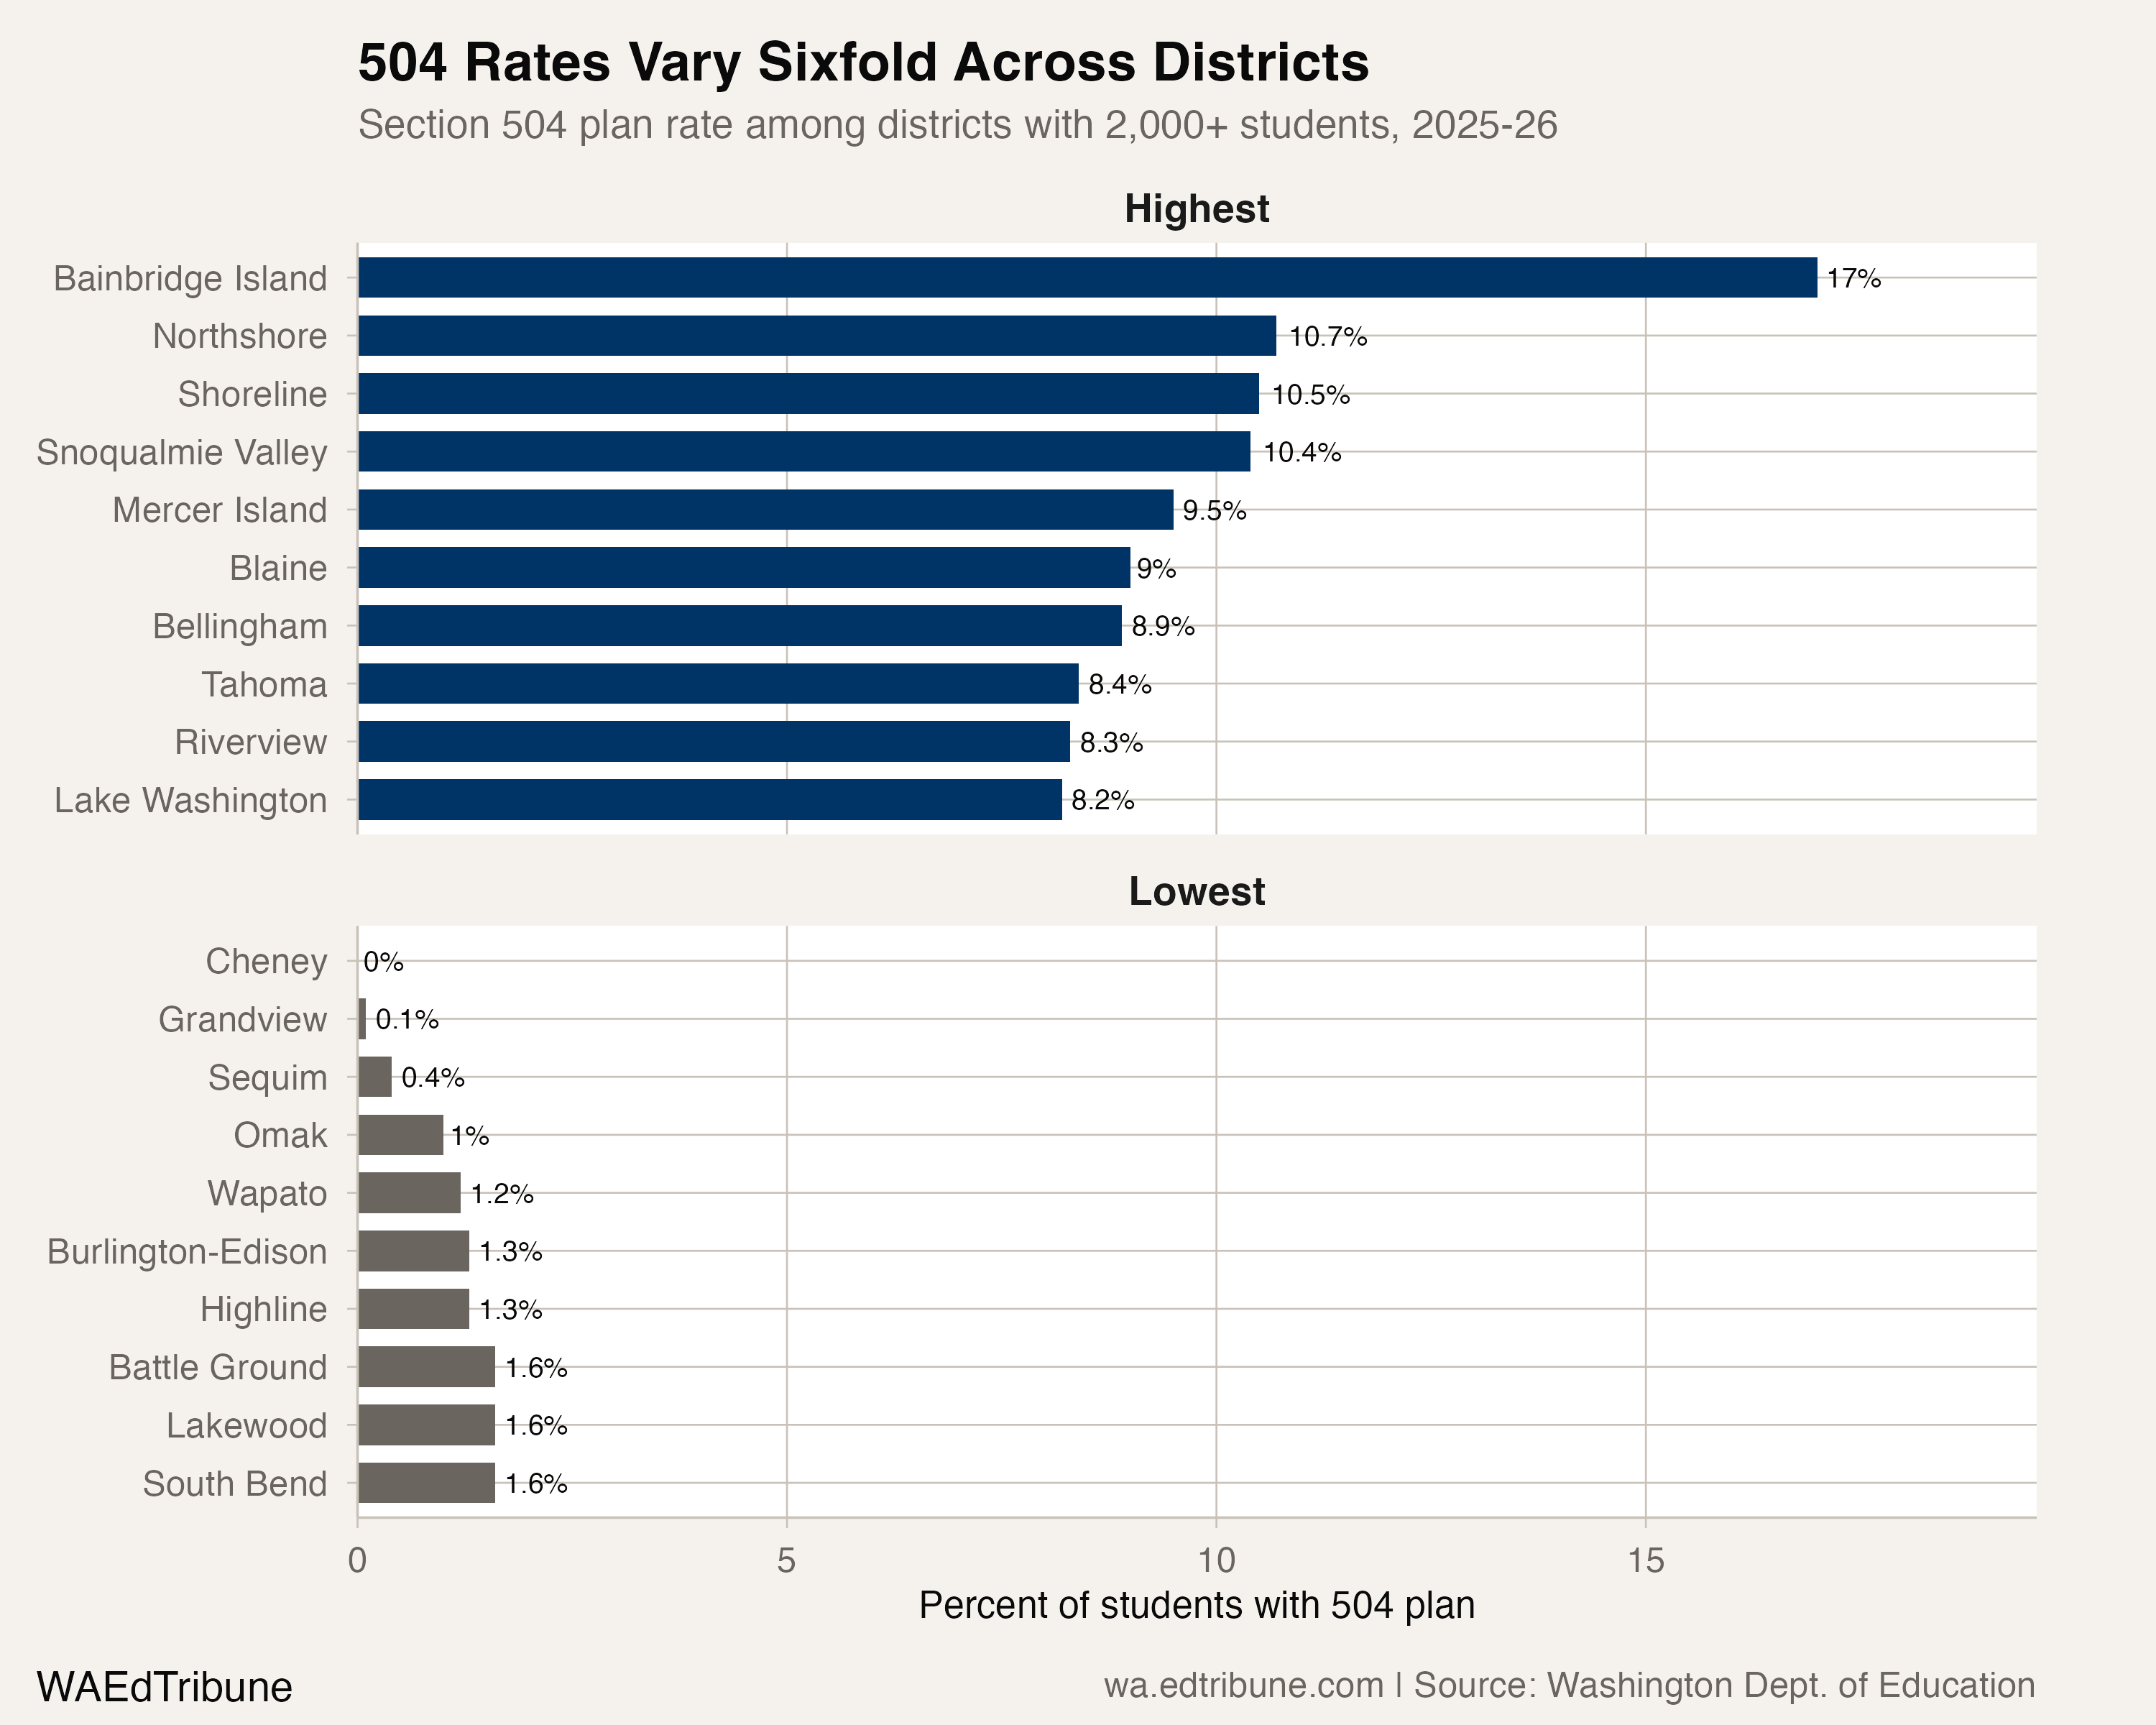
On Bainbridge Island, 18% of public school students have a Section 504 disability accommodation plan. In Federal Way↗ET, about thirty miles to the southeast and serving a student body more than six times as large, the rate is 3.6%.
Both districts operate under the same federal law. Both serve students with ADHD, anxiety, diabetes, and other conditions that can substantially limit a major life activity. The enrollment data cannot measure disability prevalence directly, only identification rates. But a fivefold gap between neighboring districts points less to differences in how many students have disabilities than to differences in who gets evaluated and who gets the paperwork that converts a diagnosis into a classroom accommodation.
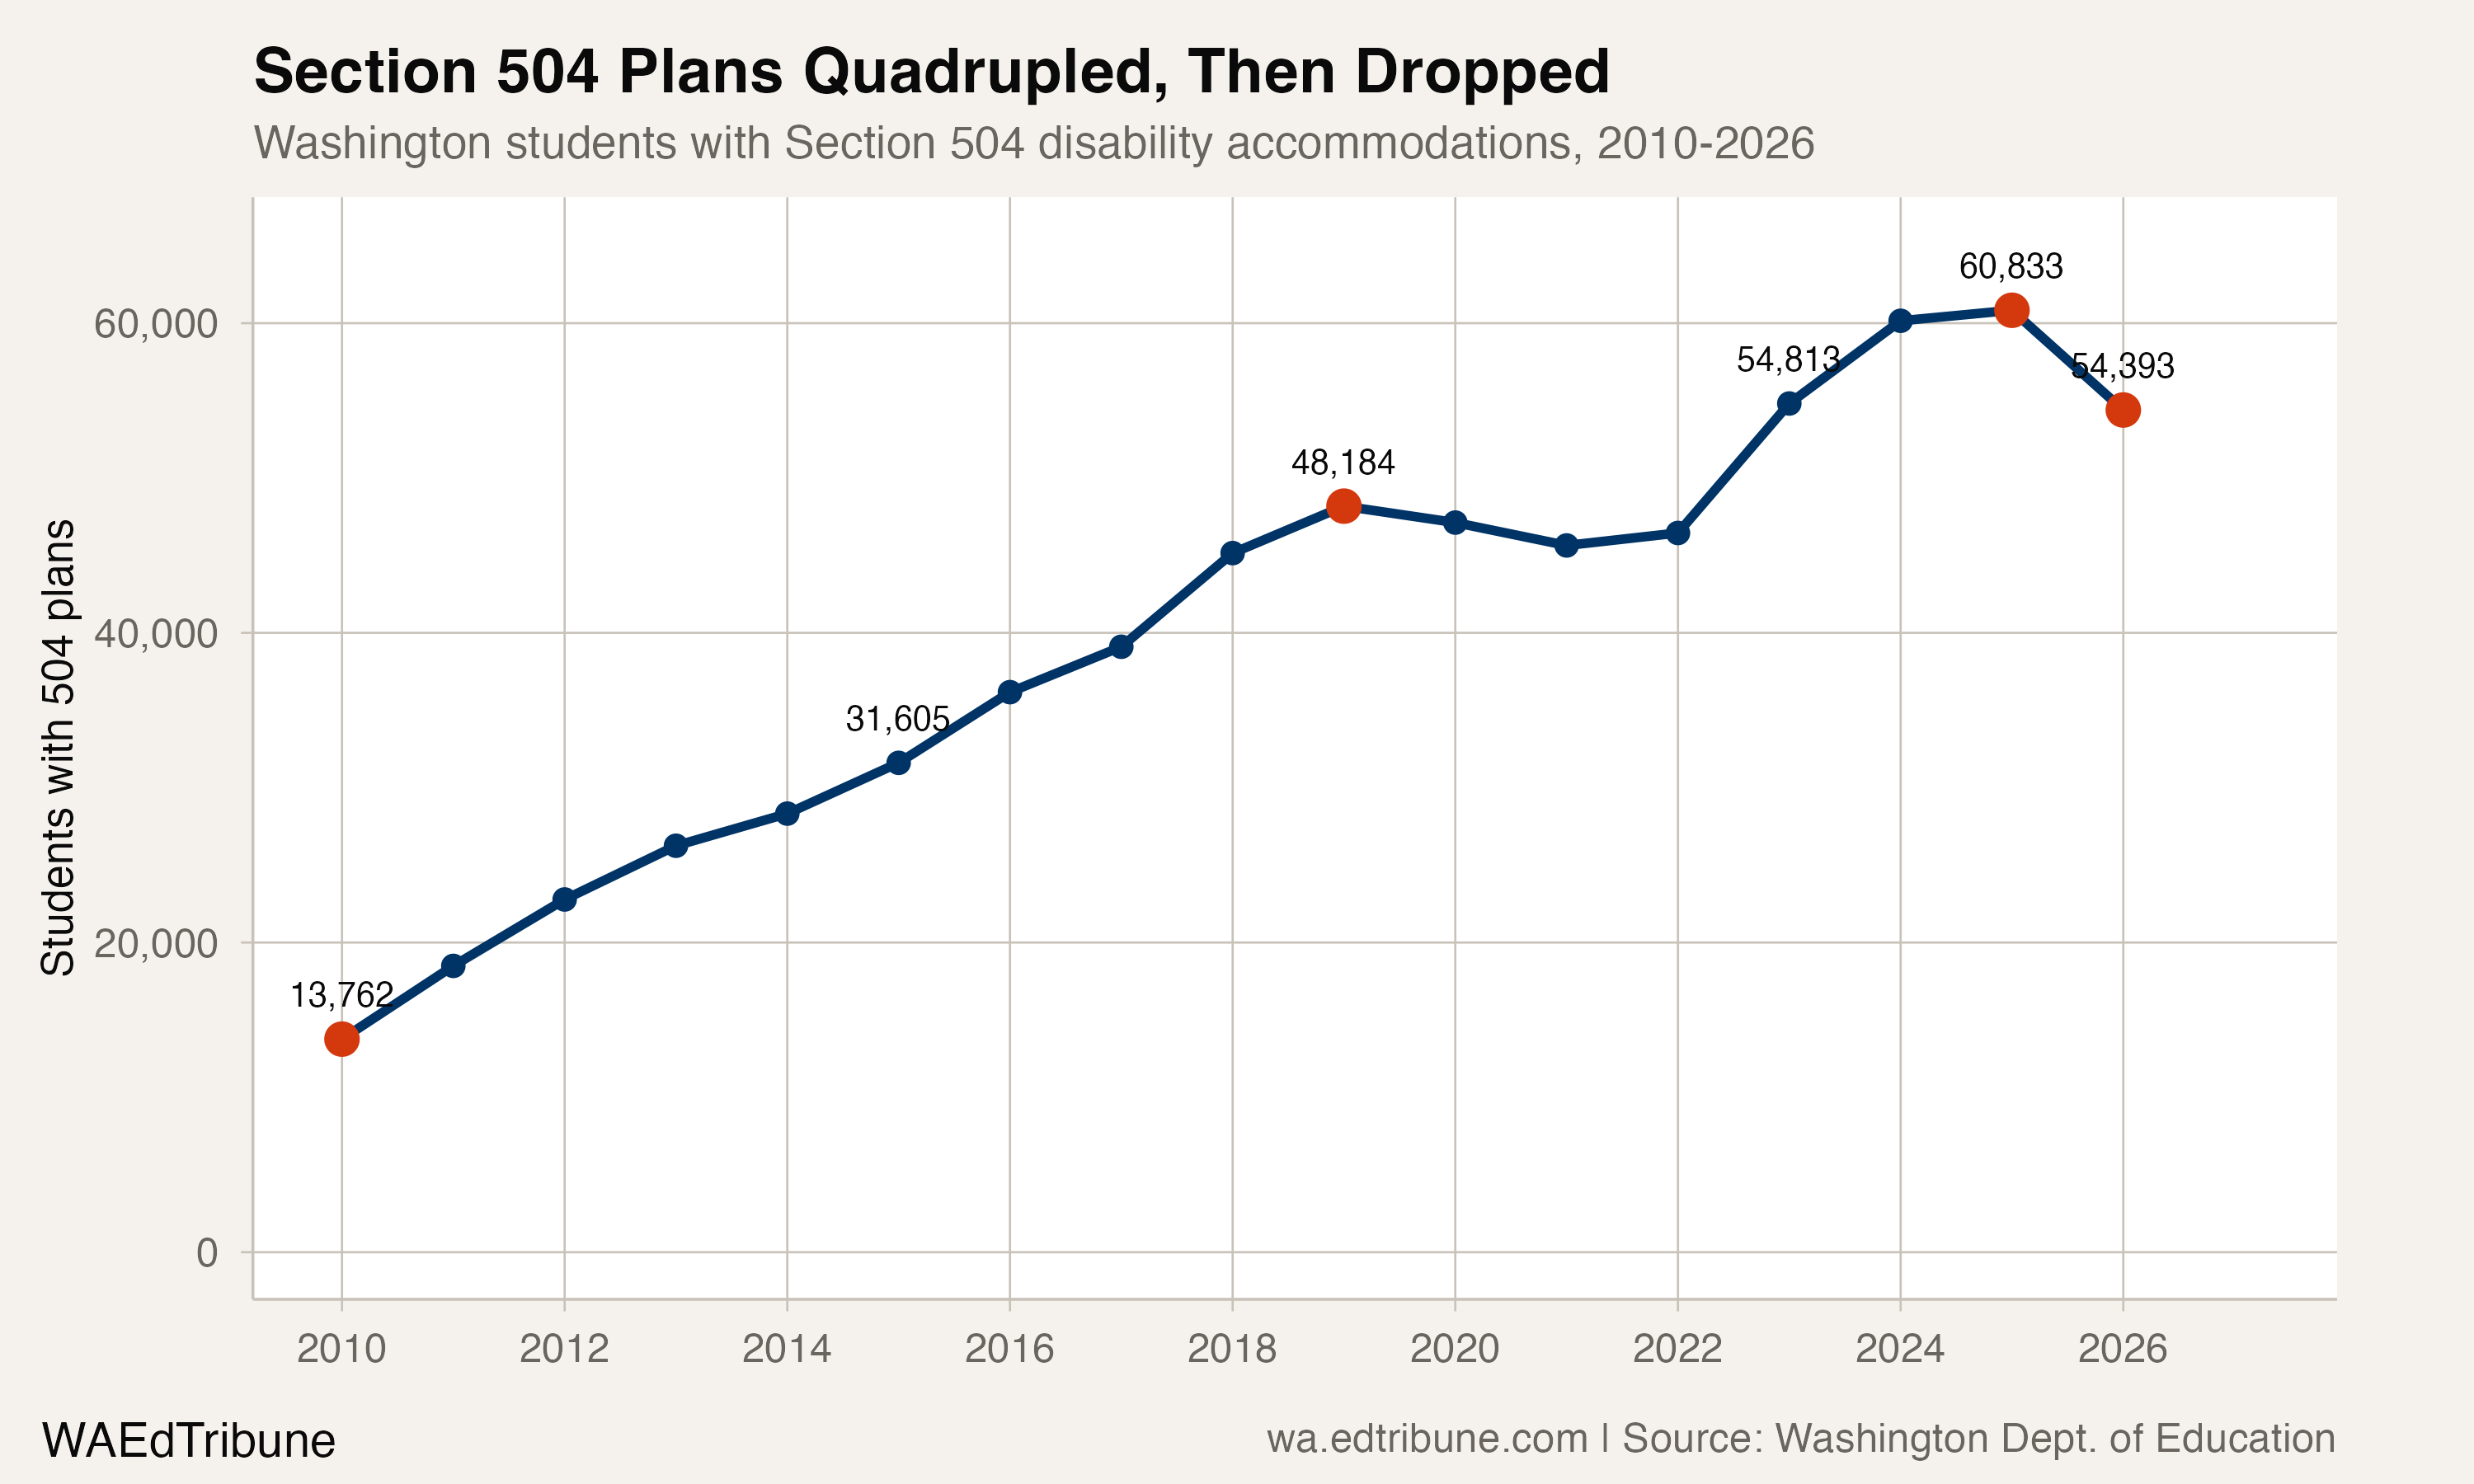
Statewide, Section 504 plans have more than quadrupled over 16 years, from 13,762 students (1.3% of enrollment) in 2009-10 to 63,548 (5.8%) in 2025-26, the most recent year in the state's published data. Combined with the 16.9% special education rate that year, more than one in five Washington students carried some form of documented disability accommodation. That combined rate was 14.5% in 2010.
The count is still rising: 504 plans grew by 2,715 students in 2025-26.
The law changed before the culture did
The acceleration began before COVID, before the youth mental health crisis entered the national vocabulary, before pandemic-era telehealth made ADHD diagnoses easier to obtain. It started with a legal change.
The Americans with Disabilities Act Amendments Act of 2008, effective January 2009, broadened the definition of disability under both the ADA and Section 504. The new standard lowered the threshold: impairments no longer needed to "prevent or severely or significantly restrict" a major life activity to qualify. The law expanded the list of major life activities to include concentrating, reading, and thinking, and it barred schools from considering how well a student's medication or coping strategies managed their condition.
For students with ADHD, the effect was immediate. A student earning good grades could no longer be denied a 504 plan on that basis alone. Federal guidance later reinforced that "grades alone are an insufficient basis" for determining whether a student has a disability.
Washington's data shows the result. In 2009-10, 184 districts reported any 504 students. By 2024-25, 283 districts did. The statewide count grew every single year from 2010 through 2019, averaging 3,825 new 504 plans annually.
The pandemic interrupted, then turbocharged growth
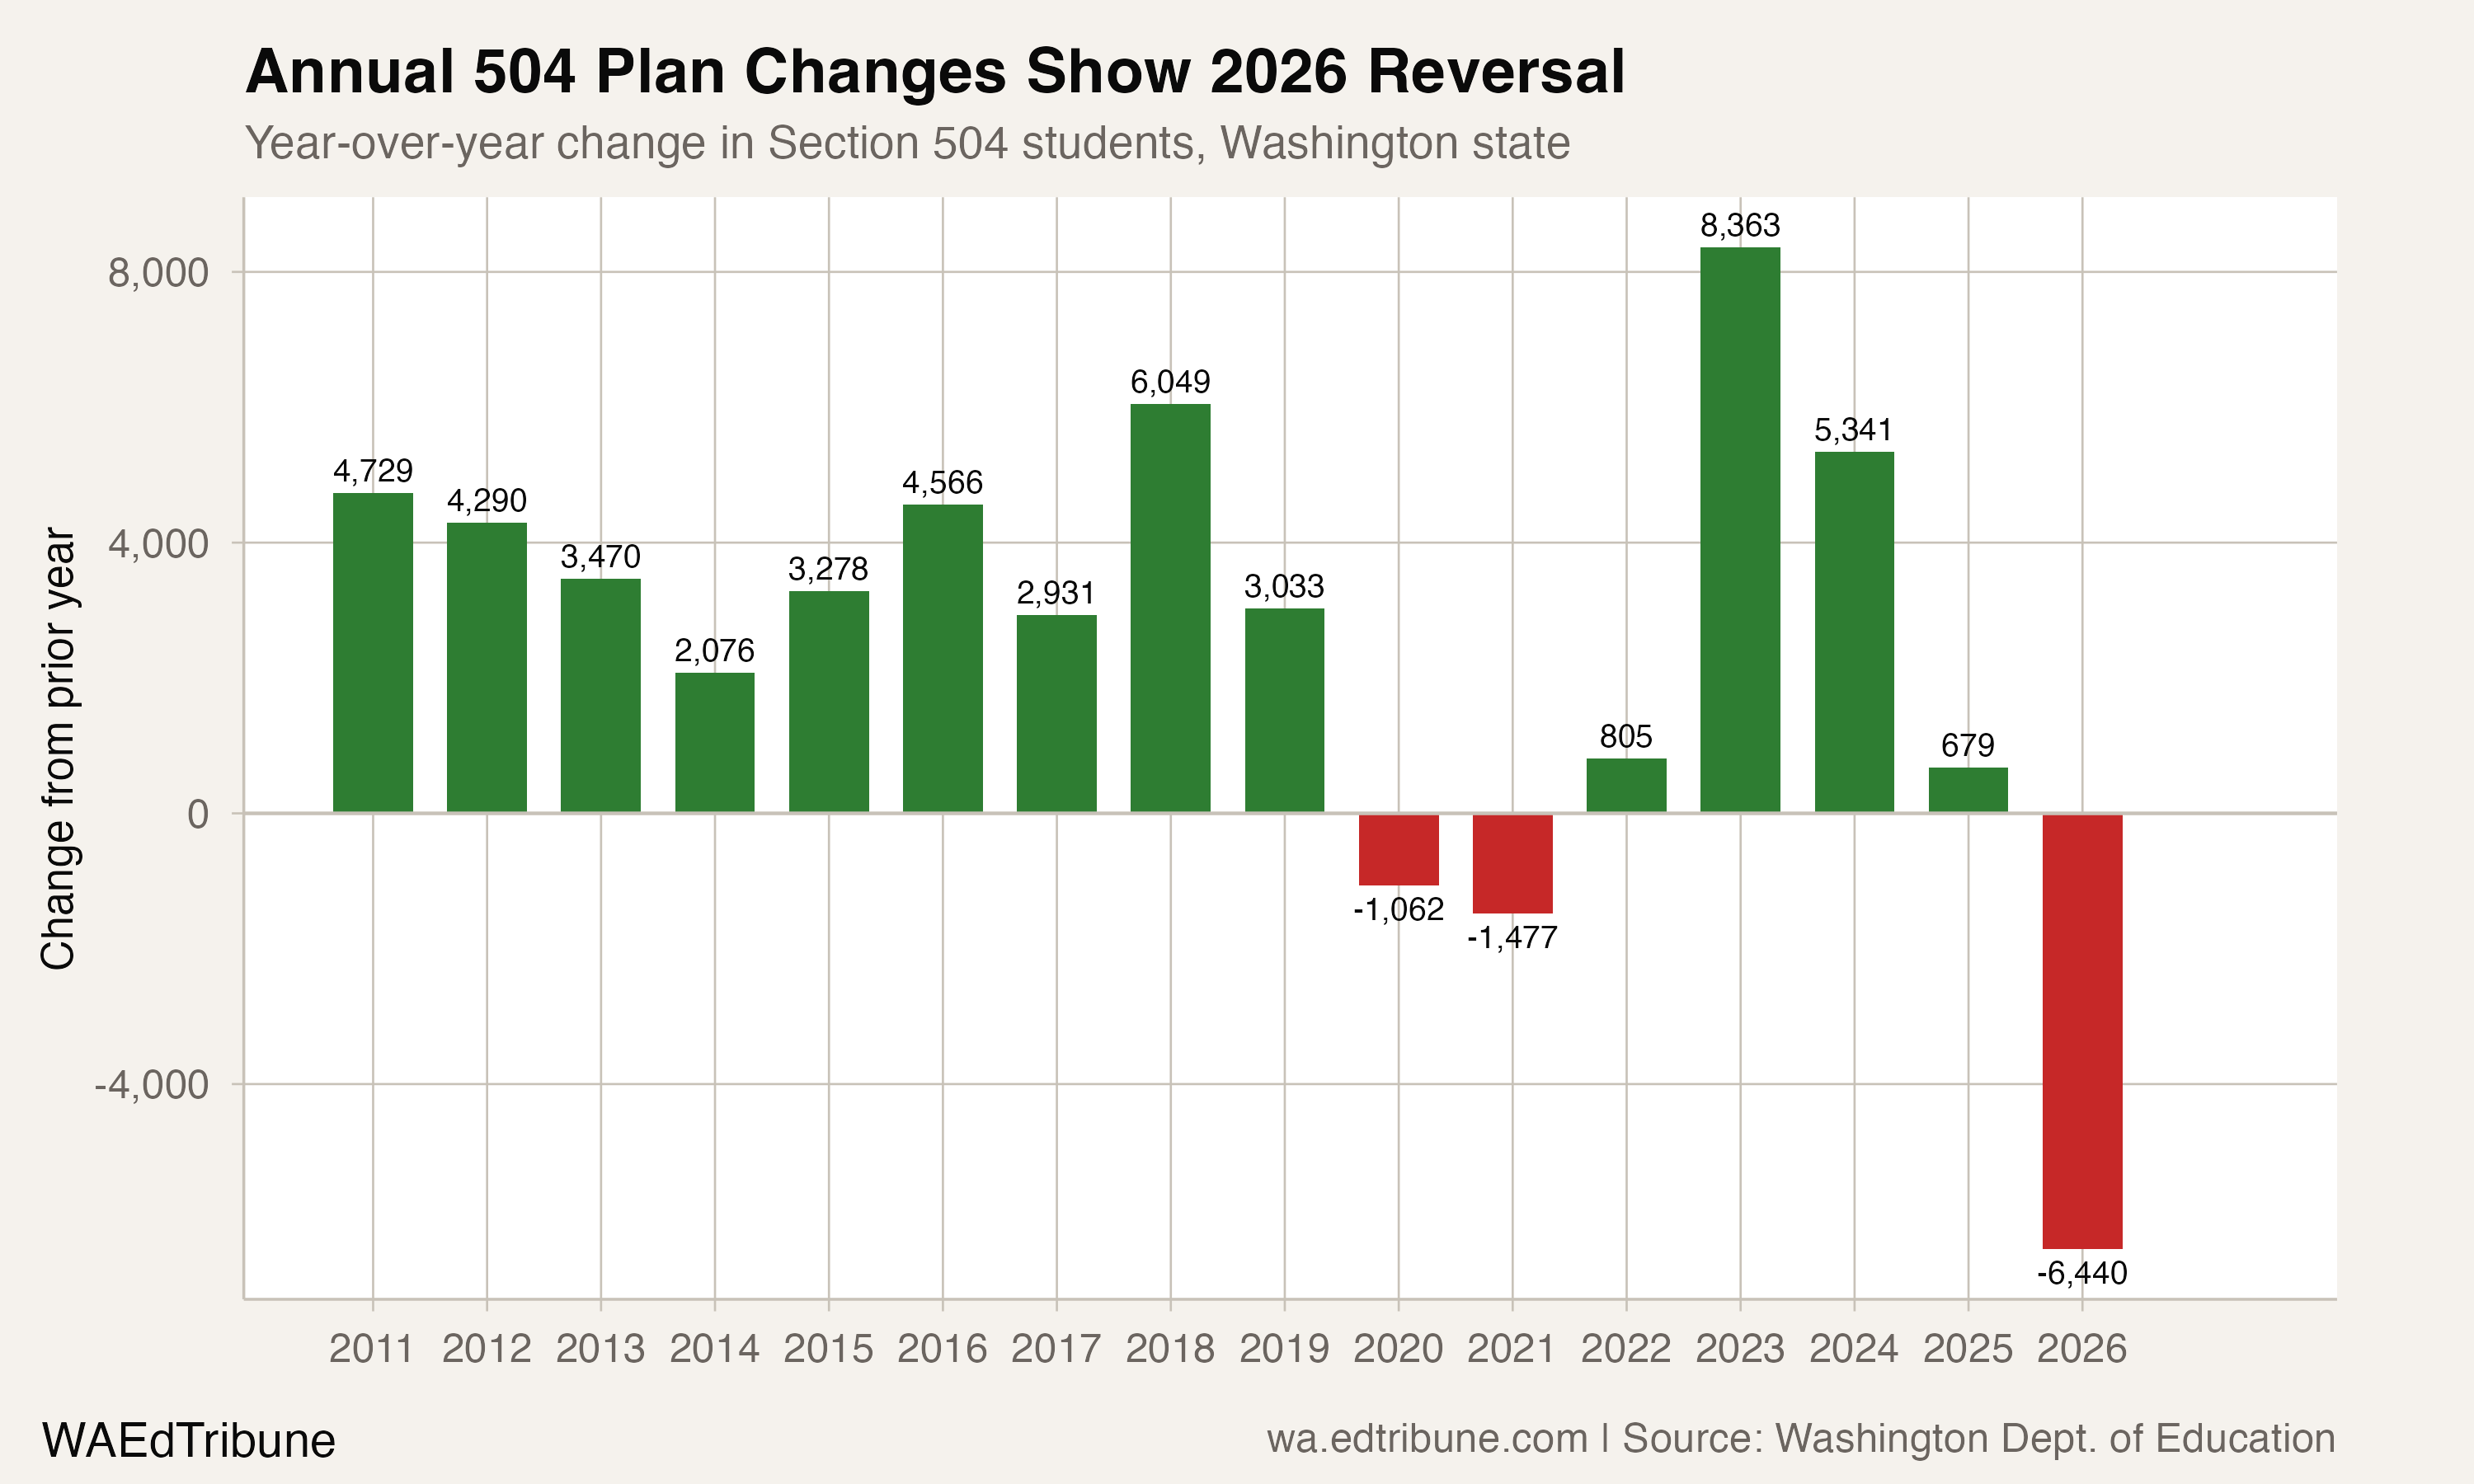
COVID briefly reversed the trend. Schools lost 1,062 Section 504 students in 2019-20 and another 1,477 in 2020-21, as remote learning made evaluations difficult and some families disengaged from formal accommodation processes entirely.
The rebound was swift and steep. From 2021-22 to 2022-23, the state added 8,363 Section 504 students in a single year, an 18.0% jump that dwarfed any pre-pandemic annual increase. The post-pandemic growth rate from 2021 to 2025 averaged 3,797 new plans per year, roughly matching the pre-pandemic pace, but compressed into a recovery surge that peaked in 2022-23 and 2023-24.
The timing coincides with a national surge in ADHD diagnoses. Between 2016 and 2022, approximately one million additional children received ADHD diagnoses nationwide, bringing the overall rate to 11.4% of children ages 3 to 17. Post-pandemic awareness campaigns, expanded telehealth access, and heightened attention to youth mental health all contributed to more families seeking evaluations.
But rising diagnoses alone do not explain the pattern in Washington's data. If they did, 504 rates would be climbing at roughly similar rates everywhere. They are not.
Where you live determines whether you get identified
The correlation between district wealth and 504 identification is stark. Among Washington districts with at least two thousand students, the correlation between a district's low-income rate (the share of students eligible for free or reduced-price lunch) and its Section 504 rate is -0.69: the more affluent the district, the higher the 504 rate.
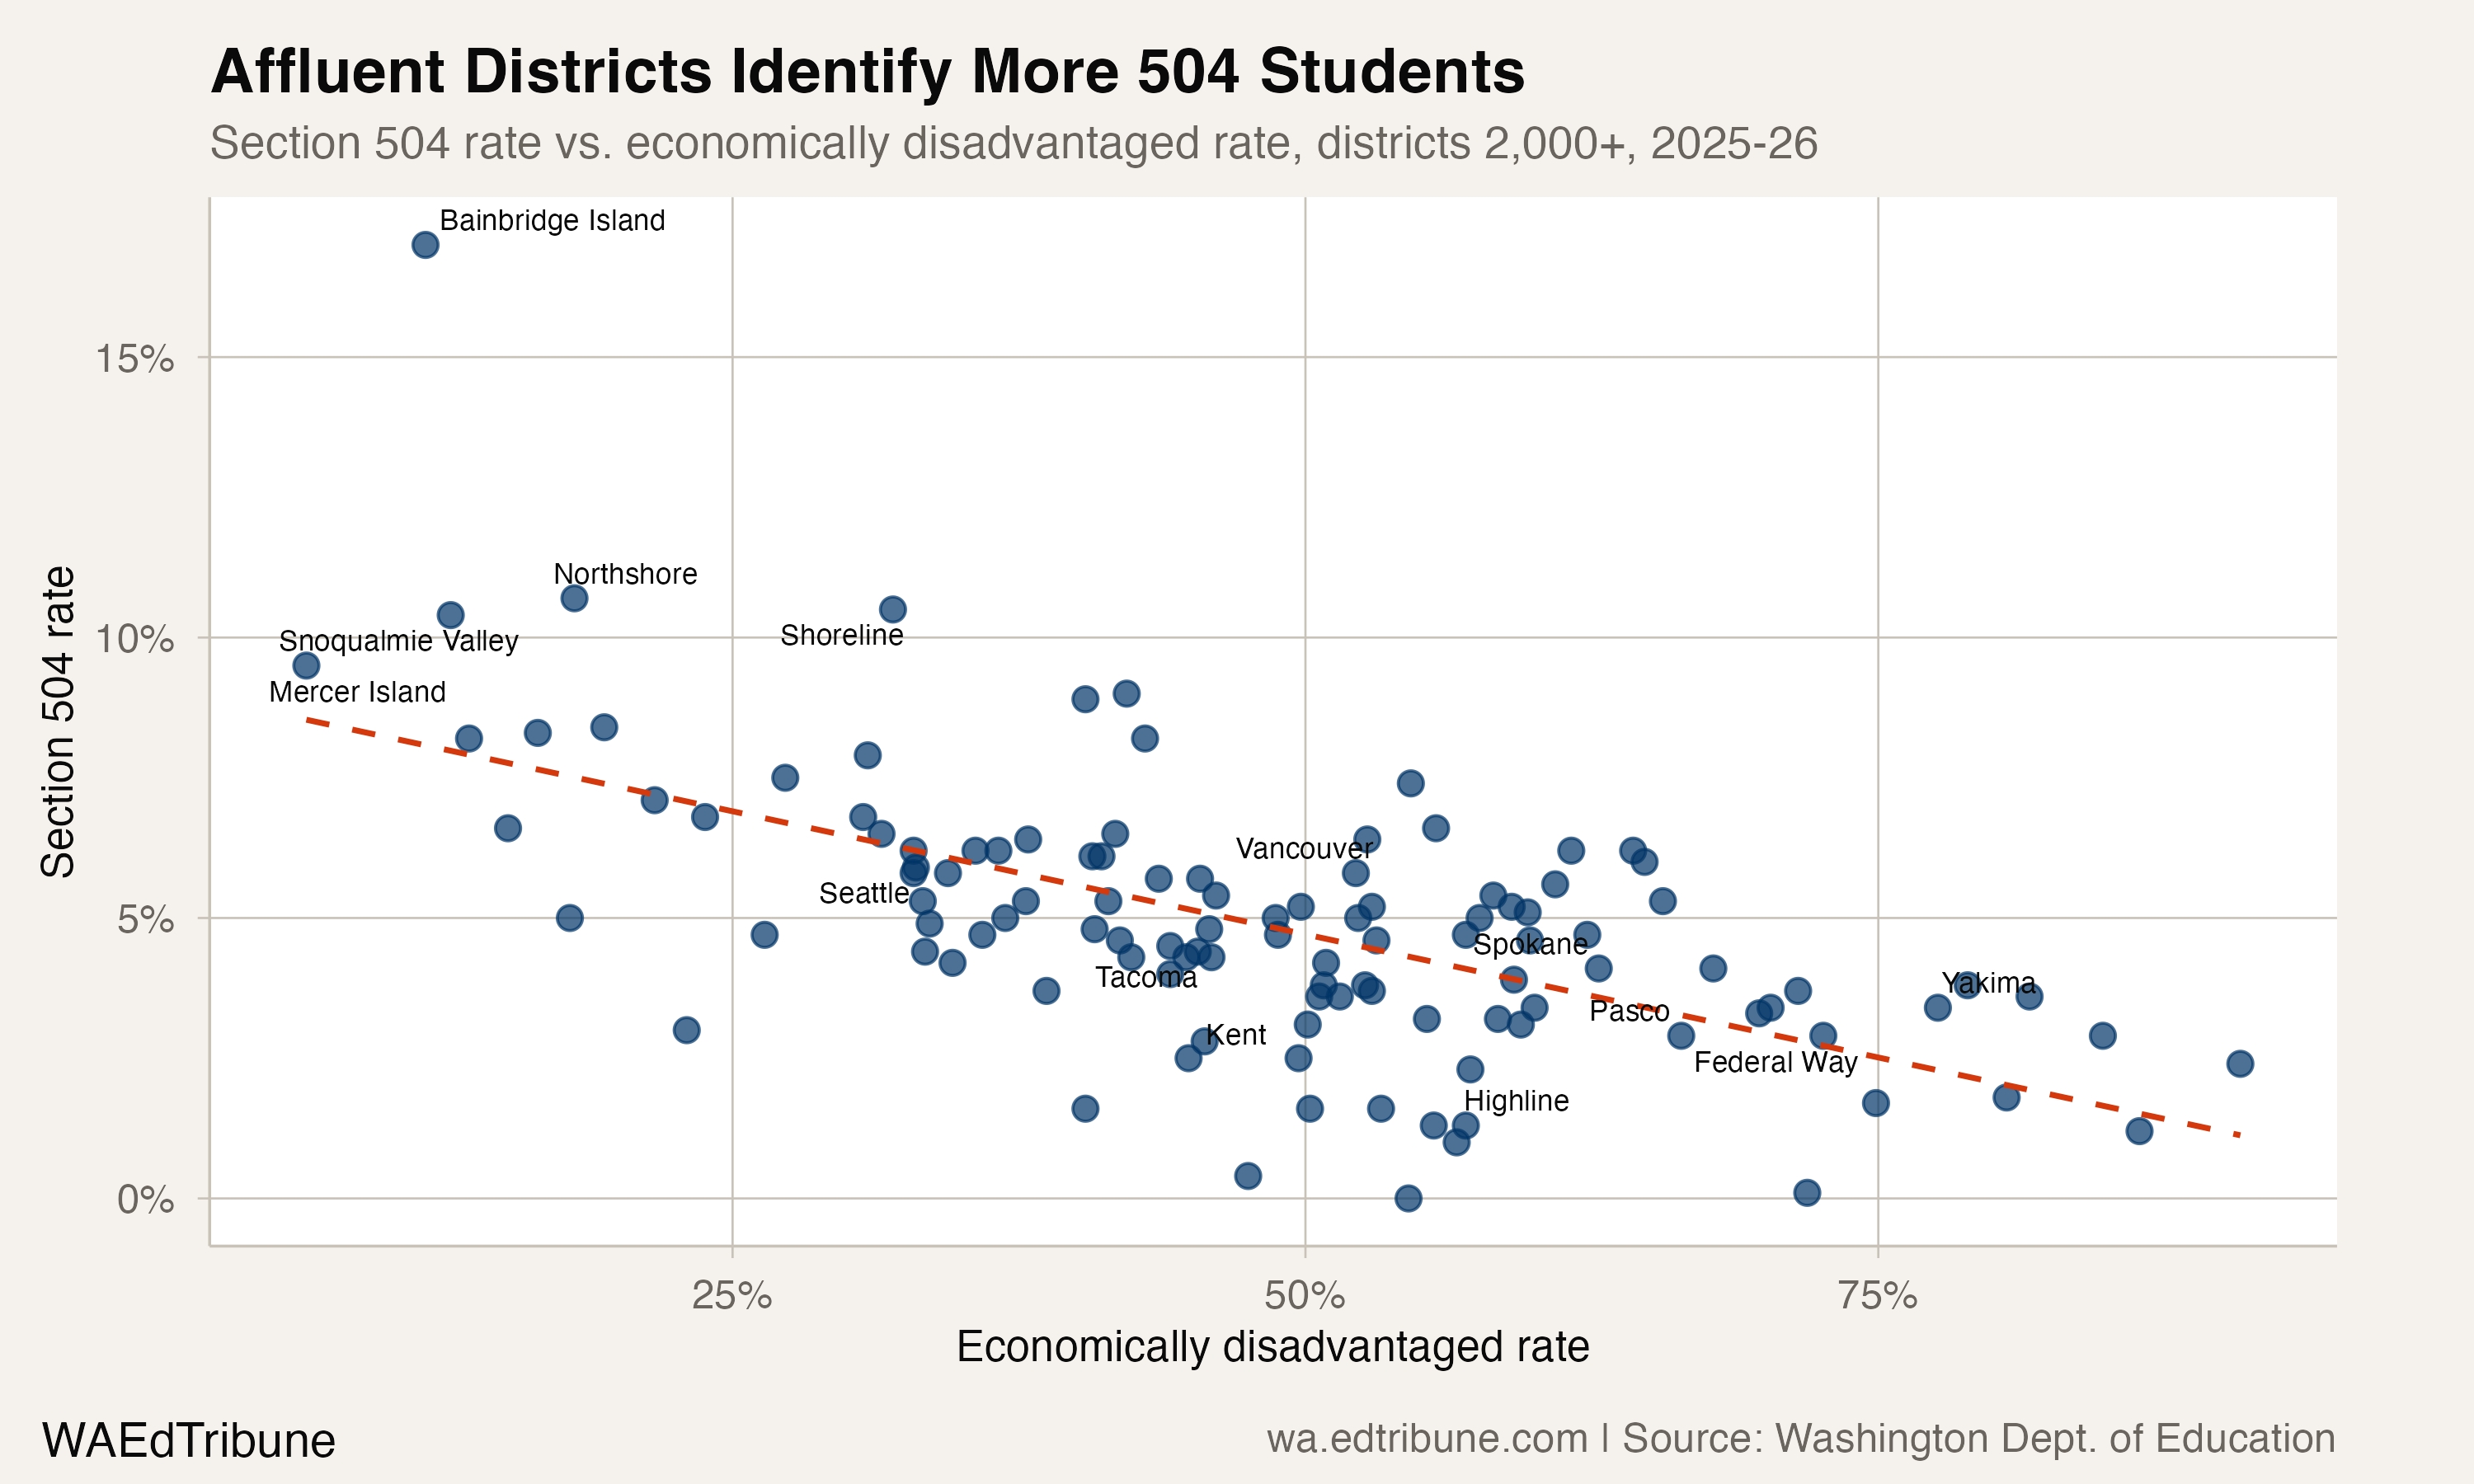
Bainbridge Island↗ET, where fewer than 15% of students are low-income, identifies 18.4% of its enrollment on 504 plans. Northshore↗ET, a large suburban district north of Kirkland, identifies 11.9%. Snoqualmie Valley↗ET and Shoreline↗ET both identify more than one in ten.
At the other end: Yakima↗ET, where more than 75% of students are low-income, identifies 4.3%. Highline↗ET, just south of Seattle, identifies 1.3%. Federal Way, at 3.6%, serves a student body nearly the size of Bainbridge Island, Mercer Island, Snoqualmie Valley, and Shoreline combined.
This pattern is consistent with national research. A policy brief from the National Education Policy Center found that Section 504's "broad eligibility criteria, lack of funding, and substantial deference to the professional judgment of educators" have favored families with the resources to pursue private evaluations. White students are more than twice as likely as Black or Hispanic students to have a 504 plan nationally, despite comparable rates of underlying conditions like ADHD.
"Section 504's broad eligibility criteria, lack of funding, and substantial deference to the professional judgment of educators and external evaluators have favored powerful and privileged families."
The mechanism is straightforward. Section 504 is an unfunded federal mandate. Unlike special education under IDEA, which carries dedicated federal funding, 504 plans bring no additional dollars to districts. Schools must provide the accommodations (extended test time, preferential seating, modified assignments, breaks for medication) but receive nothing to pay for them. Districts with smaller caseloads have less institutional infrastructure for evaluations. Families in those districts may not know a 504 plan exists, may lack access to private psychologists who can document a qualifying condition, or may face language barriers in navigating the referral process.
2025-26: still climbing
Growth has not stopped since the pandemic dip. Section 504 plans rose by 2,715 students in 2025-26, from 60,833 to 63,548, and the statewide rate climbed from 5.5% to 5.8%.
The increase was not uniform. Four fewer districts reported any 504 students at all (279, down from 283), and 102 districts reported fewer 504 students than the year before while 152 reported more. Some individual district drops suggest reporting changes rather than genuine declines: Cheney↗ET fell from 186 to one, and Grandview fell from 71 to 10, patterns more consistent with a data submission issue than a mass revocation of accommodation plans.
Large districts moved in both directions. Seattle↗ET reported 137 fewer Section 504 students and Lake Stevens↗ET 98 fewer, while Lake Washington↗ET added 144. Whether the declines reflect tightened identification criteria, families leaving the public system, or local reporting changes is not clear from the data alone.
What 1 in 5 means for schools
The combined accommodation rate tells a structural story. In 2025-26, 63,548 students hold 504 plans (5.8%) and 185,724 receive special education services (16.9%). Together, that is 22.7% of Washington's enrollment, up from 14.5% in 2010.
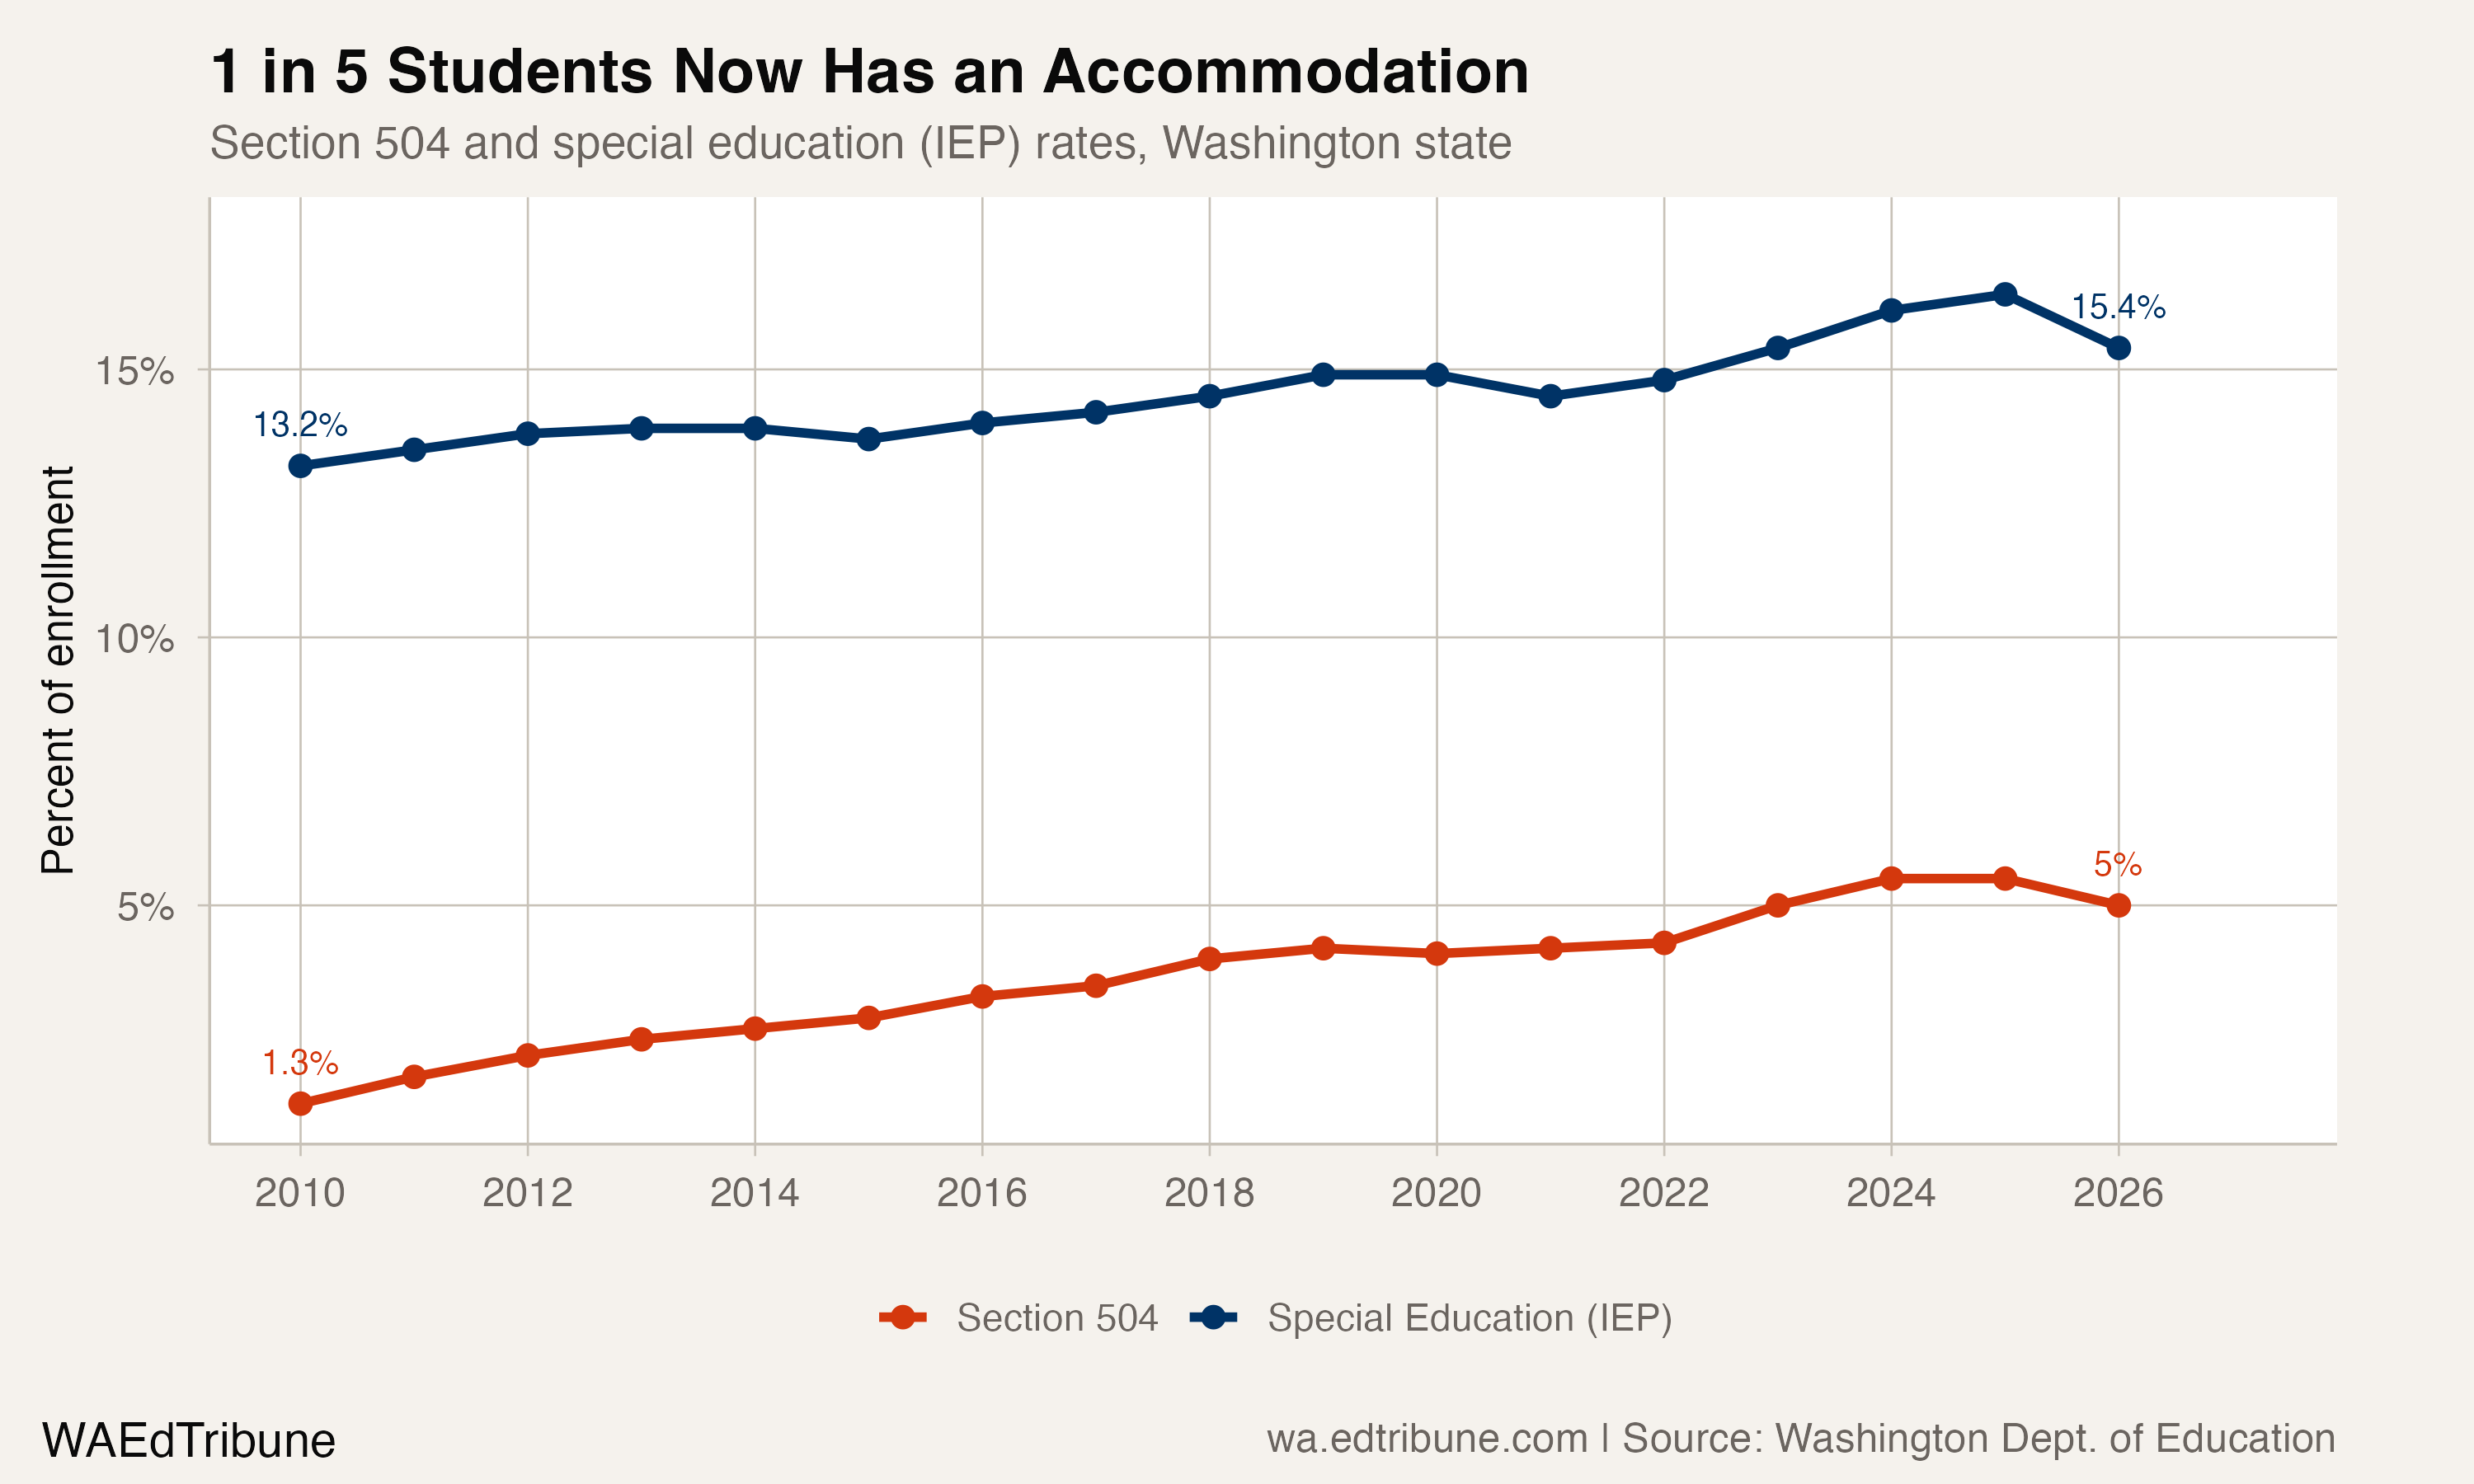
This is not a temporary phenomenon. The special education rate has climbed steadily from 13.2% to 16.9% over 17 years, and the number of students with 504 plans is 4.6 times its 2010 level.
For districts, the fiscal implication is real. Special education carries per-pupil costs well above the base rate, funded partly through IDEA. Section 504 accommodations receive no categorical funding at all. Every extended-time test, every behavioral intervention plan, every physical accommodation comes out of the district's general fund. As 504 caseloads have grown more than fourfold, the unfunded cost of compliance has grown with them.
A federal law under federal challenge
The legal foundation for all of this is not as secure as it was a year ago. Seventeen states have filed suit in Texas v. Becerra challenging the constitutionality of Section 504 itself. While the lawsuit's proximate trigger was the Biden administration's 2024 rule update, the states' legal brief asks the court to "declare Section 504 unconstitutional" and "enjoin enforcement" of the law entirely. Washington is not among the plaintiff states.
If the challenge succeeds, 63,548 Washington students would lose the federal guarantee that schools must provide them with disability accommodations. Whether the state's own laws would fill that gap is an open question.
The more immediate question is local. The fivefold gap between Bainbridge Island's 18.4% identification rate and Federal Way's 3.6% is not a gap in disability prevalence. It is a gap in access to the system that documents disability and converts it into classroom support. More than four times as many students hold 504 plans as in 2010. Whether the students who need them most are the ones getting them is a different question, and the data suggests they are not.
Detailed code that reproduces the analysis and figures in this article is available exclusively to EdTribune subscribers.
Discussion
Sign in to join the discussion.
Loading comments...