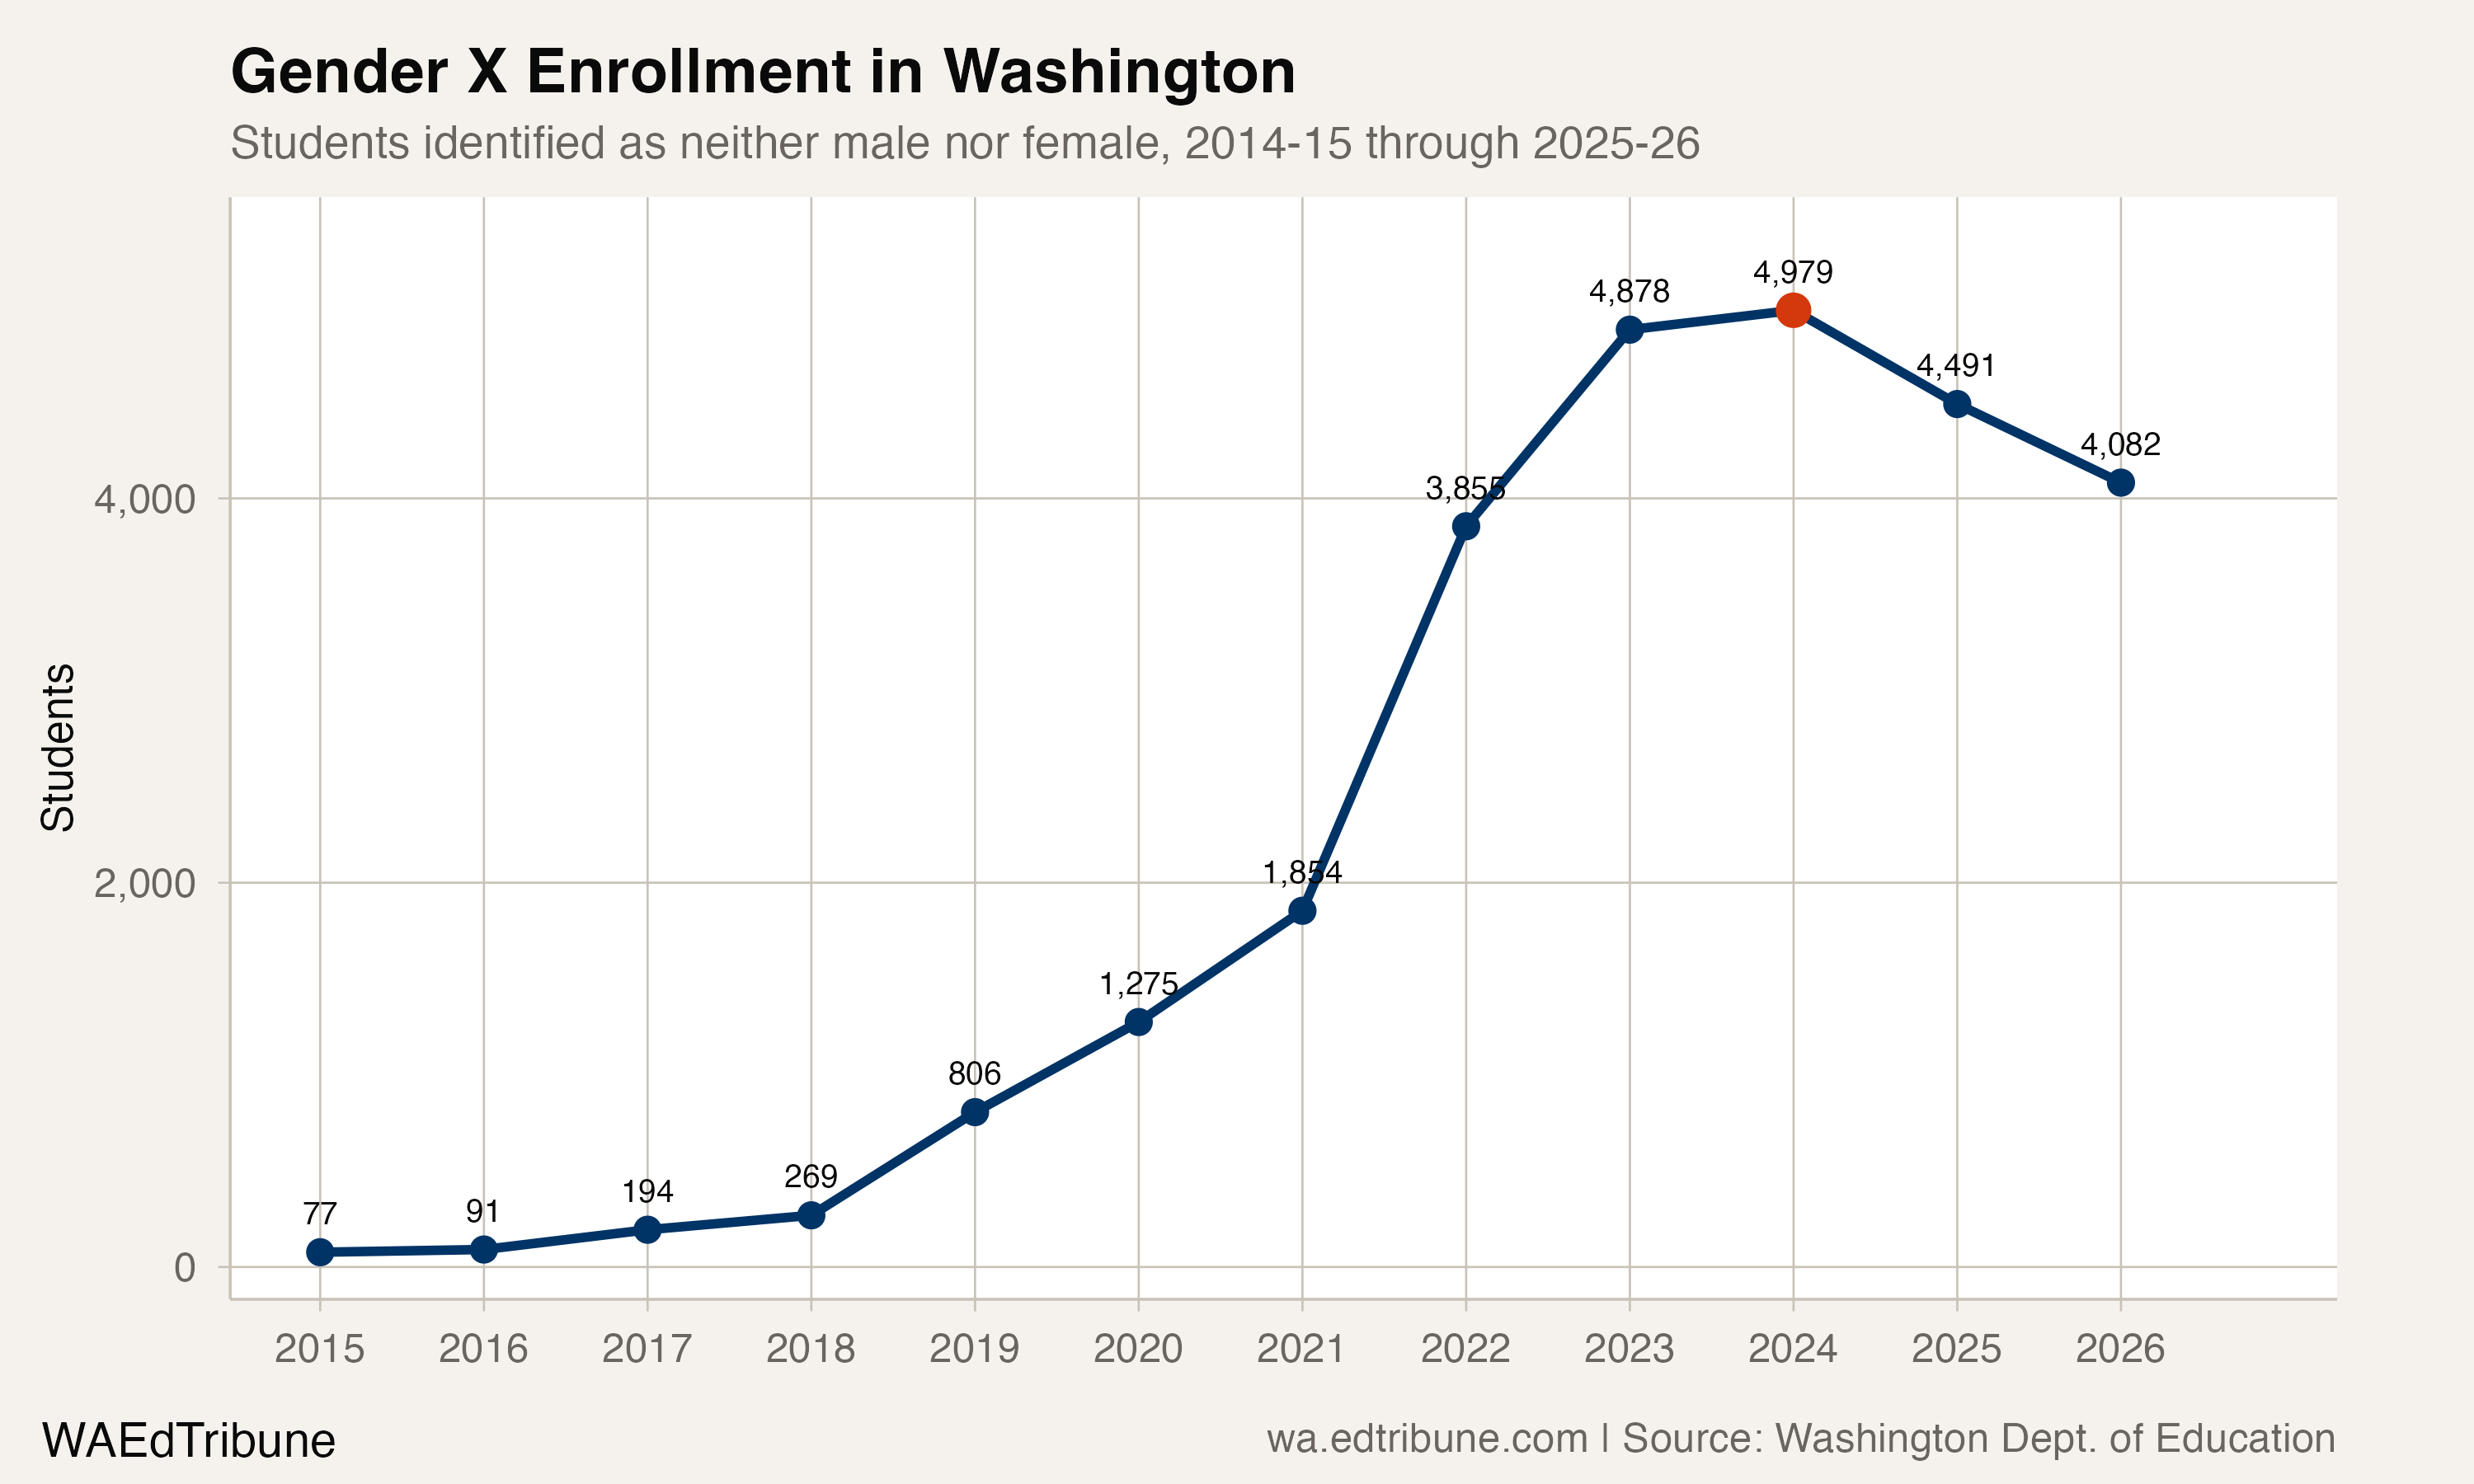
In 2014-15, Washington's public schools counted 77 students who identified as neither male nor female. By 2023-24, that number had reached 4,979, a 6,362% increase that made Washington one of the most significant datasets in the country for tracking nonbinary student identity. Then the count began falling: 4,491 in 2024-25, 4,082 in 2025-26. Two consecutive years of decline, totaling 897 students, or 18.0% below the peak.
The reversal raises a question the data alone cannot resolve. Are fewer students identifying outside the gender binary, or are fewer schools recording it?
A trajectory unlike anything else in the enrollment data
Gender X appeared in Washington's CEDARS data system when OSPI began allowing districts to report a third gender category alongside male and female. The initial numbers were tiny: 77 students statewide in 2015, 91 in 2016, 194 in 2017. Growth was measurable but easy to overlook in a system enrolling over a million students.
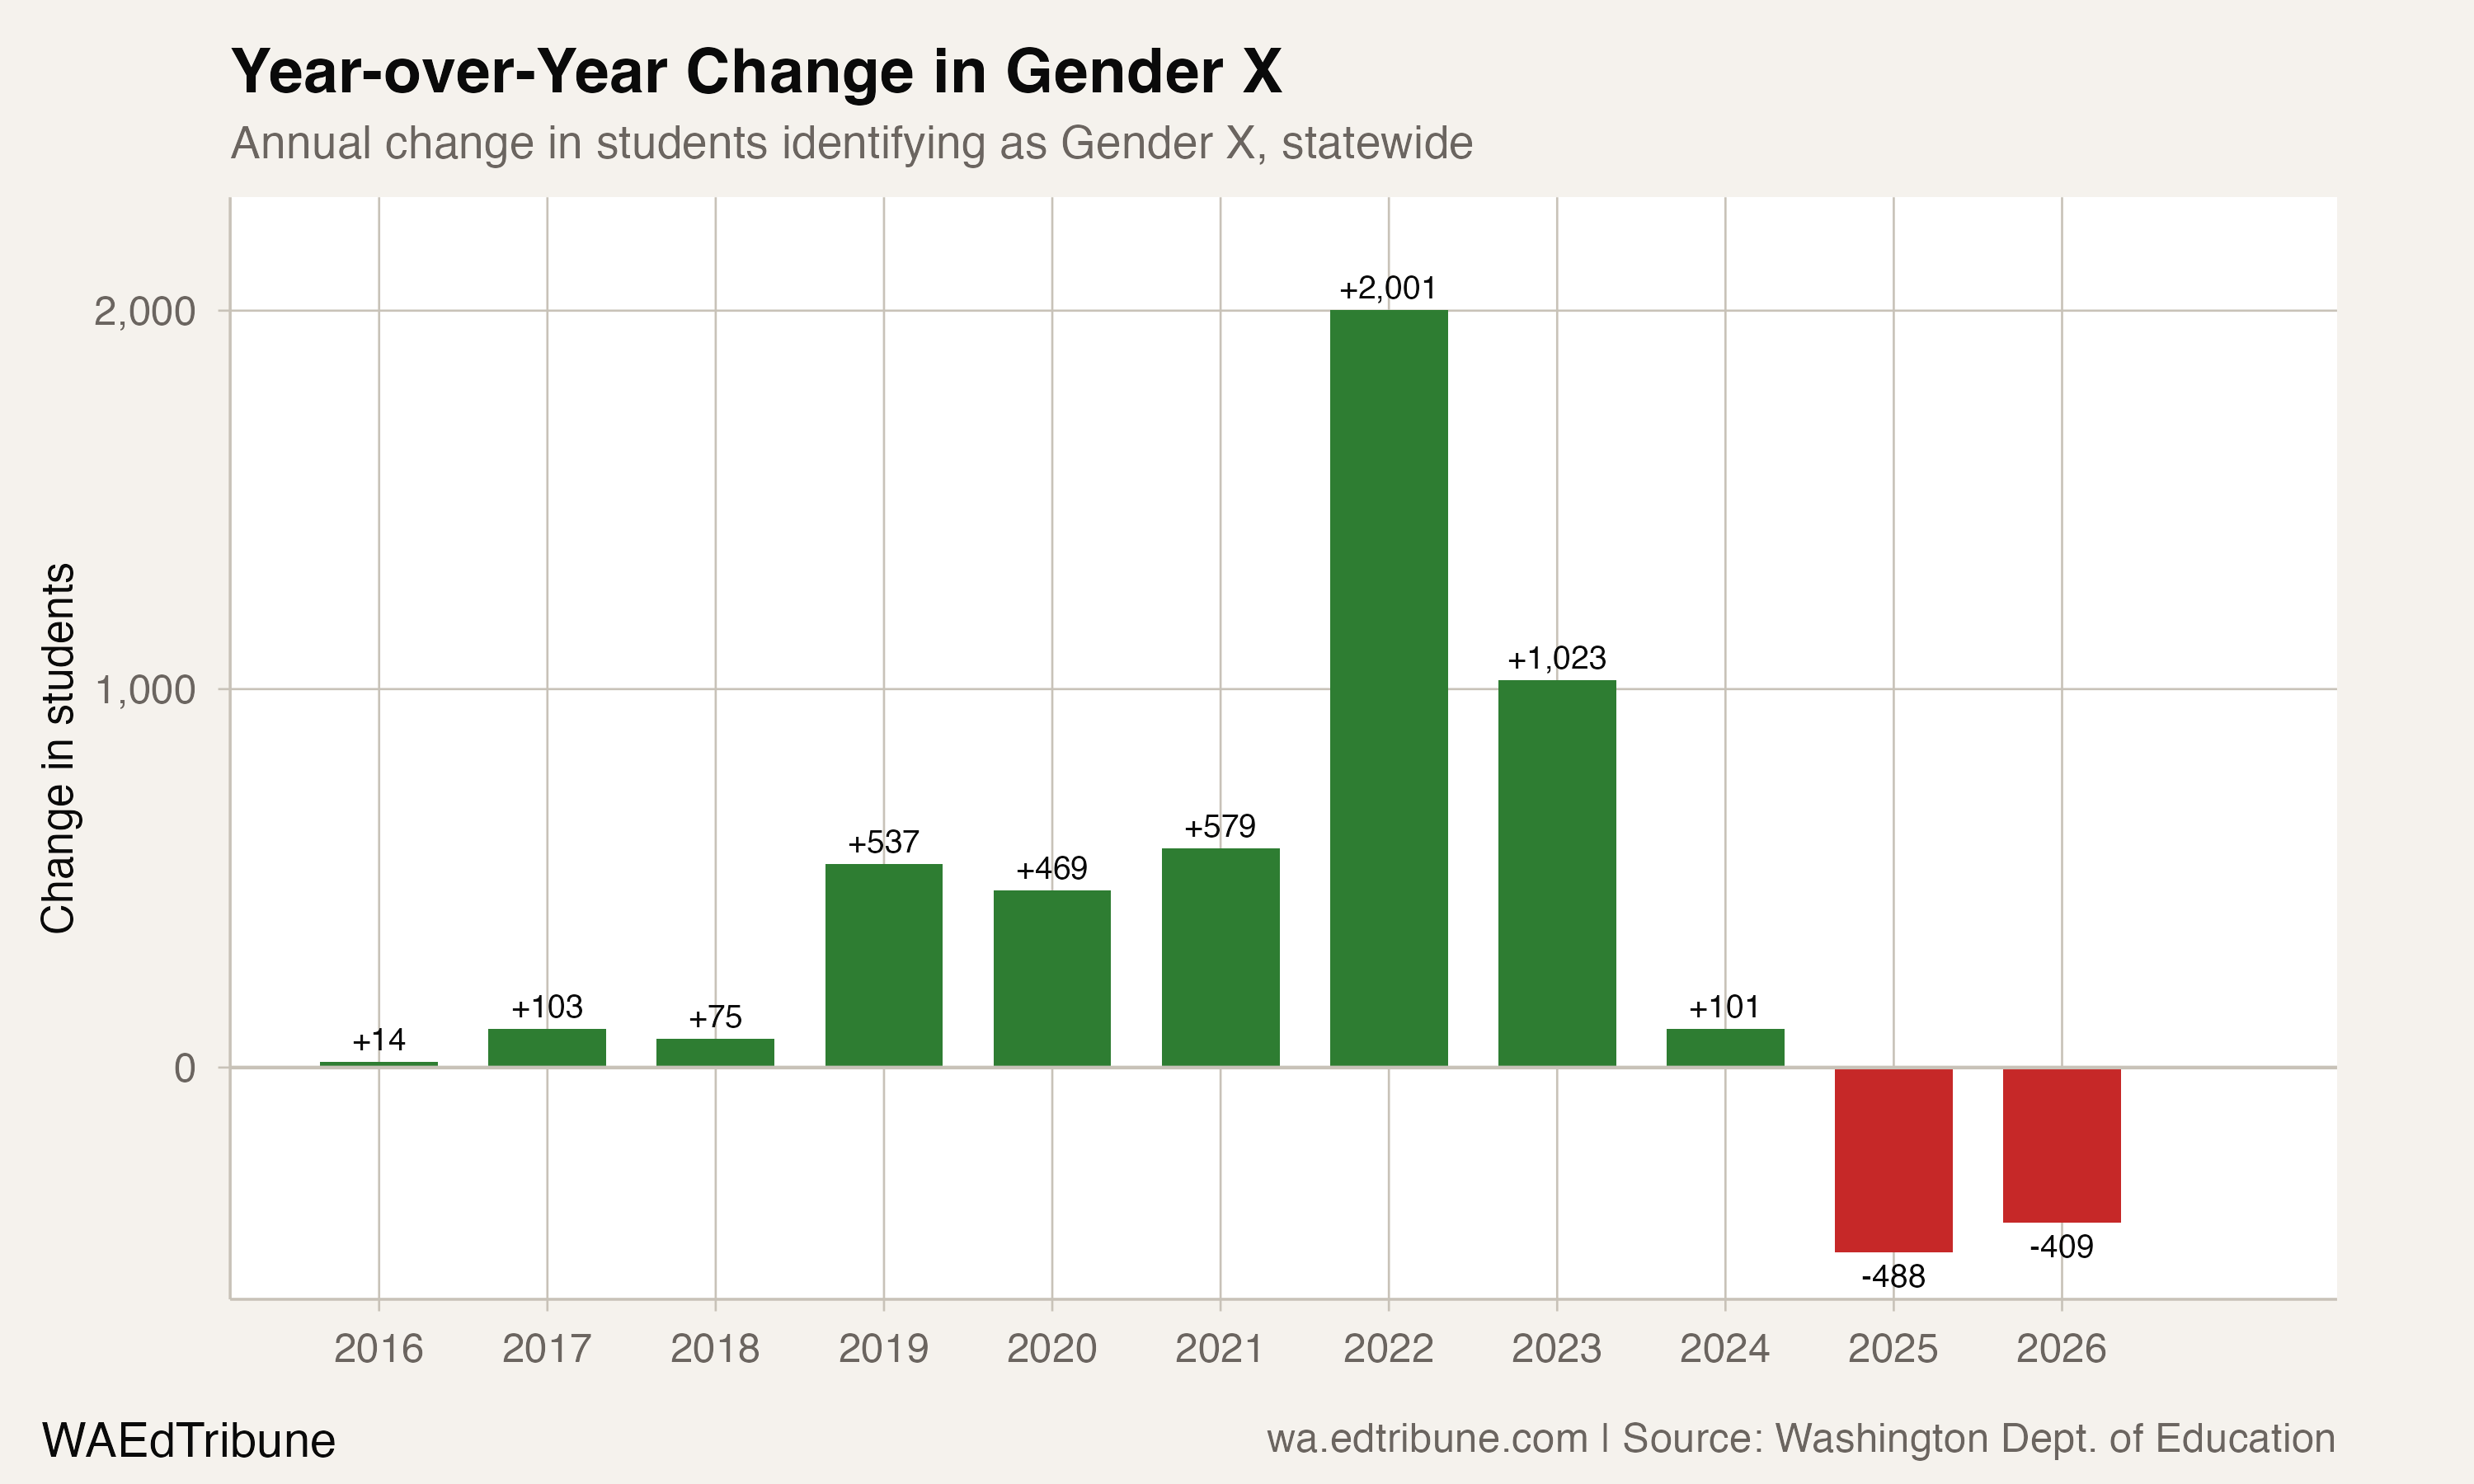
That changed in 2018-19, when the count nearly tripled in a single year, jumping from 269 to 806. Washington had adopted an "X" gender marker on birth certificates in January 2018, allowing individuals to select a designation that is "not exclusively male or female." The timing aligns: as official state documents began recognizing nonbinary identity, school reporting followed.
The steepest acceleration came in 2021-22, when Gender X enrollment more than doubled from 1,854 to 3,855, an increase of 2,001 students in a single year. That 107.9% jump coincided with districts implementing OSPI's Gender-Inclusive Schools policy, which required all districts to adopt policy 3211 by January 2020 and mandated that schools change a student's gender designation upon request with no proof of legal change required.
| Year | Gender X students | Share of enrollment | Change from prior year |
|---|---|---|---|
| 2015 | 77 | 0.007% | -- |
| 2018 | 269 | 0.024% | +75 |
| 2019 | 806 | 0.071% | +537 |
| 2021 | 1,854 | 0.170% | +579 |
| 2022 | 3,855 | 0.353% | +2,001 |
| 2024 | 4,979 | 0.453% | +101 |
| 2025 | 4,491 | 0.406% | -488 |
| 2026 | 4,082 | 0.372% | -409 |
What the district map reveals
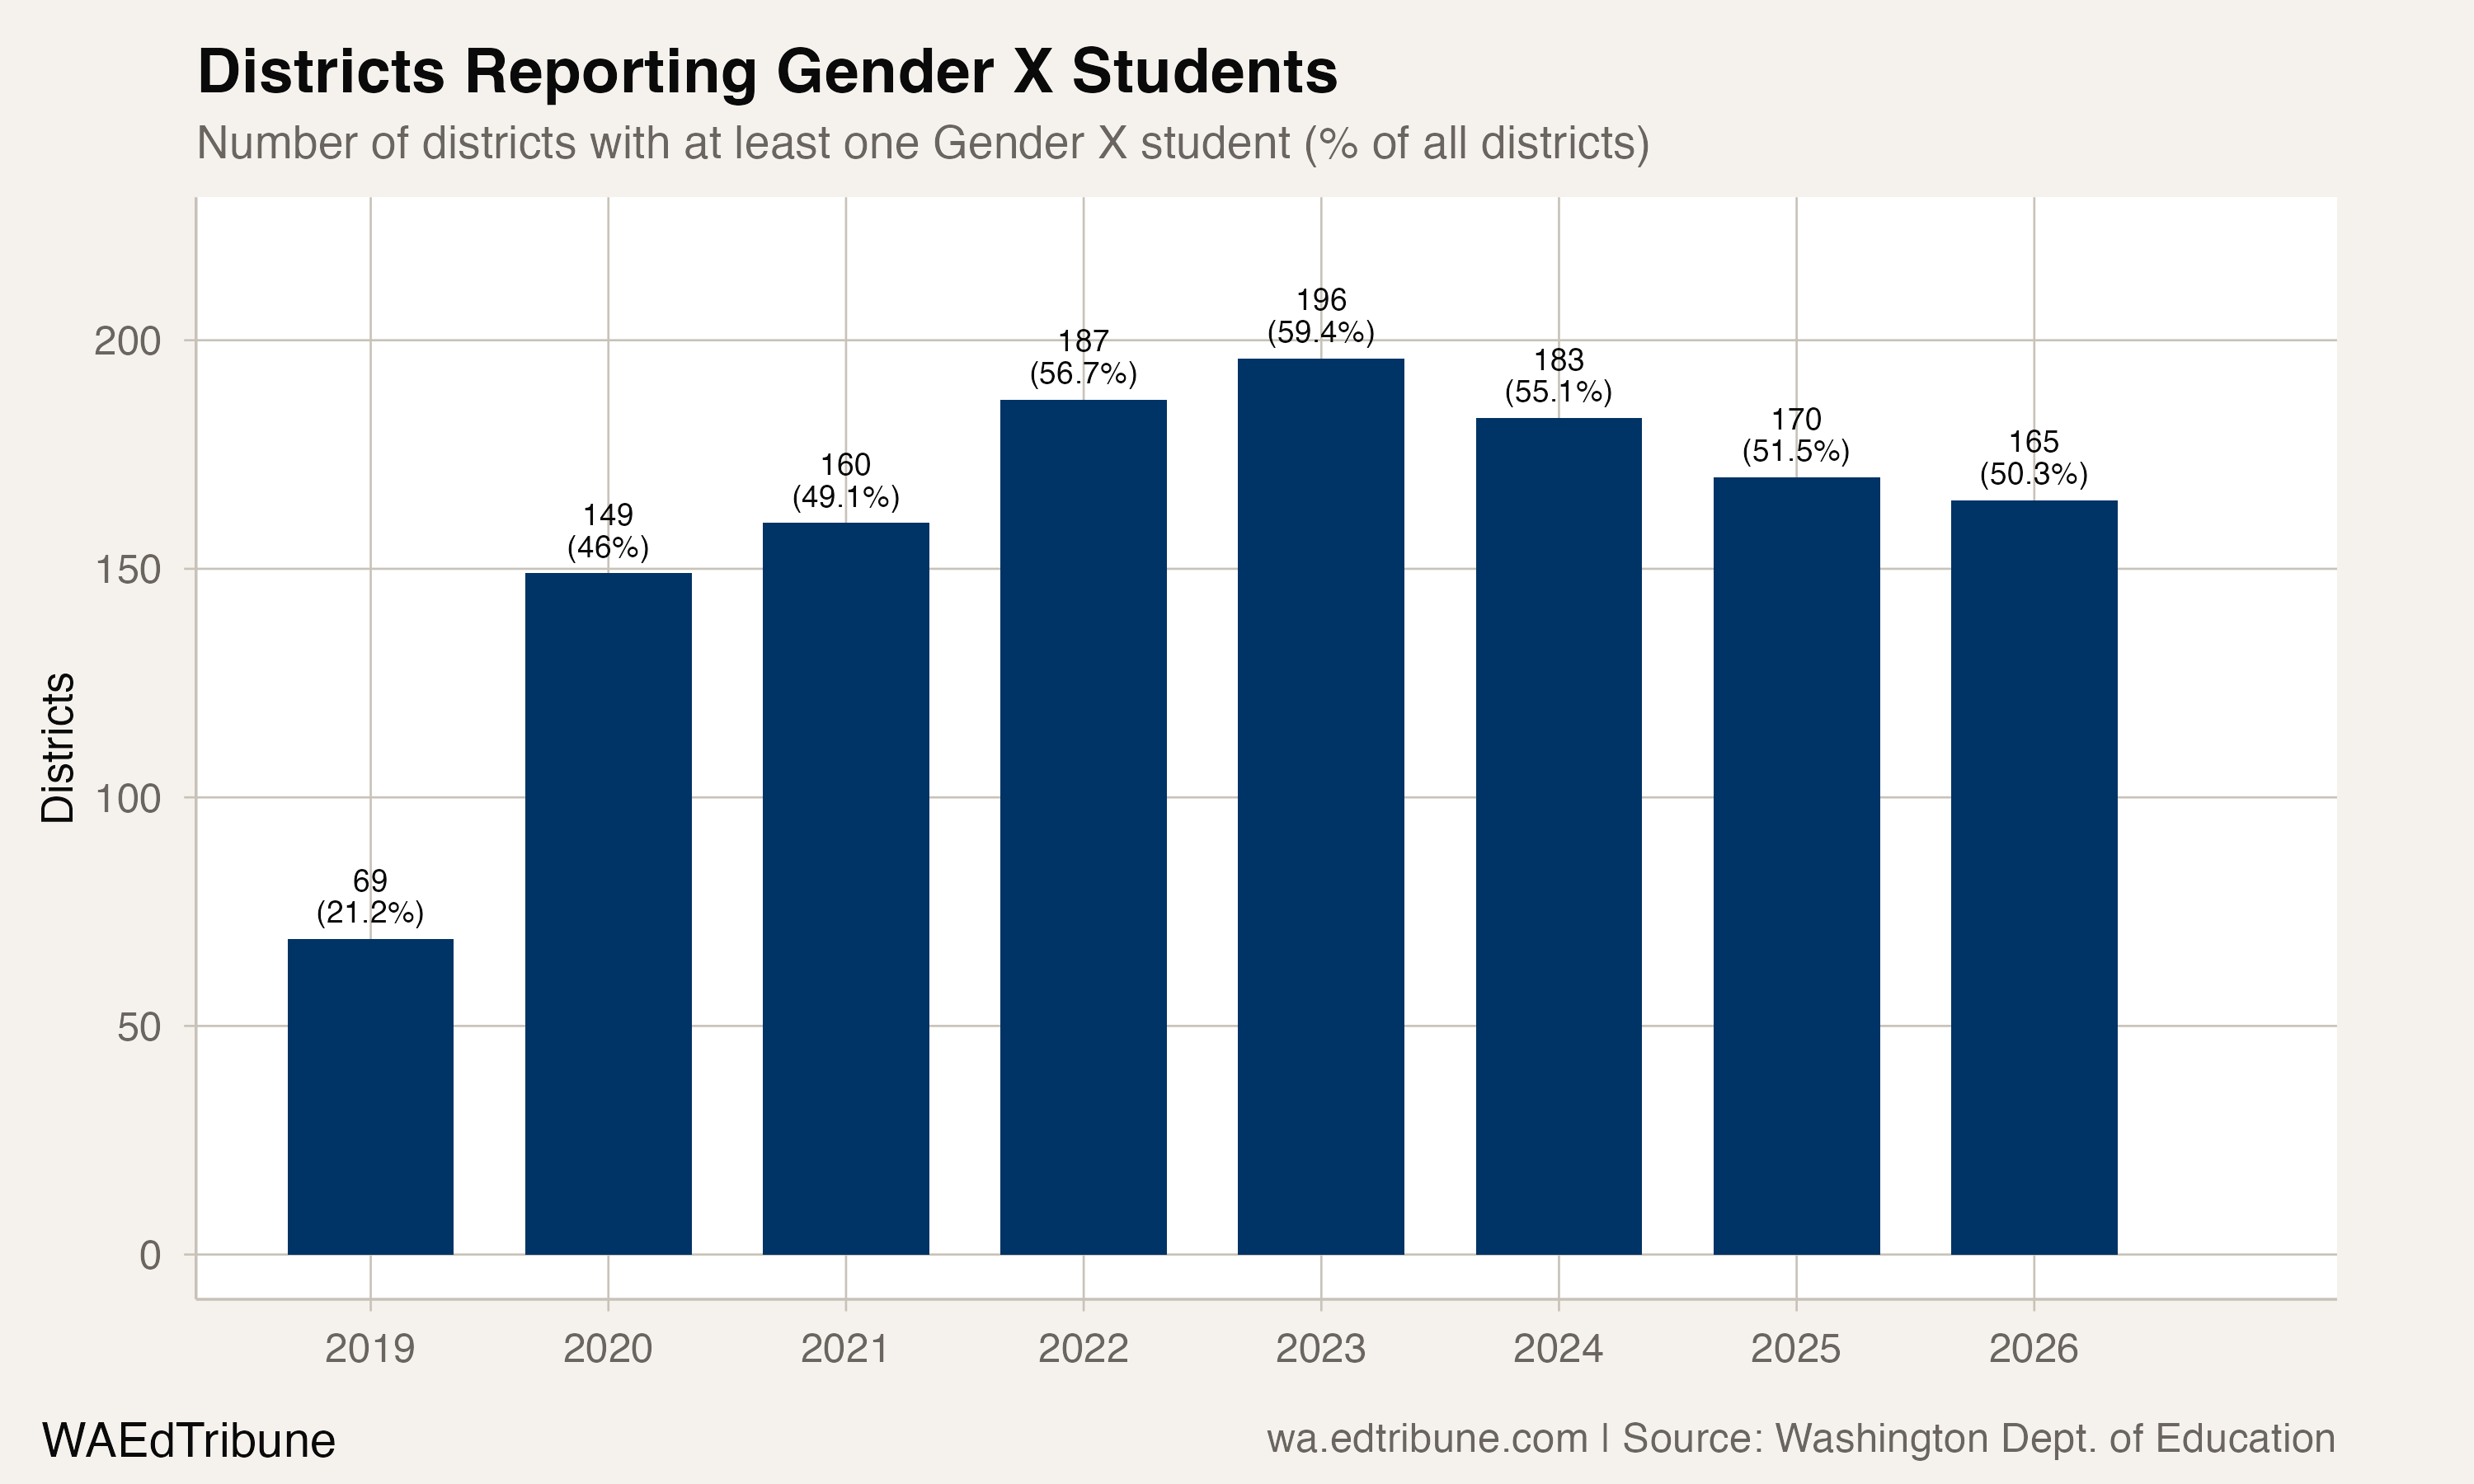
The spread of Gender X reporting across districts tells a parallel story. In 2018-19, just 69 of 325 districts (21.2%) reported any Gender X students. By 2022-23, that number had climbed to 196 of 330 (59.4%). But then it, too, began retreating: 183 districts in 2024, 170 in 2025, and 165 of 328 in 2026. Thirty-one districts stopped reporting Gender X students over three years, even as the category remained available in CEDARS.
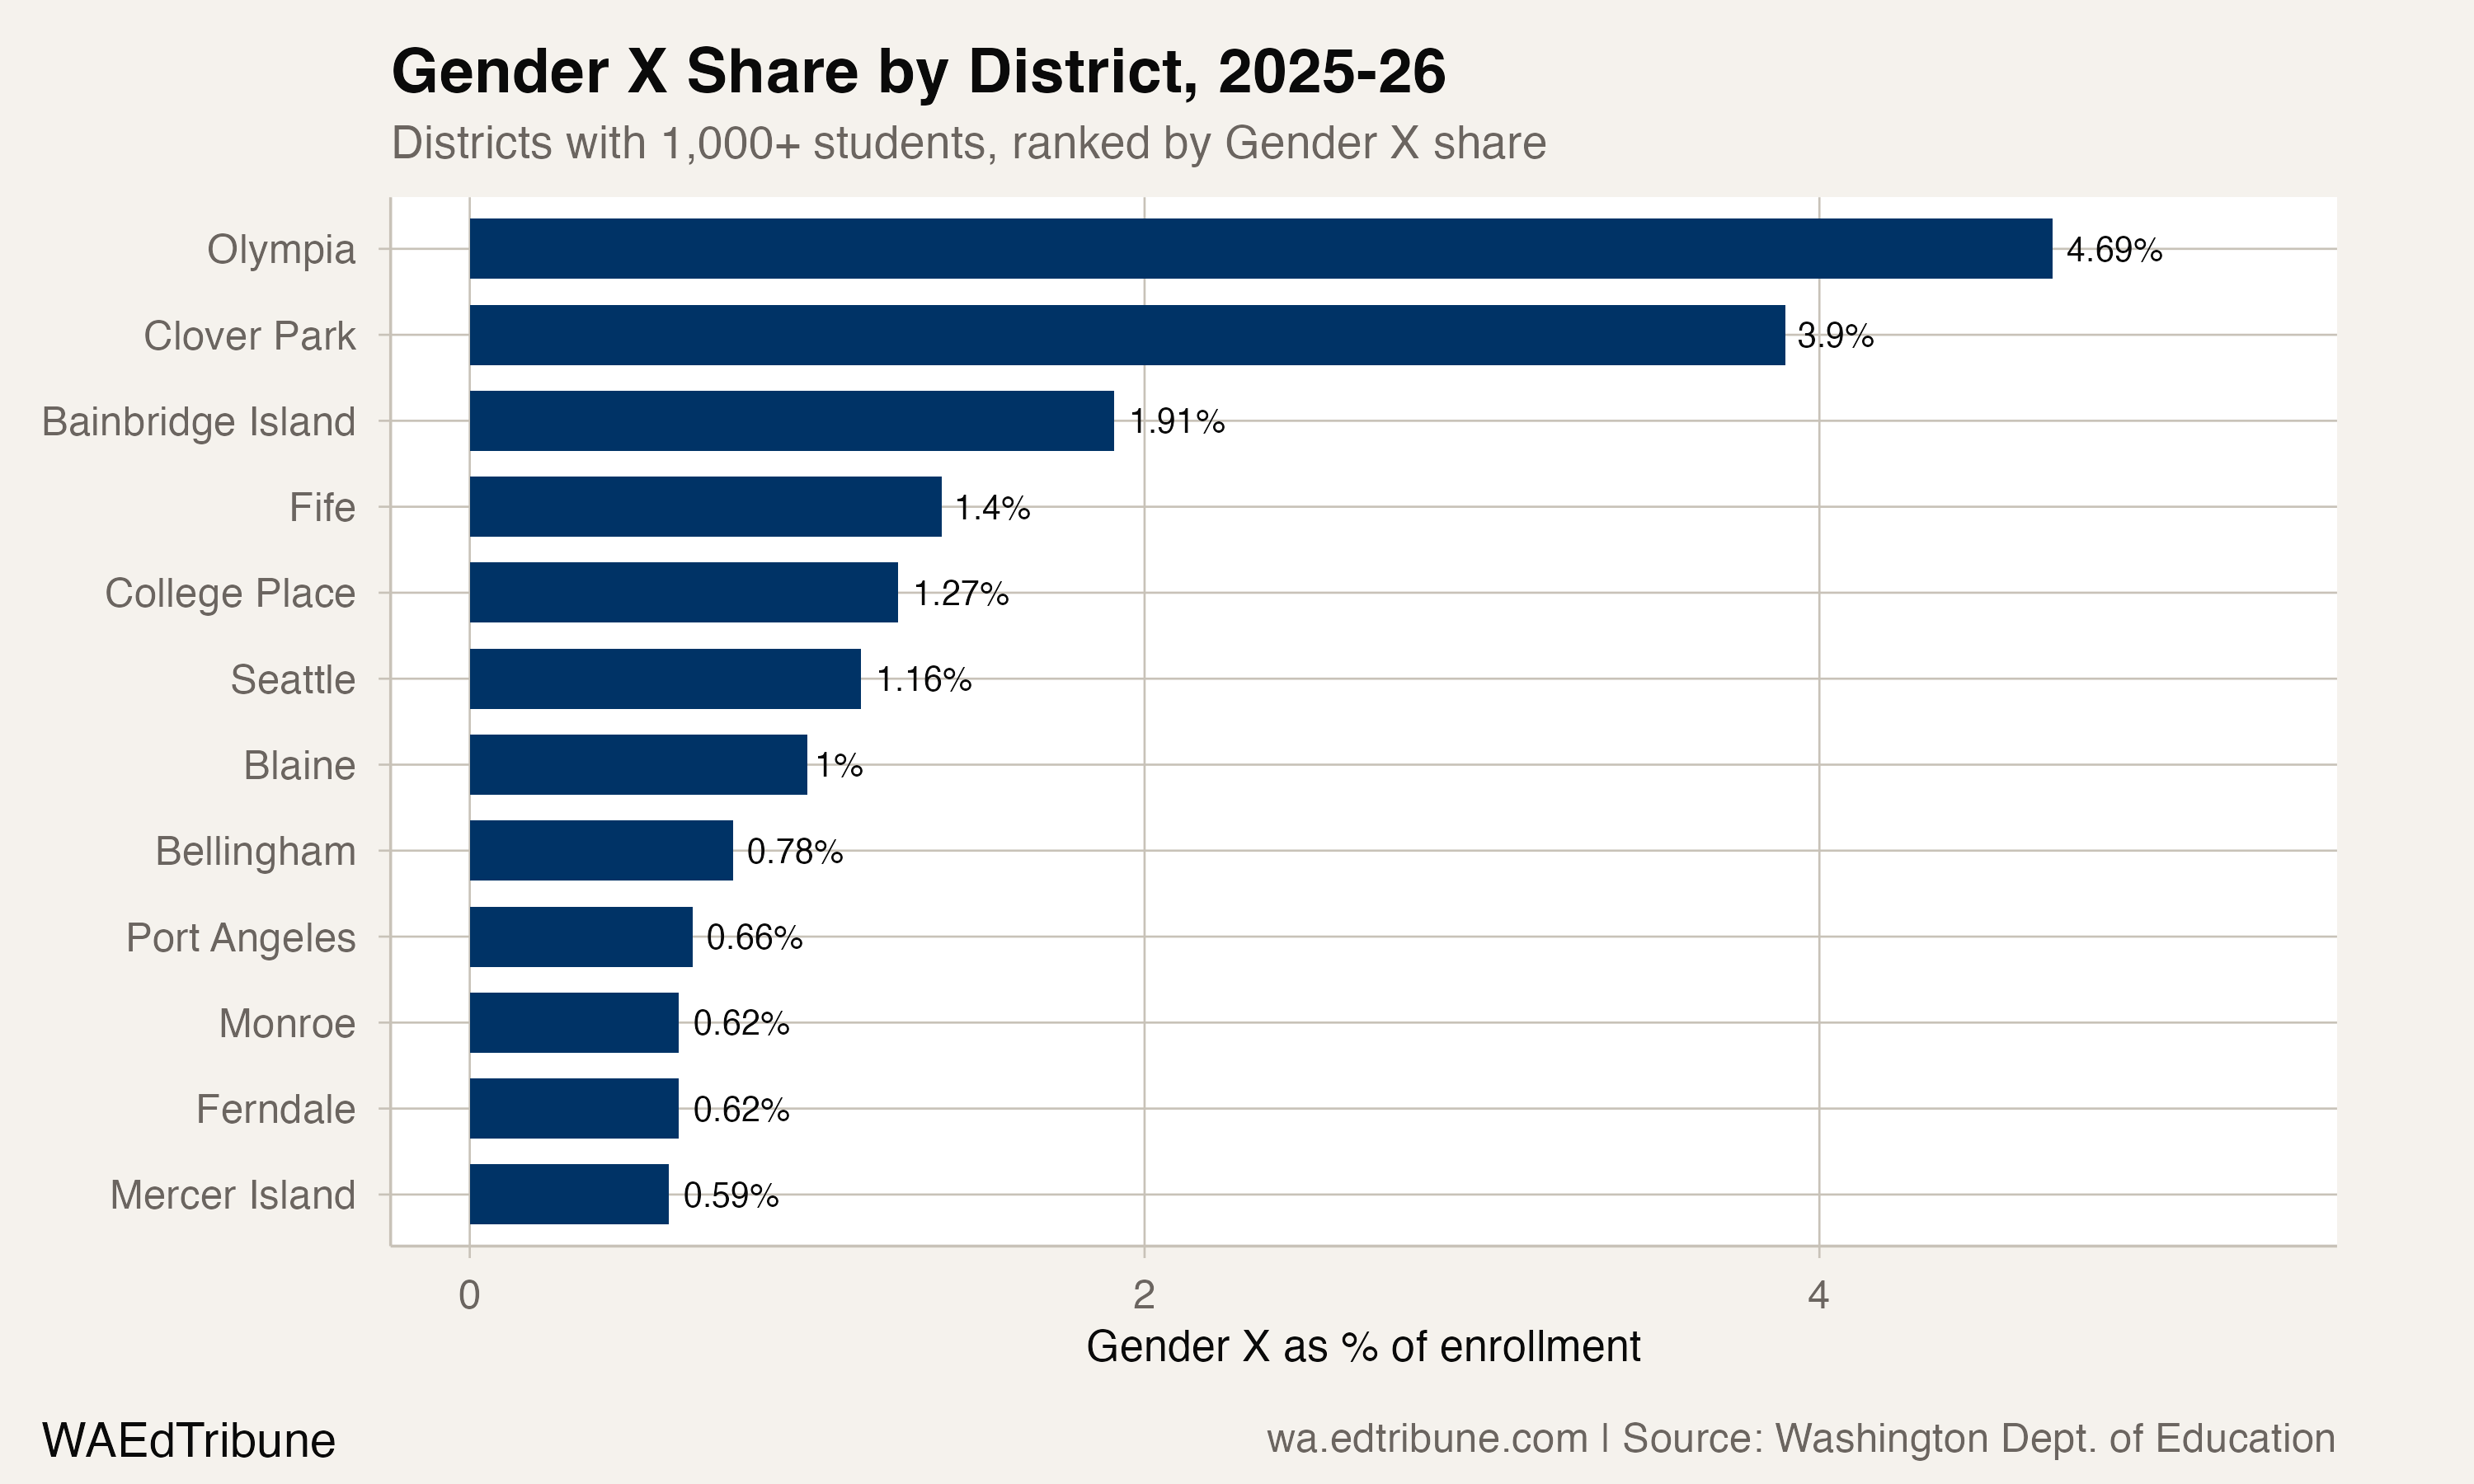
The geographic distribution is uneven. Olympia↗ET leads all districts in Gender X share at 4.69%, with 454 of its 9,672 students identified as Gender X in 2025-26. Clover Park↗ET, near Joint Base Lewis-McChord in Lakewood, has the second-highest rate at 3.90% (498 students out of 12,777) and is the only large district where Gender X counts are still climbing, rising from one student in 2019 to 498 in 2026.
Seattle↗ET, the state's largest district with 50,898 students, has the most Gender X students by count (591) but a lower rate of 1.16%. Seattle's Gender X enrollment peaked at 658 in 2024-25 and has since declined by 10.2%. Bainbridge Island↗ET, a smaller district of 3,461 students, reports a rate of 1.91%, the third highest among districts above 1,000 students.
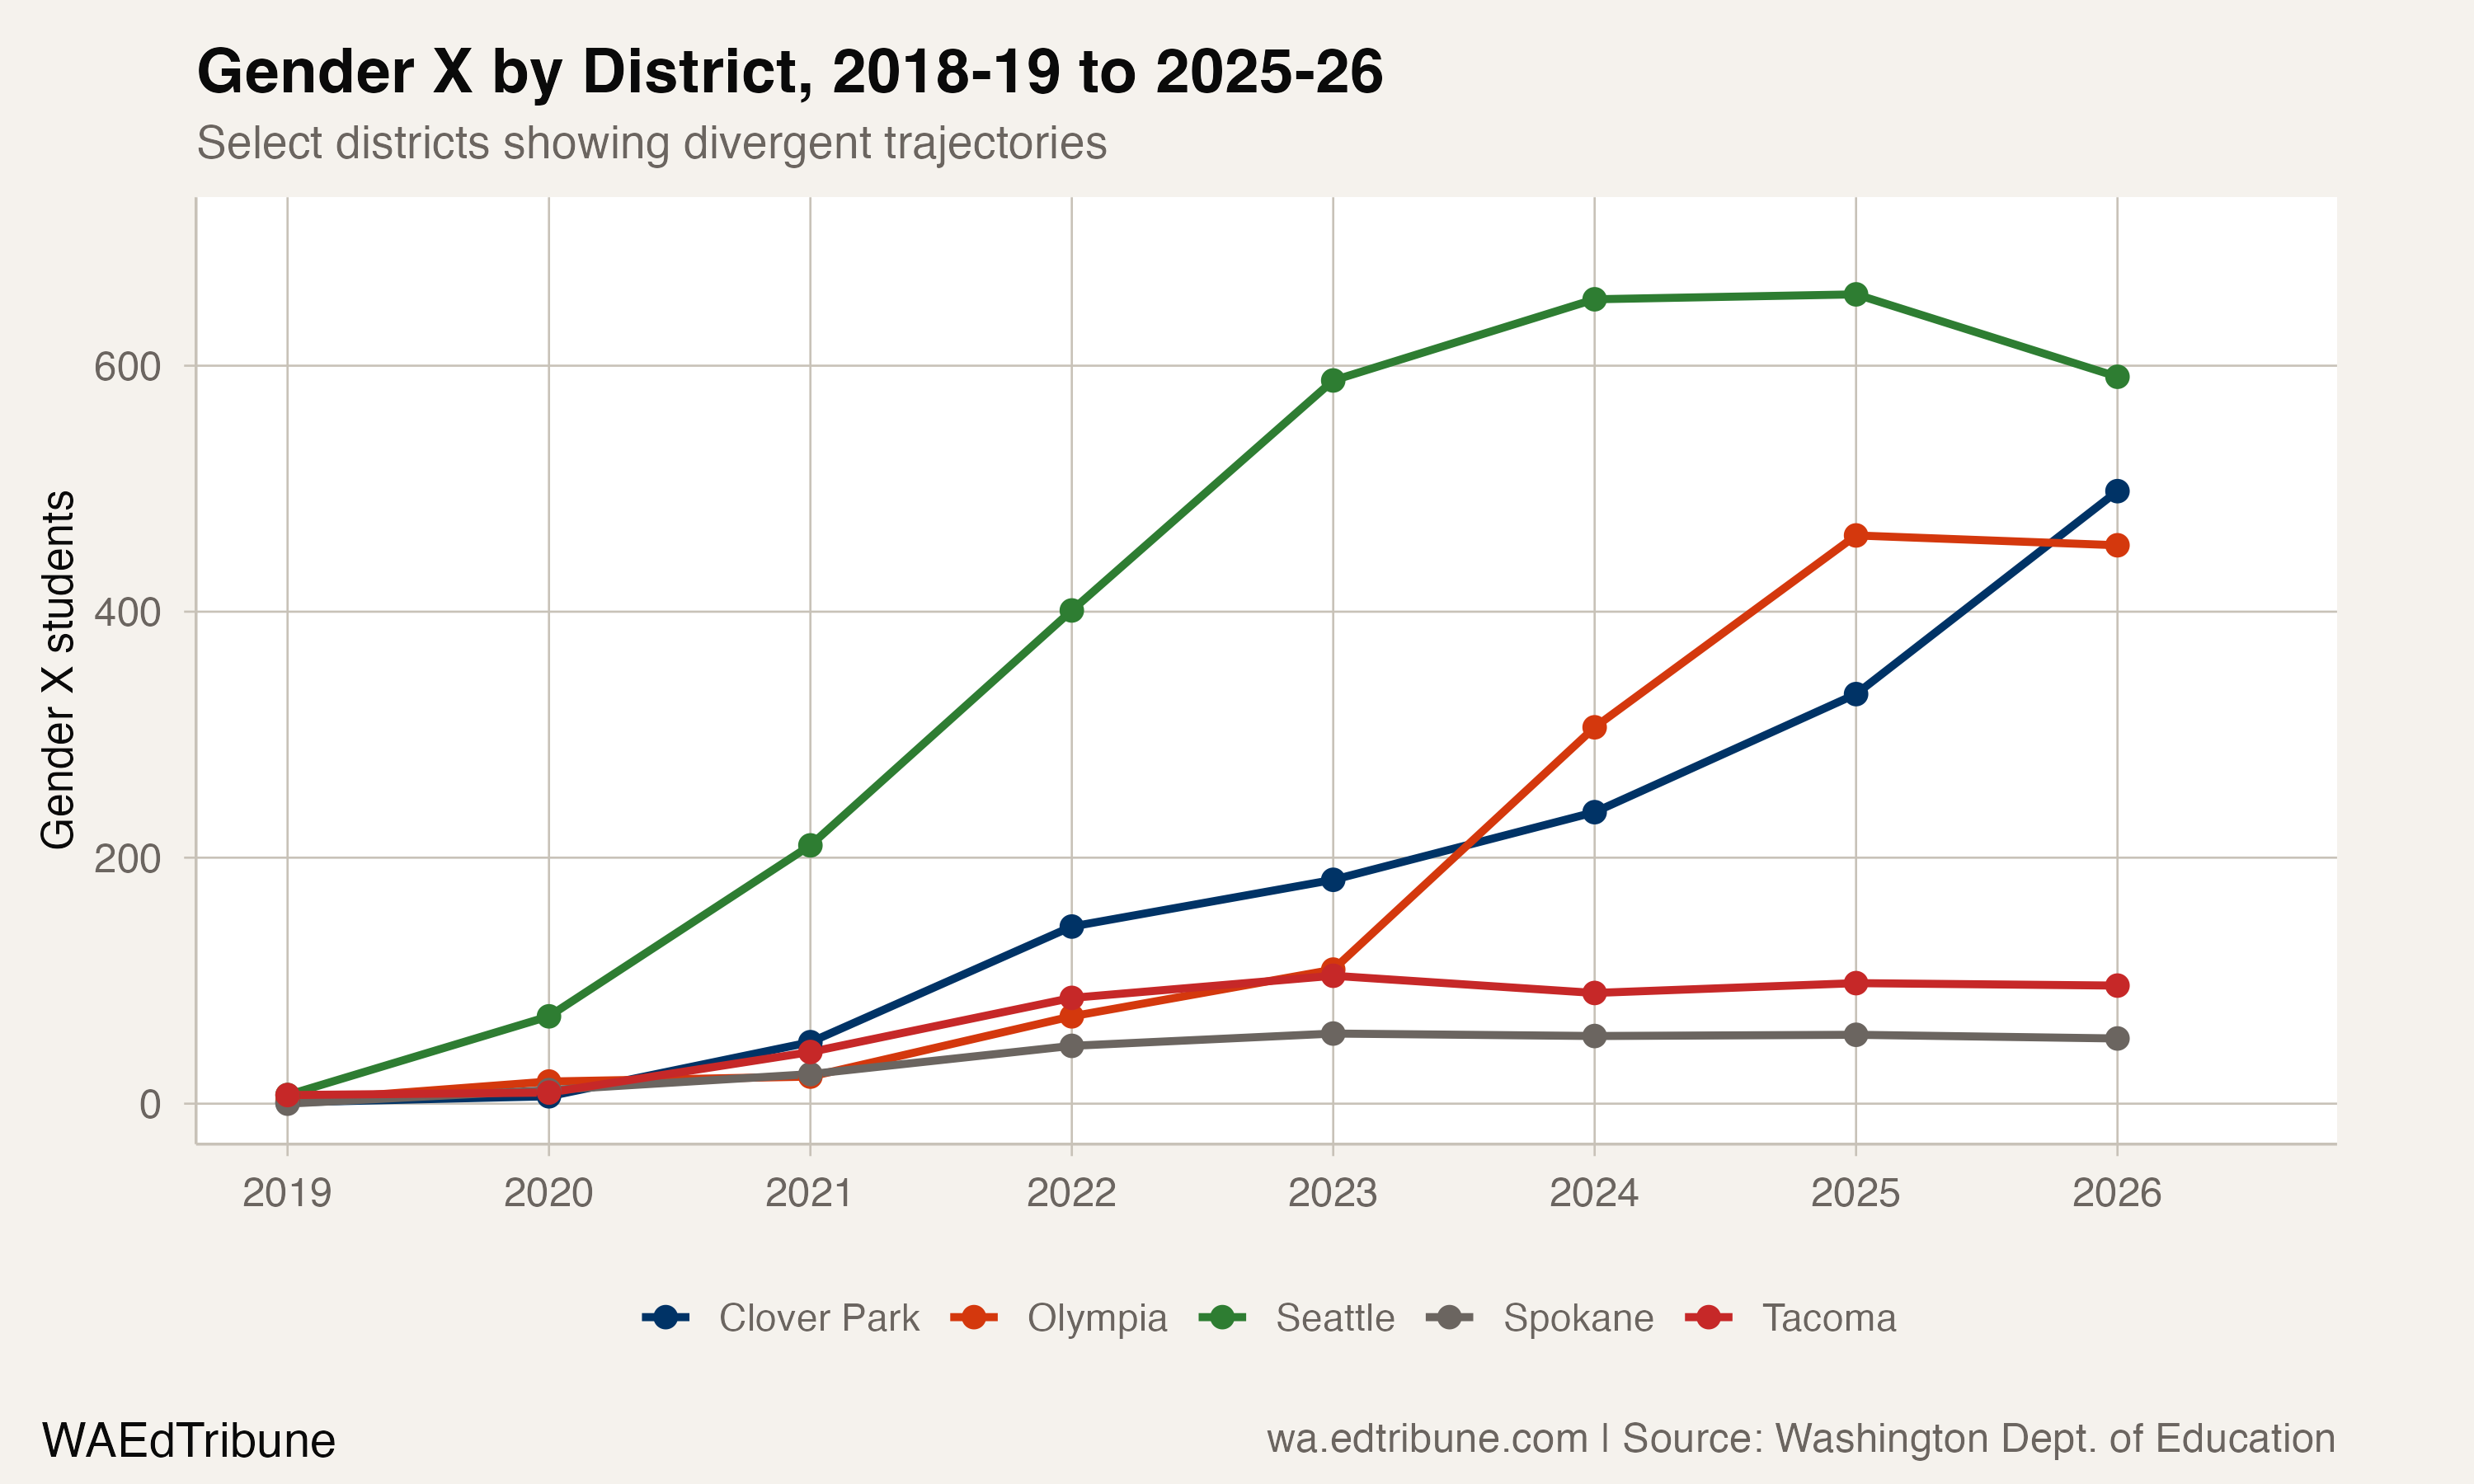
The divergent trajectories
The five-district comparison reveals strikingly different patterns. Seattle climbed rapidly from seven students in 2019 to 654 in 2024 before declining. Tacoma↗ET plateaued around 90 to 104 since 2022. Spokane↗ET leveled off near 55 in 2023 and has drifted slightly downward. Clover Park, by contrast, has grown every single year since 2019, accelerating from 144 in 2022 to 498 in 2026.
Olympia's trajectory is the most dramatic among mid-sized districts. After reporting just two Gender X students in 2019, it jumped to 306 in 2024 and 462 in 2025 before edging back to 454 in 2026. The district's 4.69% rate is more than 12 times the statewide average of 0.37%.
Reporting artifact or real shift?
The two-year decline invites competing explanations.
One possibility is a reporting change. The state-level Gender X total has consistently exceeded the sum of all district-level Gender X counts, with the gap narrowing from 592 in 2022 to just 73 in 2026. This suggests that how Gender X is recorded at the state versus district level has evolved, and changes in reporting methodology could depress or inflate totals without any underlying shift in student identity. The number of districts reporting Gender X students has also declined, which could reflect either fewer students identifying as nonbinary in those districts or a pullback in how actively schools record the designation.
The political environment has shifted. In February 2025, OSPI and the La Center School District clashed publicly over gender identity disclosure, with OSPI finding the district had violated state anti-discrimination laws by refusing to proactively use students' requested pronouns. The district's superintendent rejected the findings and consulted legal counsel. Citizen initiatives filed in early 2026 seek to repeal modifications to Washington's parental rights law that expanded protections for LGBTQ+ students, with more than 416,000 signatures gathered. Whether this political friction discourages some families or schools from recording a nonbinary designation is unknowable from the enrollment data.
A third possibility: the pattern may simply reflect natural variation in an emerging category. Gender X reached 0.45% of enrollment in 2024 and has since settled to 0.37%. In a population of 1.1 million students, these are small shares, and year-to-year fluctuation is expected as schools and families navigate a relatively new reporting option.
A dataset with few peers
Washington is one of roughly 10 states plus the District of Columbia that allow districts to report a third gender category for students, though approaches vary. Oregon uses "X," California uses "nonbinary," Rhode Island uses "other," and Utah offers "transgender" and "prefer not to identify." Few states have data reaching back as far as Washington's 2015 baseline, making this one of the longest continuous datasets of nonbinary student identification in the country.
The federal trajectory has moved in the opposite direction. The U.S. Department of Education proposed removing transgender and nonbinary categories from its mandated Civil Rights Data Collection, which would eliminate the federal government's ability to track these students at scale. That decision makes state-level data like Washington's more important as the only longitudinal measure available.
The 2026-27 test
The 2026-27 school year will clarify whether the two-year decline is a correction from an unsustainable peak or the beginning of a sustained reversal. Two signals matter. First, the district count: if the number of districts reporting Gender X students continues to fall, the decline is more likely a reporting phenomenon than a shift in student identity. Second, Clover Park's trajectory: with 498 Gender X students and a 3.90% rate in a district of 12,777, its continued growth while peers decline deserves scrutiny, whether it reflects more inclusive recording practices, community demographics near a military installation, or something else entirely.
The broader question is whether Washington's Gender X data will survive the political headwinds now pressing against it. A dataset that took 12 years to build, and that has no federal equivalent, could become less reliable not because students changed but because the systems recording them did.
Detailed code that reproduces the analysis and figures in this article is available exclusively to EdTribune subscribers.
Discussion
Sign in to join the discussion.
Loading comments...