In Federal Way↗ET, one in three students is learning English. Sixteen years ago, it was one in eight. The district did not move. The district did not change its boundaries. The students changed.
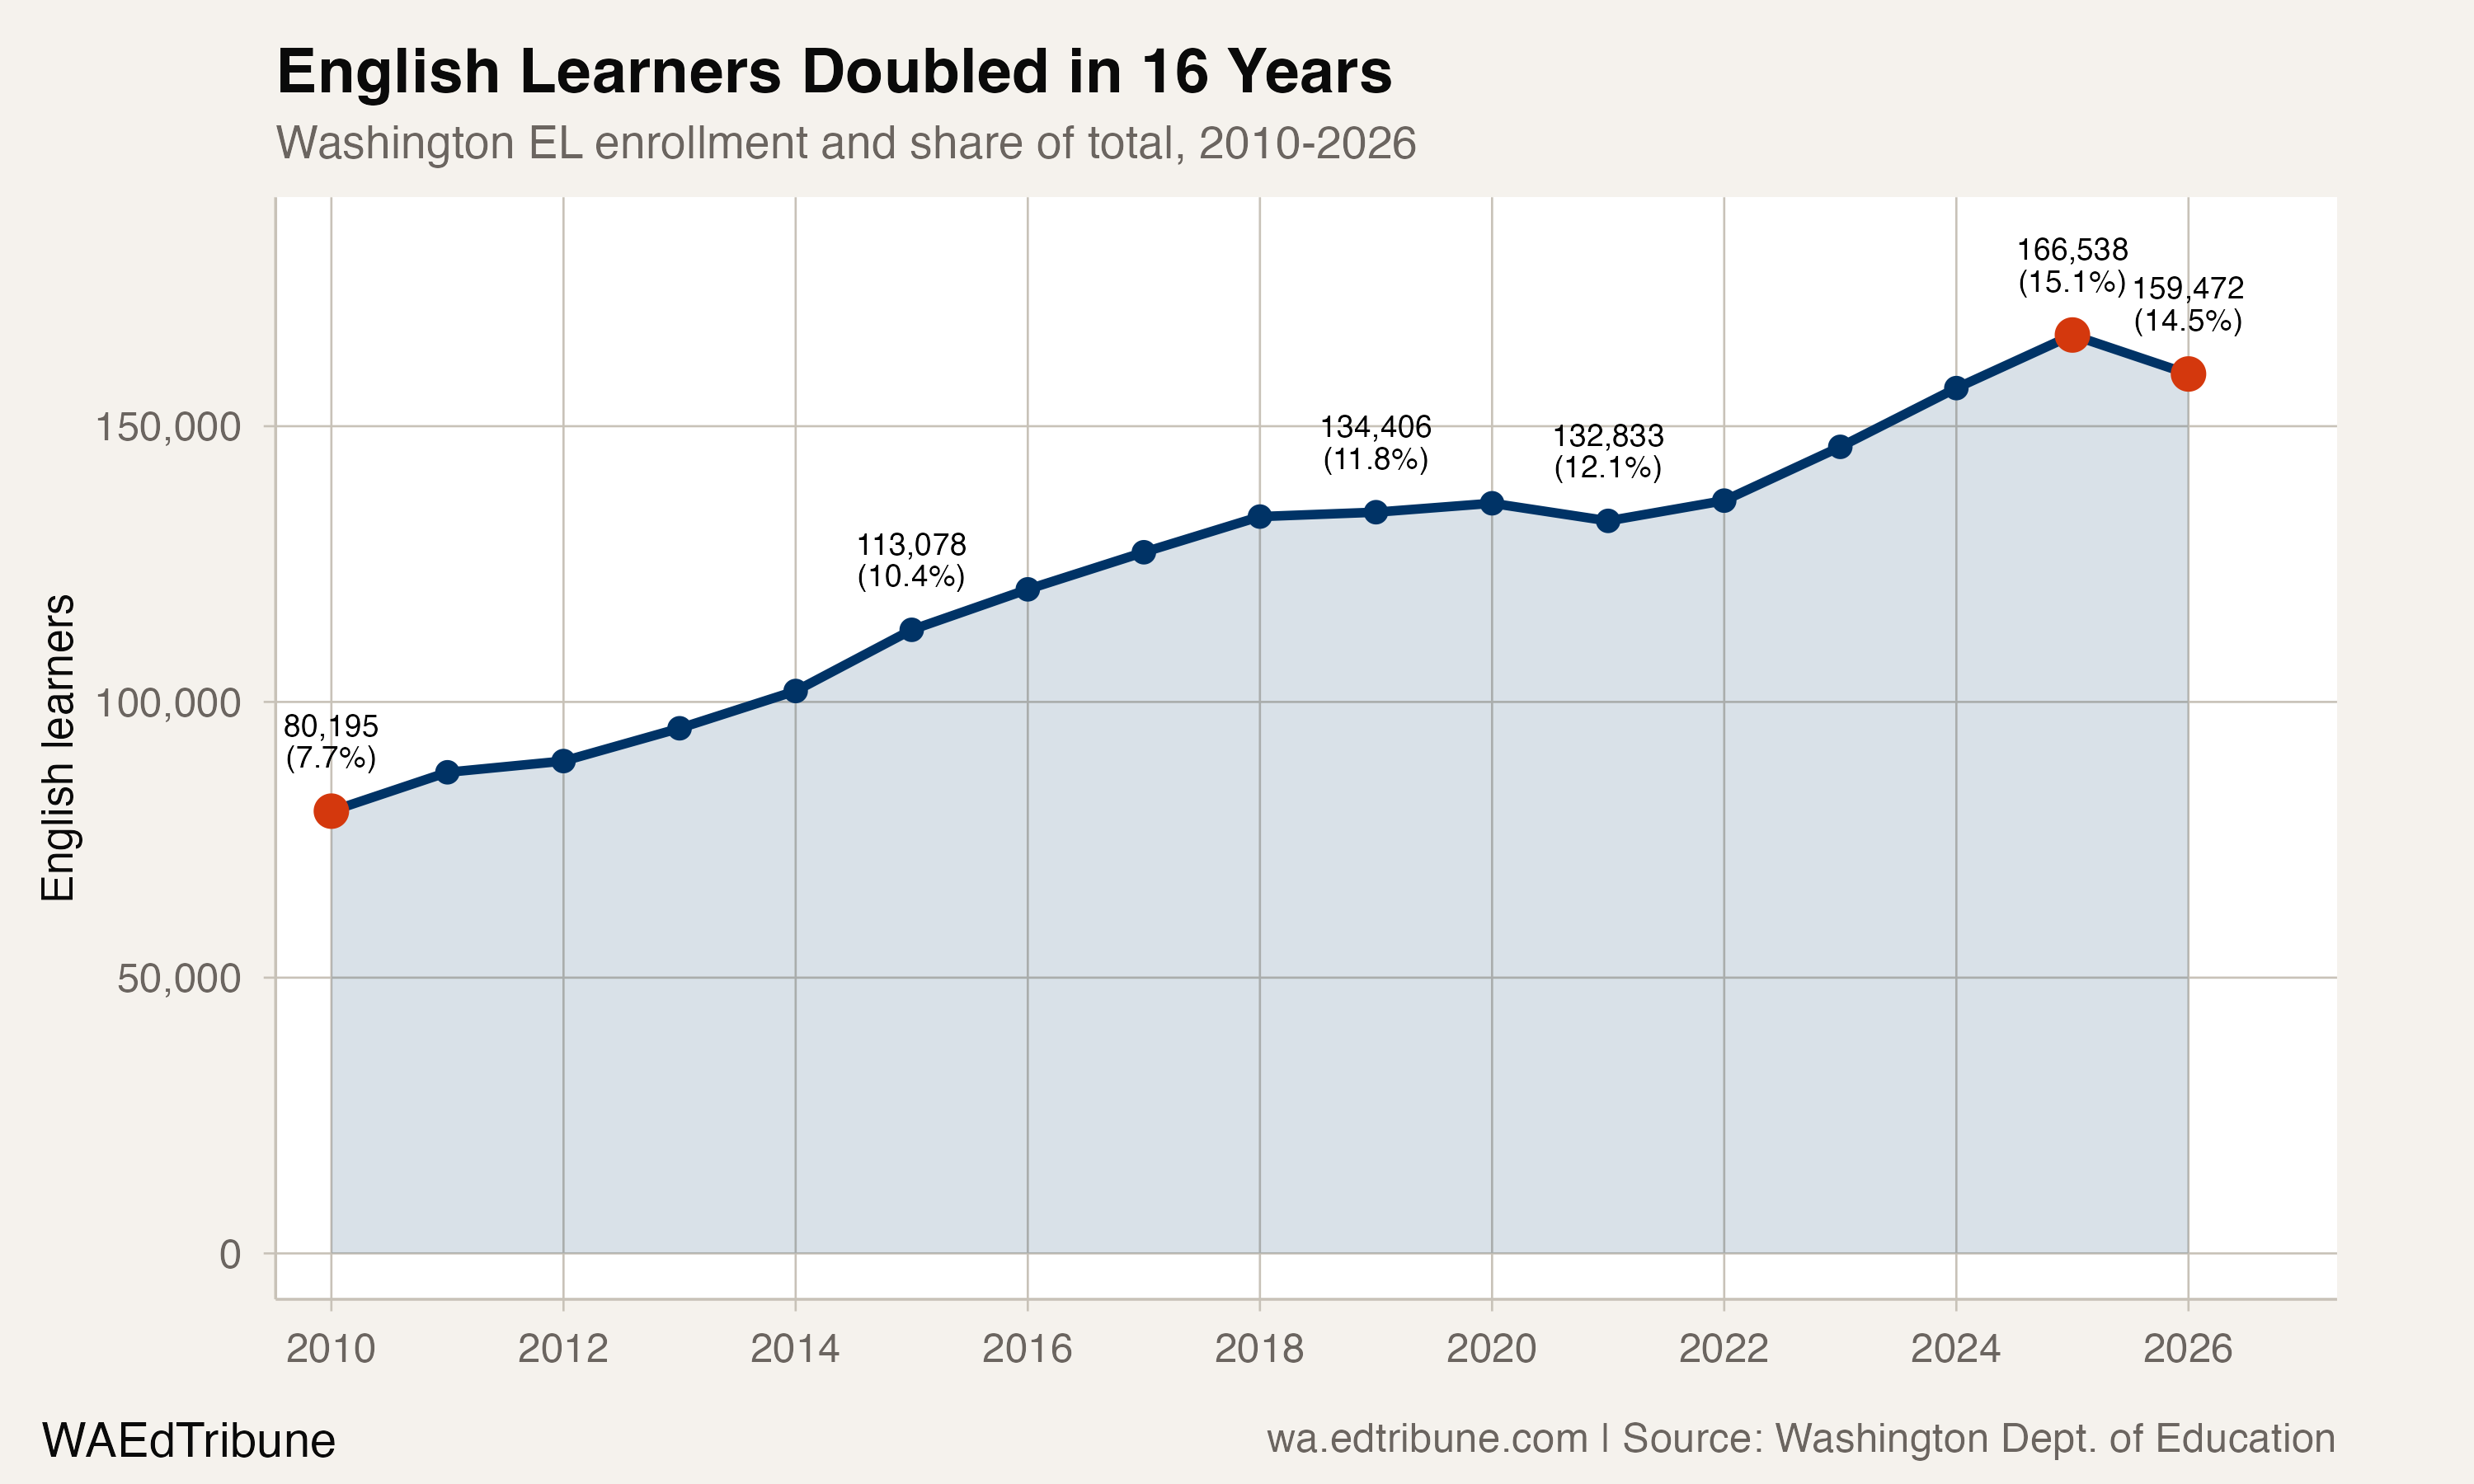
Across Washington, the English learner population has nearly doubled since 2010, climbing from 80,195 students (7.7% of enrollment) to 159,472 (14.5%) in 2025-26. That 98.9% increase dwarfs the 5.9% growth in total enrollment over the same period. The state now has one English learner for every seven students, up from one in 13. Those 79,277 additional students, a population larger than any single school district outside the top 10, represent one of the most consequential shifts in how Washington schools operate day to day.
Two corridors, one pattern
The growth landed unevenly. Two distinct geographies absorbed most of it: the agricultural Yakima Valley and the suburban ring south of Seattle.
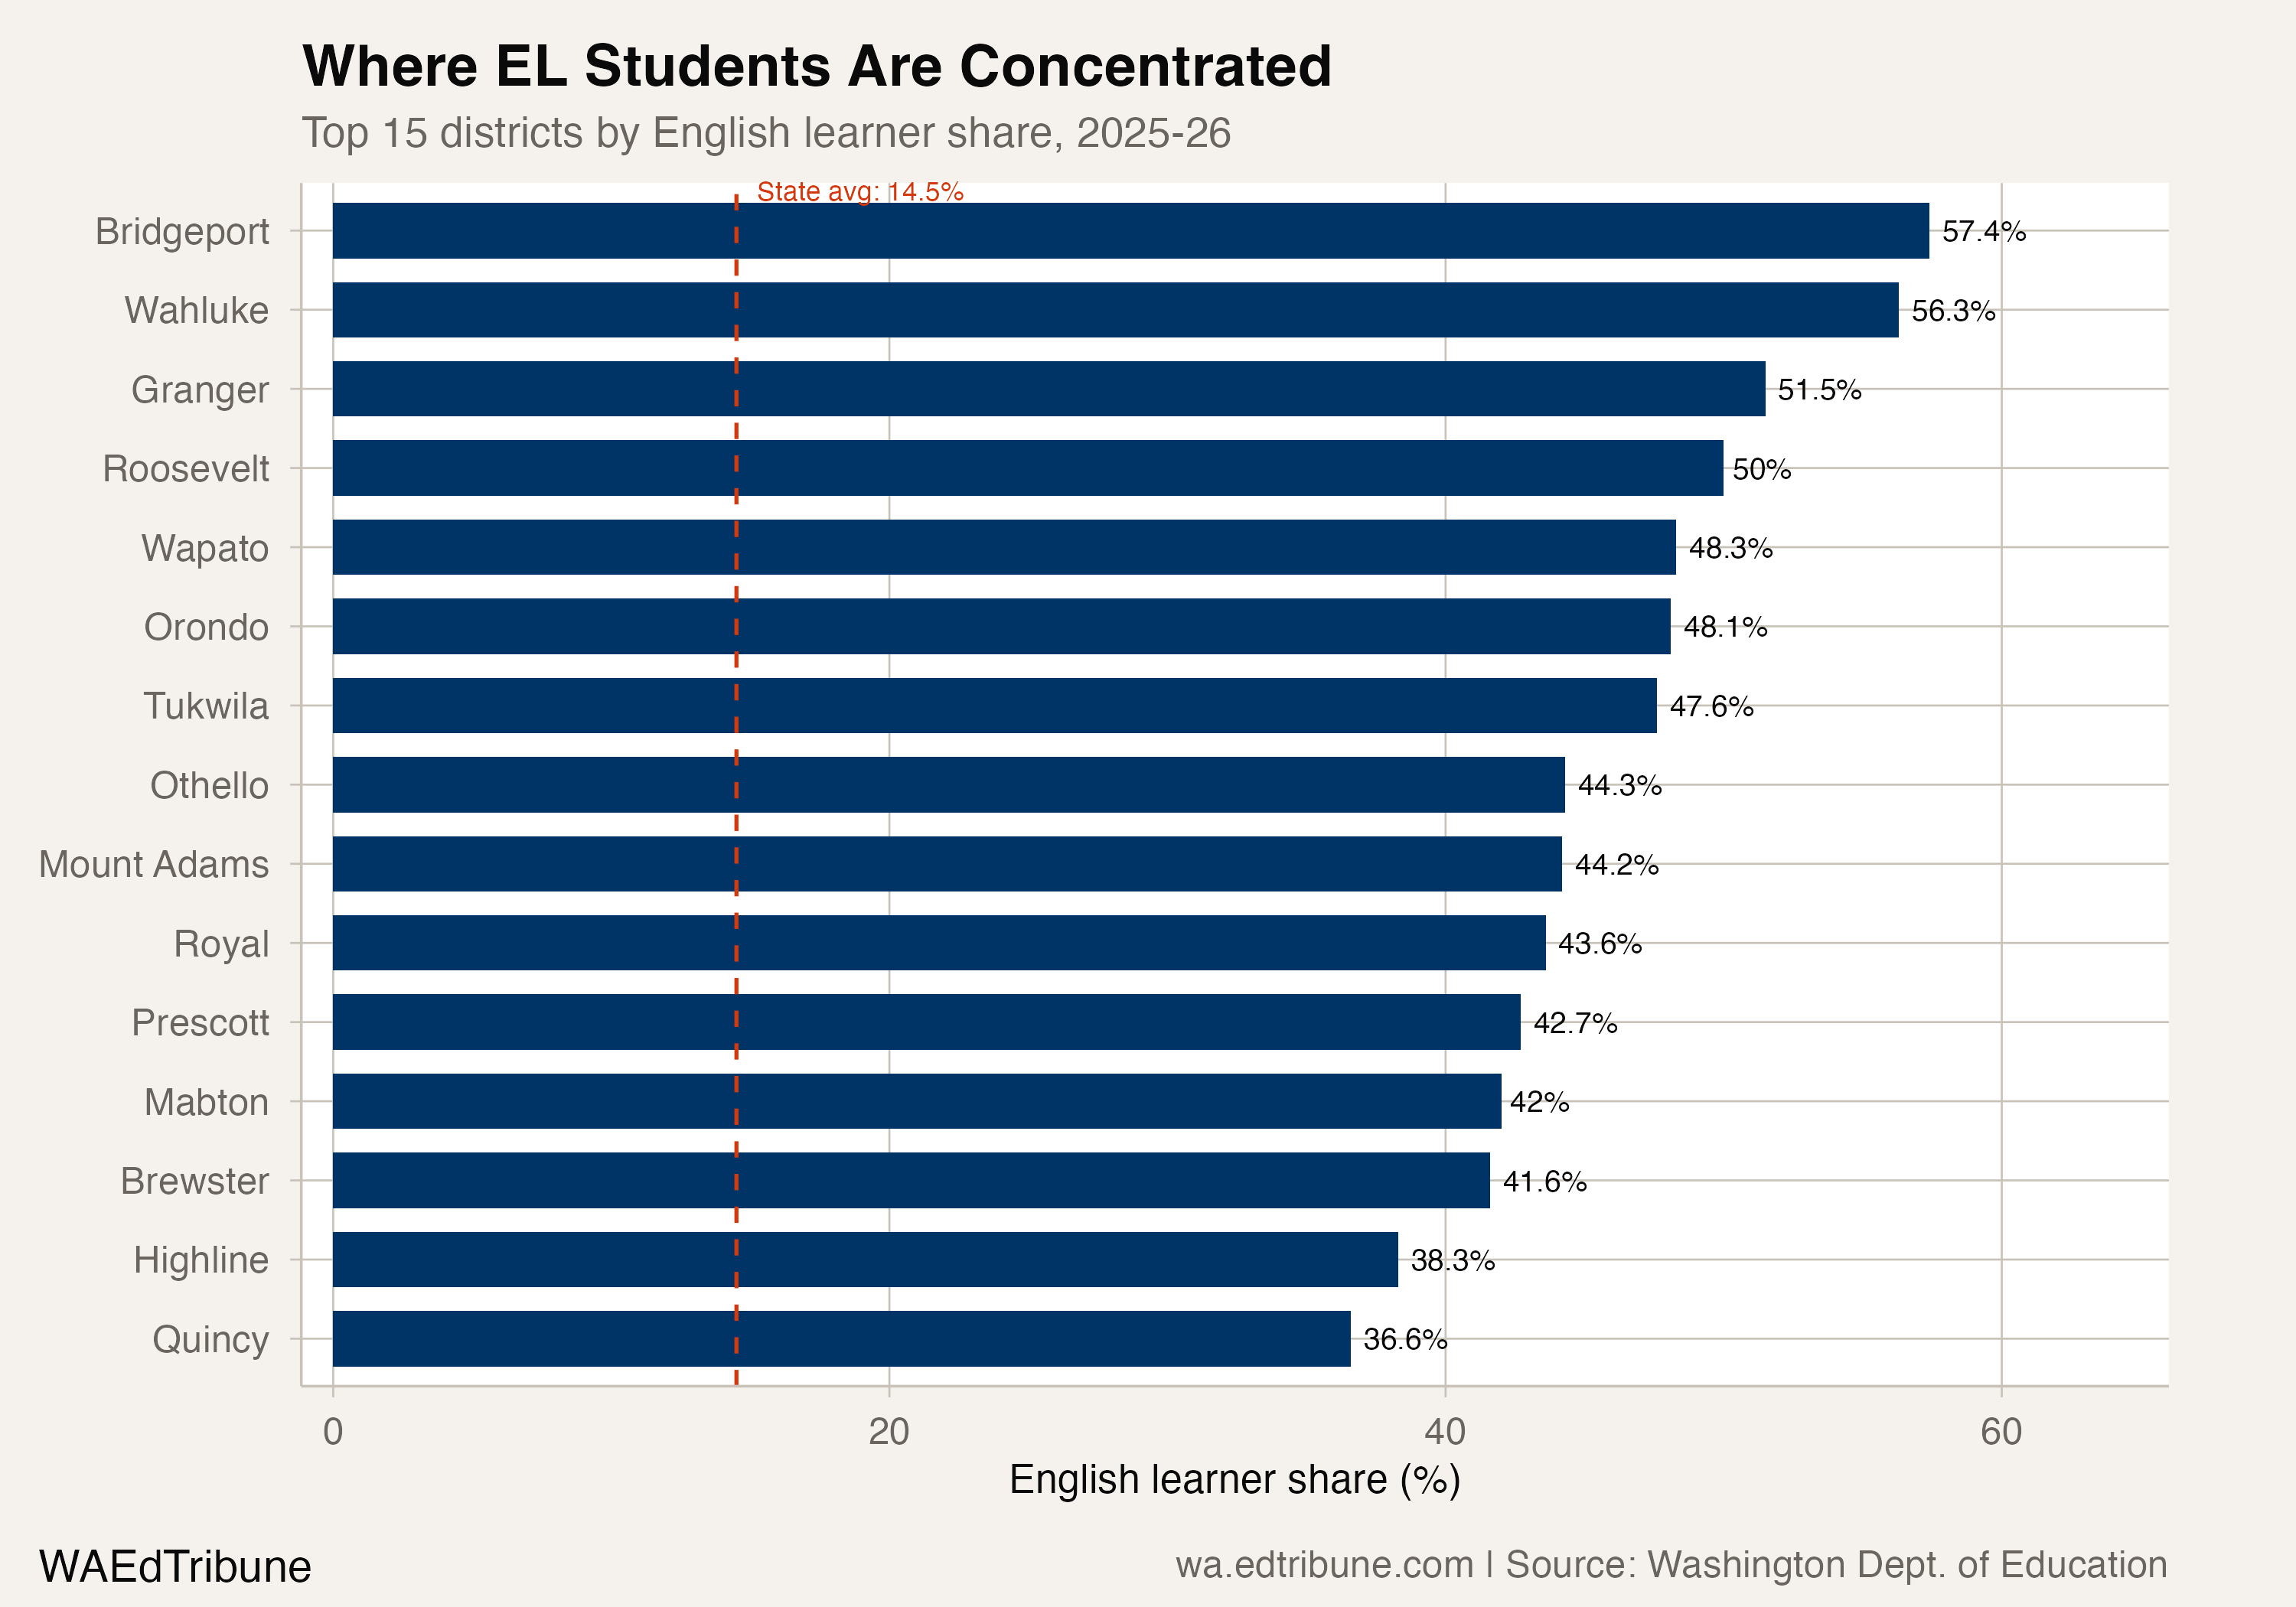
In the Yakima Valley, English learners have long been present in large numbers, but the concentrations deepened. Bridgeport↗ET went from 27.9% to 57.4% EL. Wapato↗ET more than doubled its share, from 23.7% to 48.3%. Granger↗ET crossed the majority threshold at 51.5%. Thirteen Washington districts now have English learner shares above 40%, and most are agricultural communities in central and eastern Washington where seasonal labor and permanent settlement patterns overlap.
The South King County story is different in kind. These are not rural districts with long histories of farmworker families. Kent↗ET, Federal Way, and Auburn↗ET were 12-15% EL in 2010. All three now exceed 30%. Highline↗ET, already at 20.8%, climbed to 38.3%.
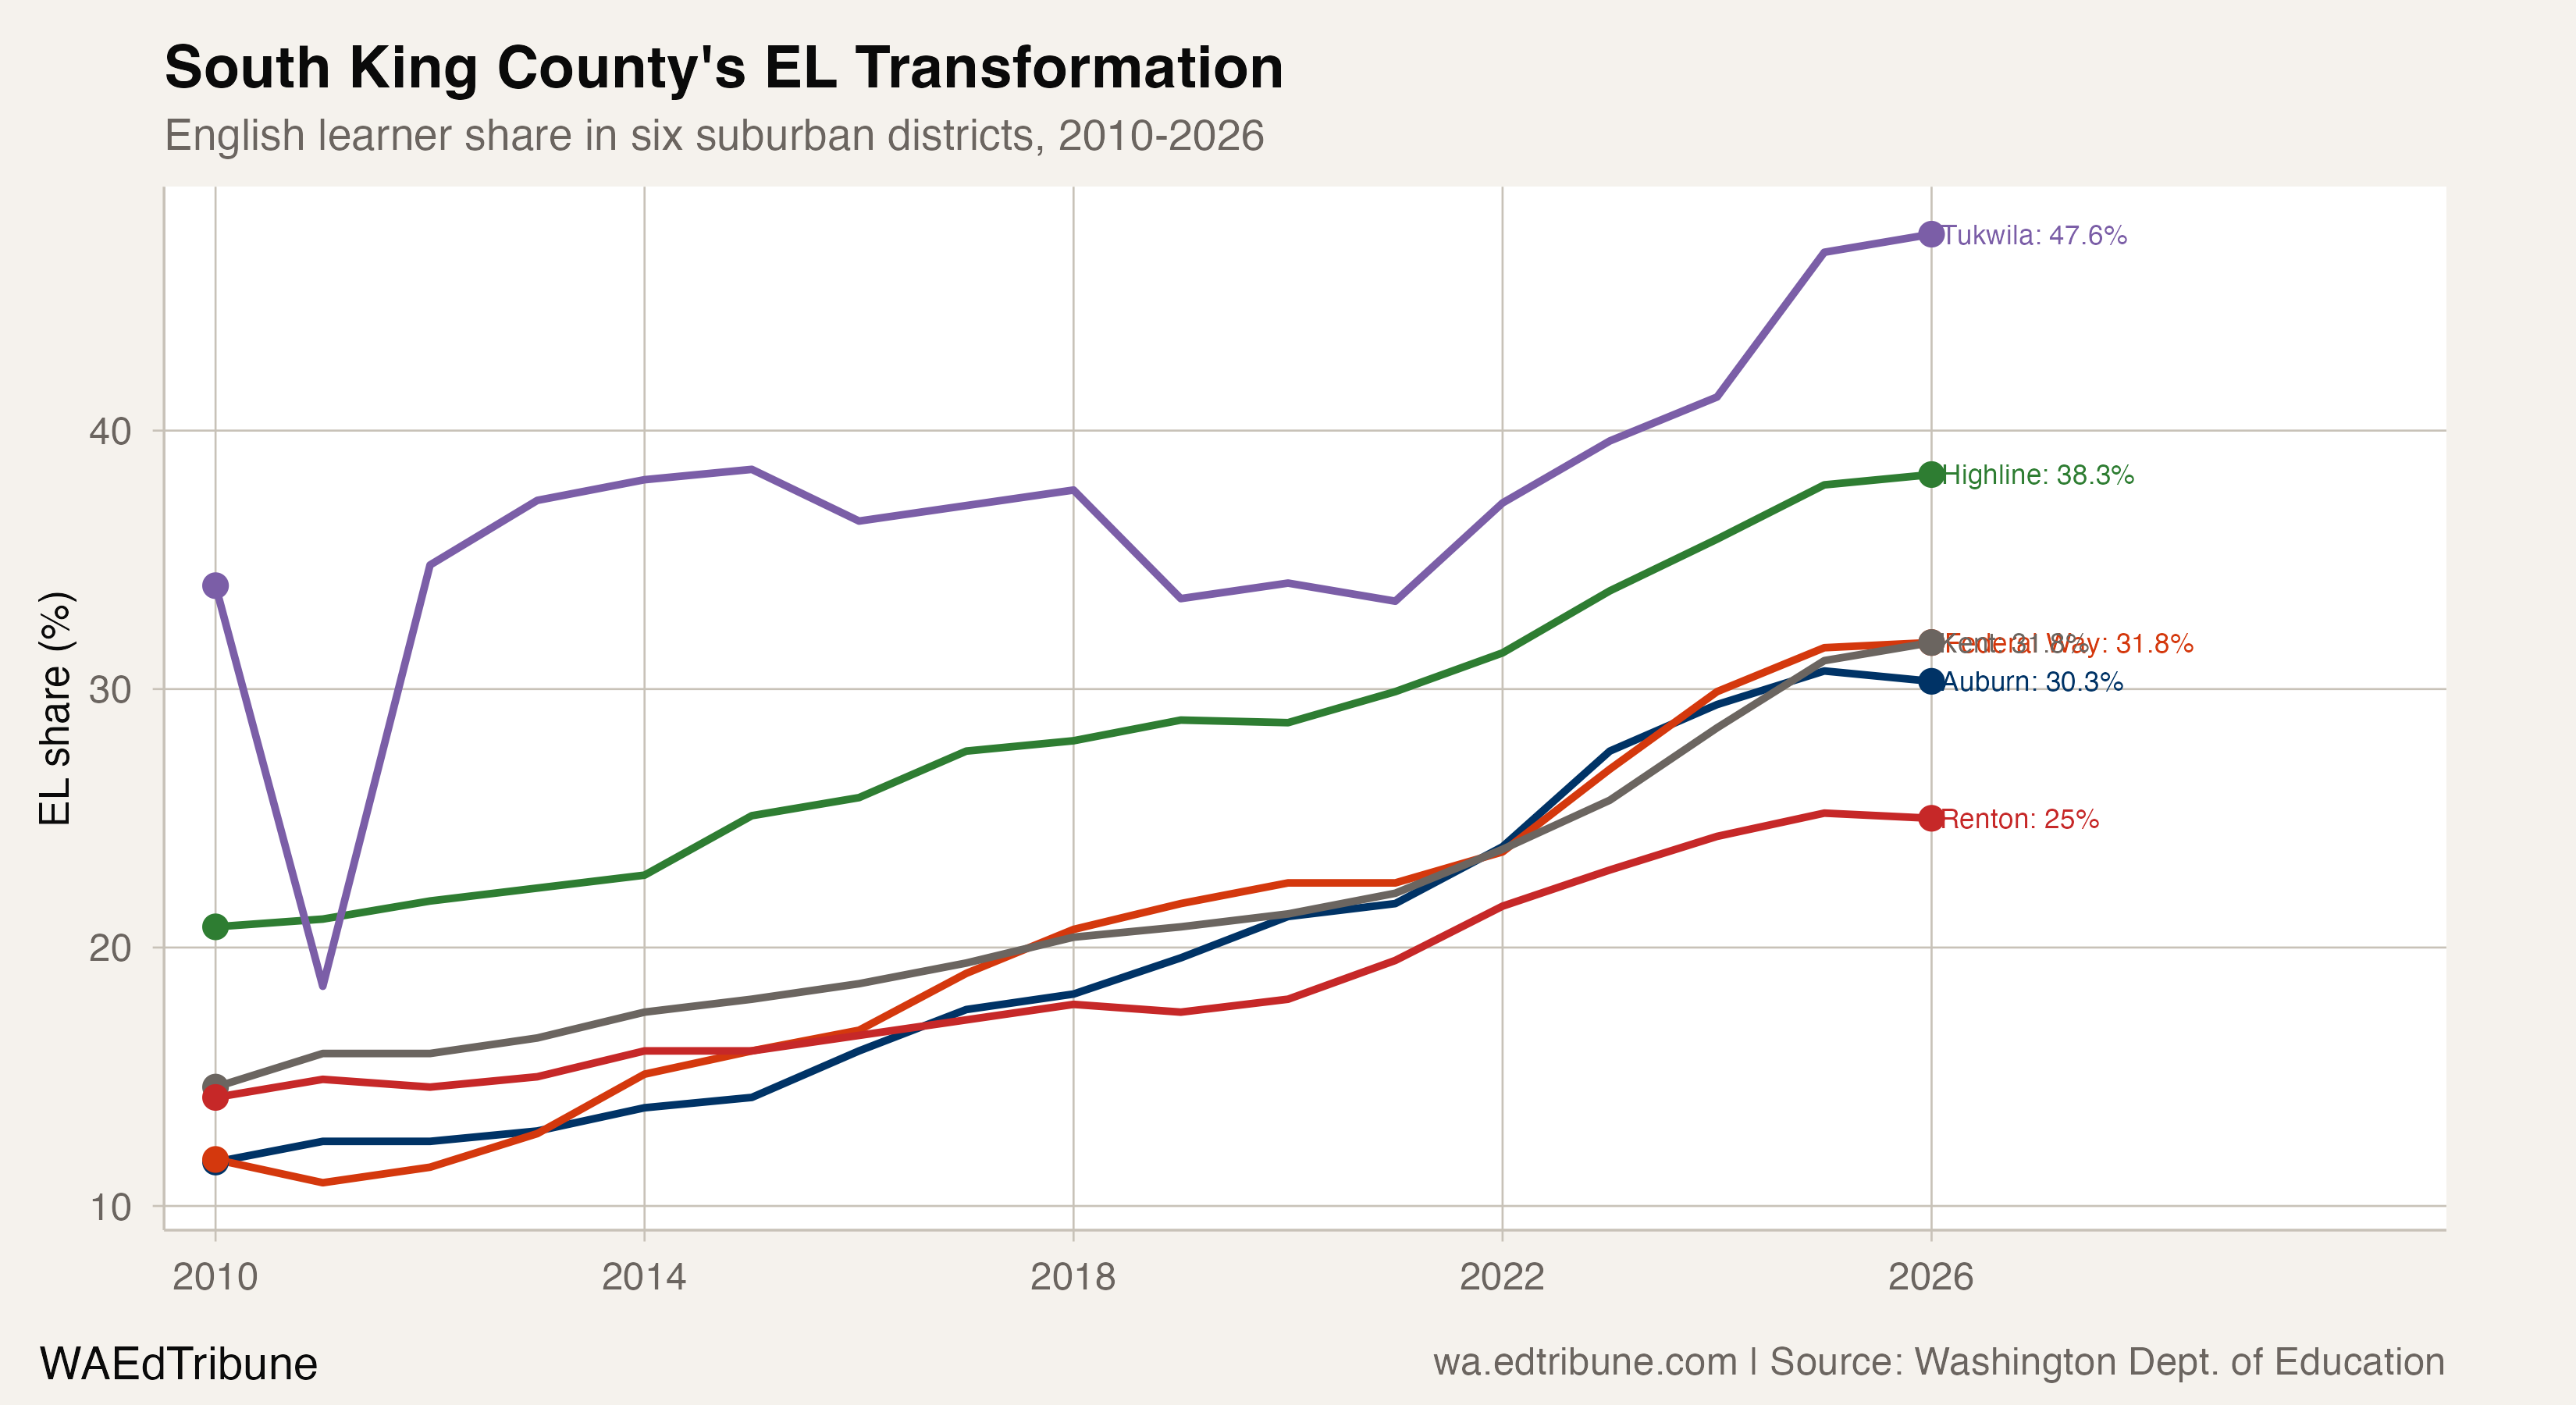
Kent went from 3,937 English learners to 8,076. Federal Way from 2,634 to 7,079, a 168.8% increase. Auburn nearly tripled, from 1,684 to 5,466. Tukwila↗ET, already a gateway district in 2010 at 34.0% EL, now stands at 47.6%, making it the only suburban district in Washington where nearly half the student body is learning English.
The post-COVID acceleration
The trajectory was not constant. Three eras define it.
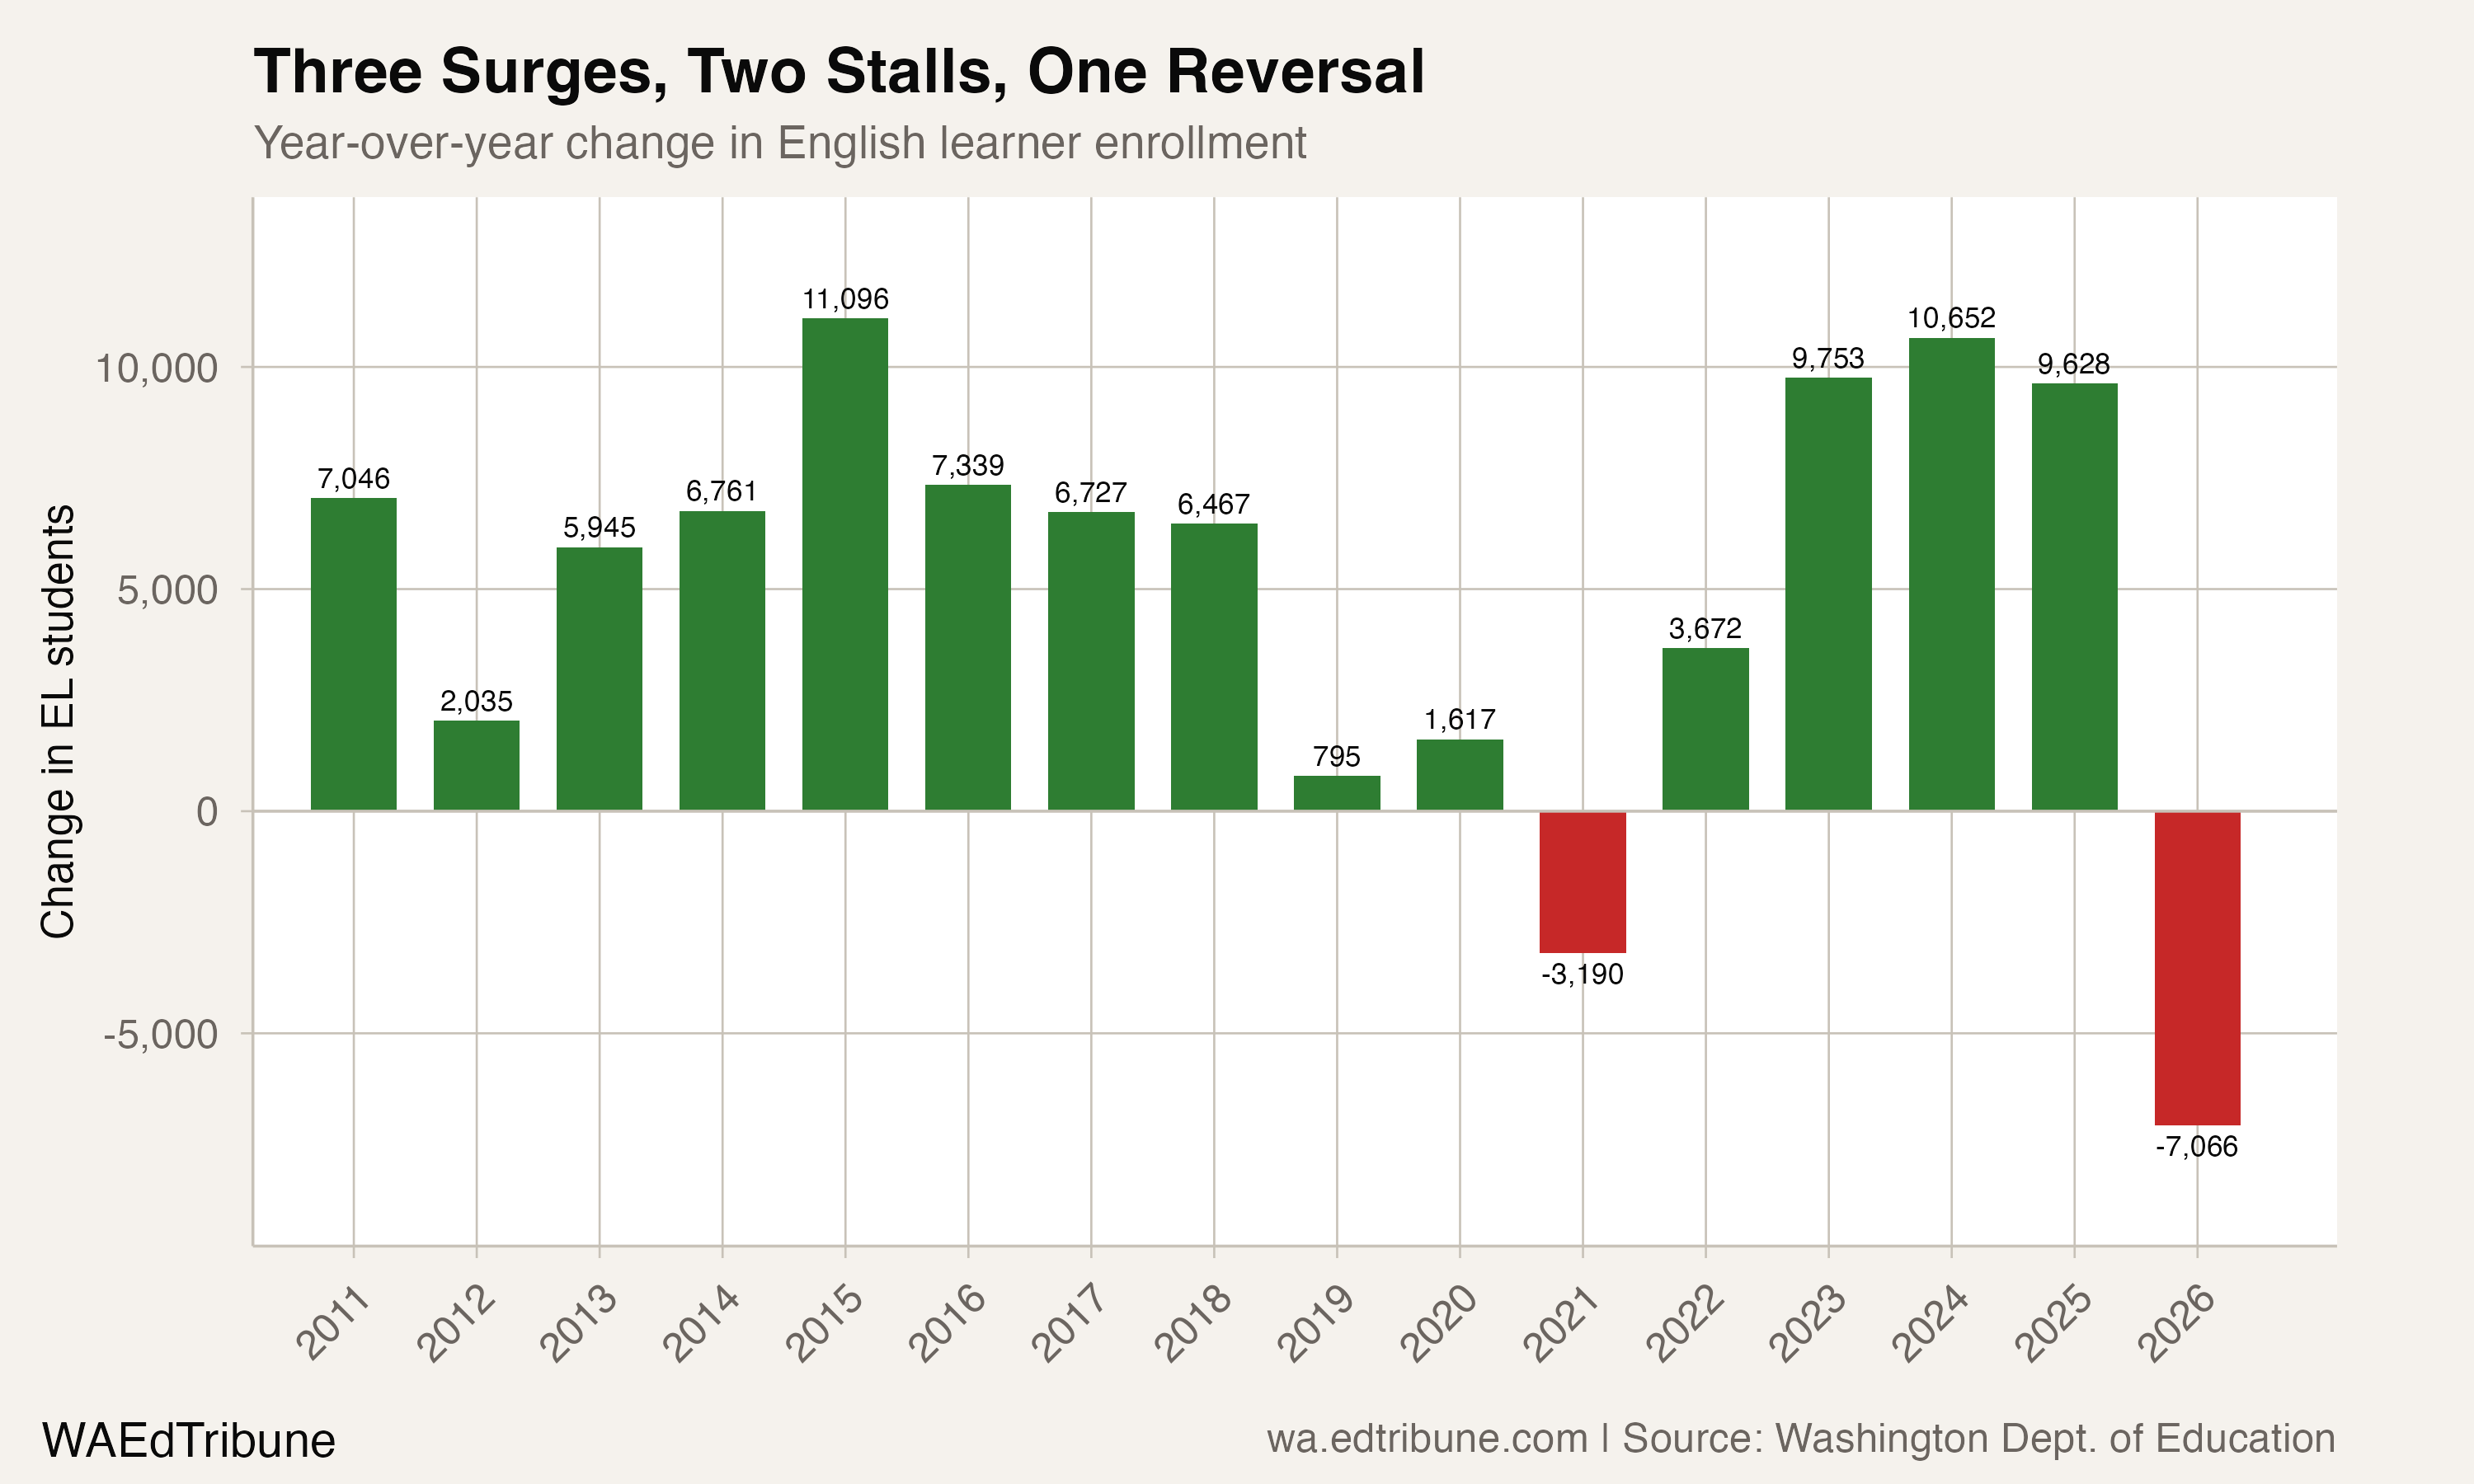
From 2010 to 2015, the state added 32,883 English learners, averaging more than 6,500 per year. Growth then decelerated from 2015 to 2019, adding 21,328 over four years. The COVID period from 2019 to 2022 nearly froze the count, with a net gain of just 2,099 students across three years, including a 3,190-student loss in 2021.
Then the trajectory broke upward. Between 2022 and 2025, Washington added 30,033 English learners in three years, roughly 10,000 per year, the fastest sustained growth in the 16-year dataset. This post-COVID surge pushed the EL share from 12.5% to 15.1%.
The 2025-26 school year reversed that momentum. The count dropped 7,066 students, from 166,538 to 159,472, the largest single-year decline on record. That dip warrants scrutiny: six districts that reported hundreds of English learners in 2024-25, including Ferndale (565), North Mason (441), and Omak (370), reported zero in 2025-26. Whether those drops reflect actual student departures, reclassification events, or reporting changes is not yet clear from the data alone.
A gap that keeps widening
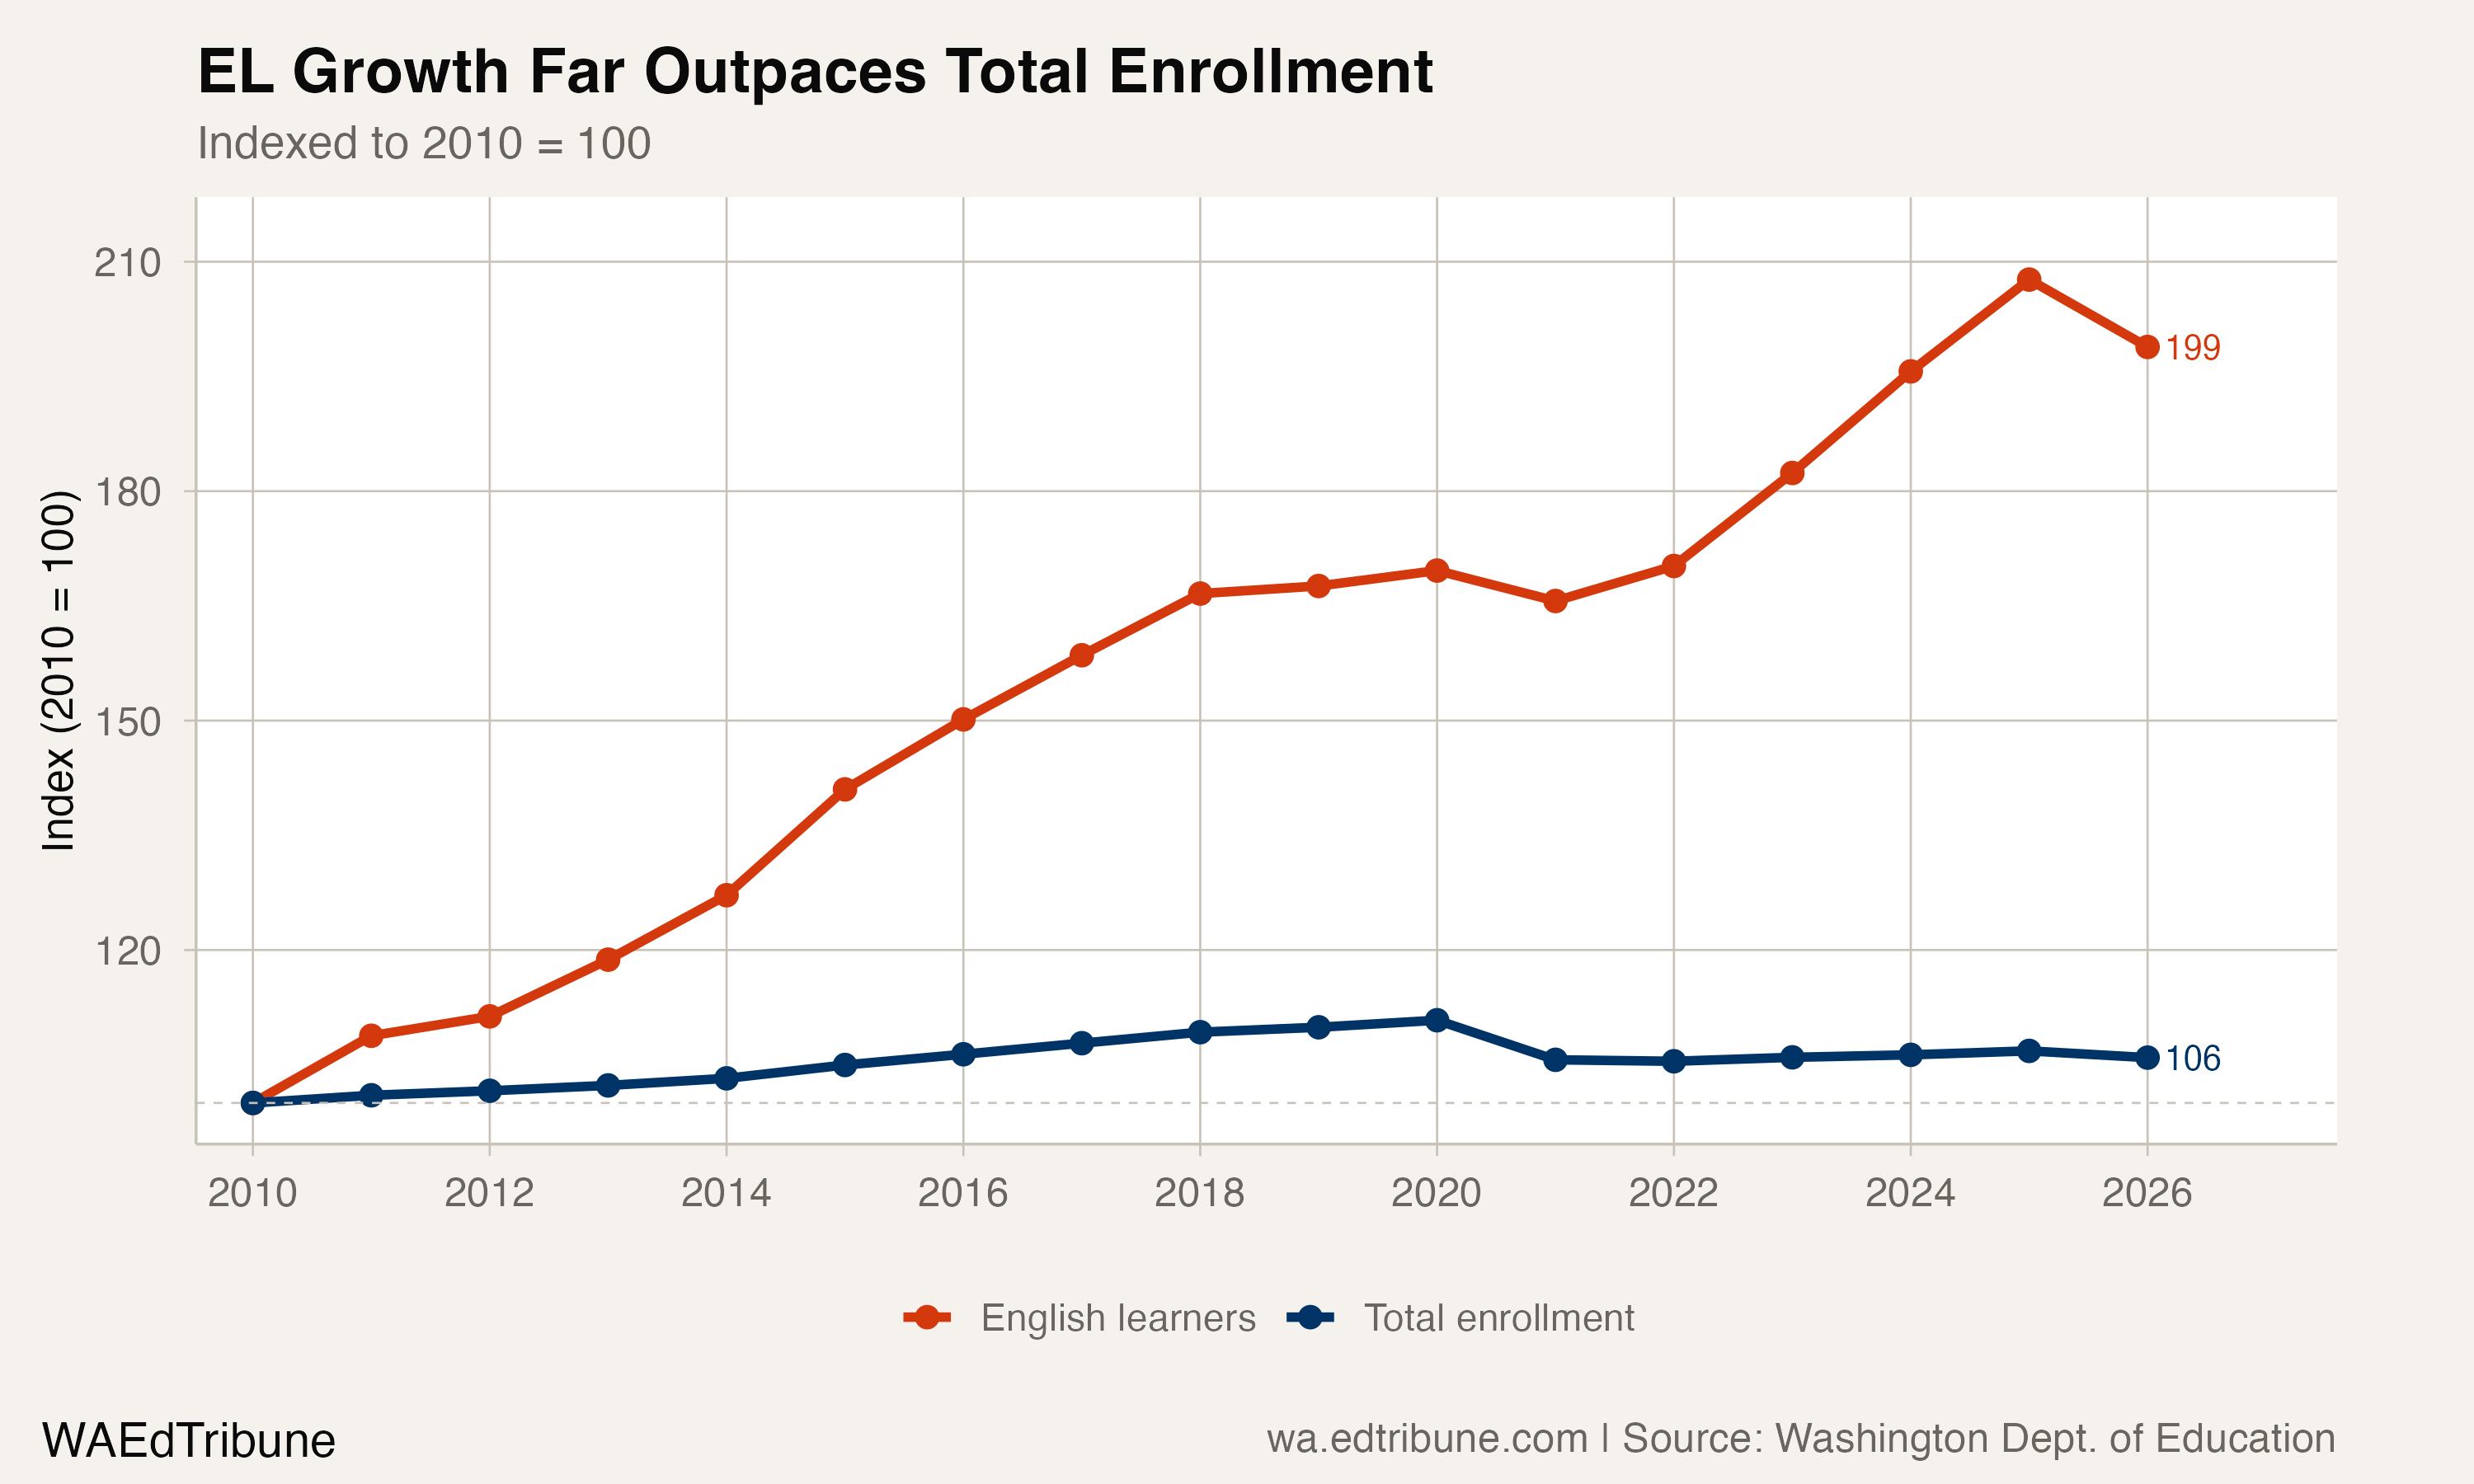
Even with the 2026 dip, the divergence between English learner growth and total enrollment growth is striking. Indexed to 2010, total enrollment sits at 106, meaning the state has 5.9% more students than it did 16 years ago. English learner enrollment sits at 199, nearly double the baseline.
That gap has fiscal and operational implications that compound. Washington's Transitional Bilingual Instruction Program allocates supplemental funding for each eligible English learner based on a prototypical staffing model. But the staffing required to serve these students is harder to fund than it is to calculate. A 2023 joint report by PESB and OSPI found the state would continue to operate at a deficit, failing to produce the 260 to 390 bilingual educators necessary each year through 2025-26.
In many districts, paraeducators provide the majority of bilingual instruction, particularly in smaller and more rural systems. For a district like Yakima↗ET, where one-third of its 5,063 English learners depend on these services, the gap between need and capacity is not abstract.
What moved the needle
Two forces plausibly explain most of the growth, and they are not the same force.
The first is new arrivals. Washington has historically ranked among the top 10 refugee resettlement states, and King County's foreign-born population crossed 500,000 in 2017, with nearly half of the county's population growth since 2010 coming from immigration. Over the past decade, more than 30,000 refugees from over 70 countries resettled in the state through the U.S. Refugee Admissions Program alone. Students in Washington's TBIP program speak 285 different home languages, with Spanish the most common at 58.3%, followed by Russian, Ukrainian, Dari, Vietnamese, and Arabic.
The second is expanded identification. Reclassification criteria determine not just when students exit EL status but also, indirectly, how long they stay in the count. OSPI updated its exit criteria effective 2024, creating an alternative pathway for students in grades 3-12 who scored between 4.3 and 4.6 on WIDA and earned Level 3 or 4 on the SBA English language arts assessment. The 2026 dip of 7,066 students may partly reflect a reclassification cohort exiting under these new criteria, though the six districts that dropped to zero EL enrollment suggest reporting changes are also involved.
The data cannot distinguish between a student who arrived from another country and a student who was already enrolled but newly identified as an English learner. Both show up the same way in the annual count. This means the 98.9% increase over 16 years reflects some unknown mix of actual demographic change and evolving identification practices.
The suburban transformation no one planned for
South King County offers the clearest case study of how this growth reshaped districts that were not historically EL-serving systems.
"What we are seeing here is happening across the country: the suburbanization of the minority population, which also includes the suburbanization of immigration." -- Mark Ellis, University of Washington geography professor, in The Seattle Times
Kent, Federal Way, Auburn, and Highline collectively enrolled 11,941 English learners in 2010. In 2025-26, they enrolled 27,615, an increase of 15,674 students, accounting for 19.8% of the entire statewide EL gain. These four districts alone now serve more English learners than the bottom 277 of Washington's 328 districts combined.
The share increases tell the operational story. Auburn went from 11.7% to 30.3% EL. That means a district that once needed bilingual capacity for roughly one in nine students now needs it for nearly one in three. Every hiring decision, every curriculum adoption, every parent communication strategy changed over the span of a decade and a half.
The next release's telling number
The 2025-26 dip was the first meaningful decline in EL enrollment since the pandemic year of 2020-21, and it was larger in absolute terms. Whether it marks the beginning of a plateau or a one-year correction will be visible in the next statewide data release.
The districts that dropped to zero EL enrollment, particularly Ferndale and North Mason, bear watching. If those students reappear in 2026-27 counts, the dip was likely a reporting artifact. If they do not, something structural changed.
For districts like Pasco↗ET, where 35.8% of 18,834 students are English learners, the question is not whether demand for bilingual instruction will continue but whether the workforce pipeline can meet it. Washington's teacher preparation programs were producing fewer bilingual educators than needed even before the EL population surged past 150,000. At the current scale, every year of undersupply compounds.
Detailed code that reproduces the analysis and figures in this article is available exclusively to EdTribune subscribers.
Discussion
Sign in to join the discussion.
Loading comments...