Correction (October 11, 2026): OSPI revised its published 2025-26 enrollment file after this article ran, and we have restated every figure from the revised data. Washington enrolled 69,583 kindergartners in 2025-26, not 69,338, and 99,231 seniors, not 98,754; the gap between them is 29,648, not 29,416. The article said that gap did not exist a decade ago; it did (9,932 in 2015-16), and it has since tripled. Ridgefield was one of three larger districts to gain kindergartners, not the only one. Other figures moved by smaller amounts and are updated below.
In Bellevue, the first grade class is 67.2% the size of the senior class. In Seattle, kindergarten enrollment has fallen 25% from its peak. Across Washington, 69,583 children entered kindergarten in 2025-26, the lowest count in 17 years of data and 13,364 fewer than the 82,947 who enrolled just six years earlier.
At the other end of the building, 99,231 students are in their senior year, an all-time high. Seniors now outnumber kindergartners by 29,648 students, three times the gap in 2016. Washington's K-12 system is operating two school systems simultaneously: one that is growing and one that is shrinking. The shrinking side is the future.
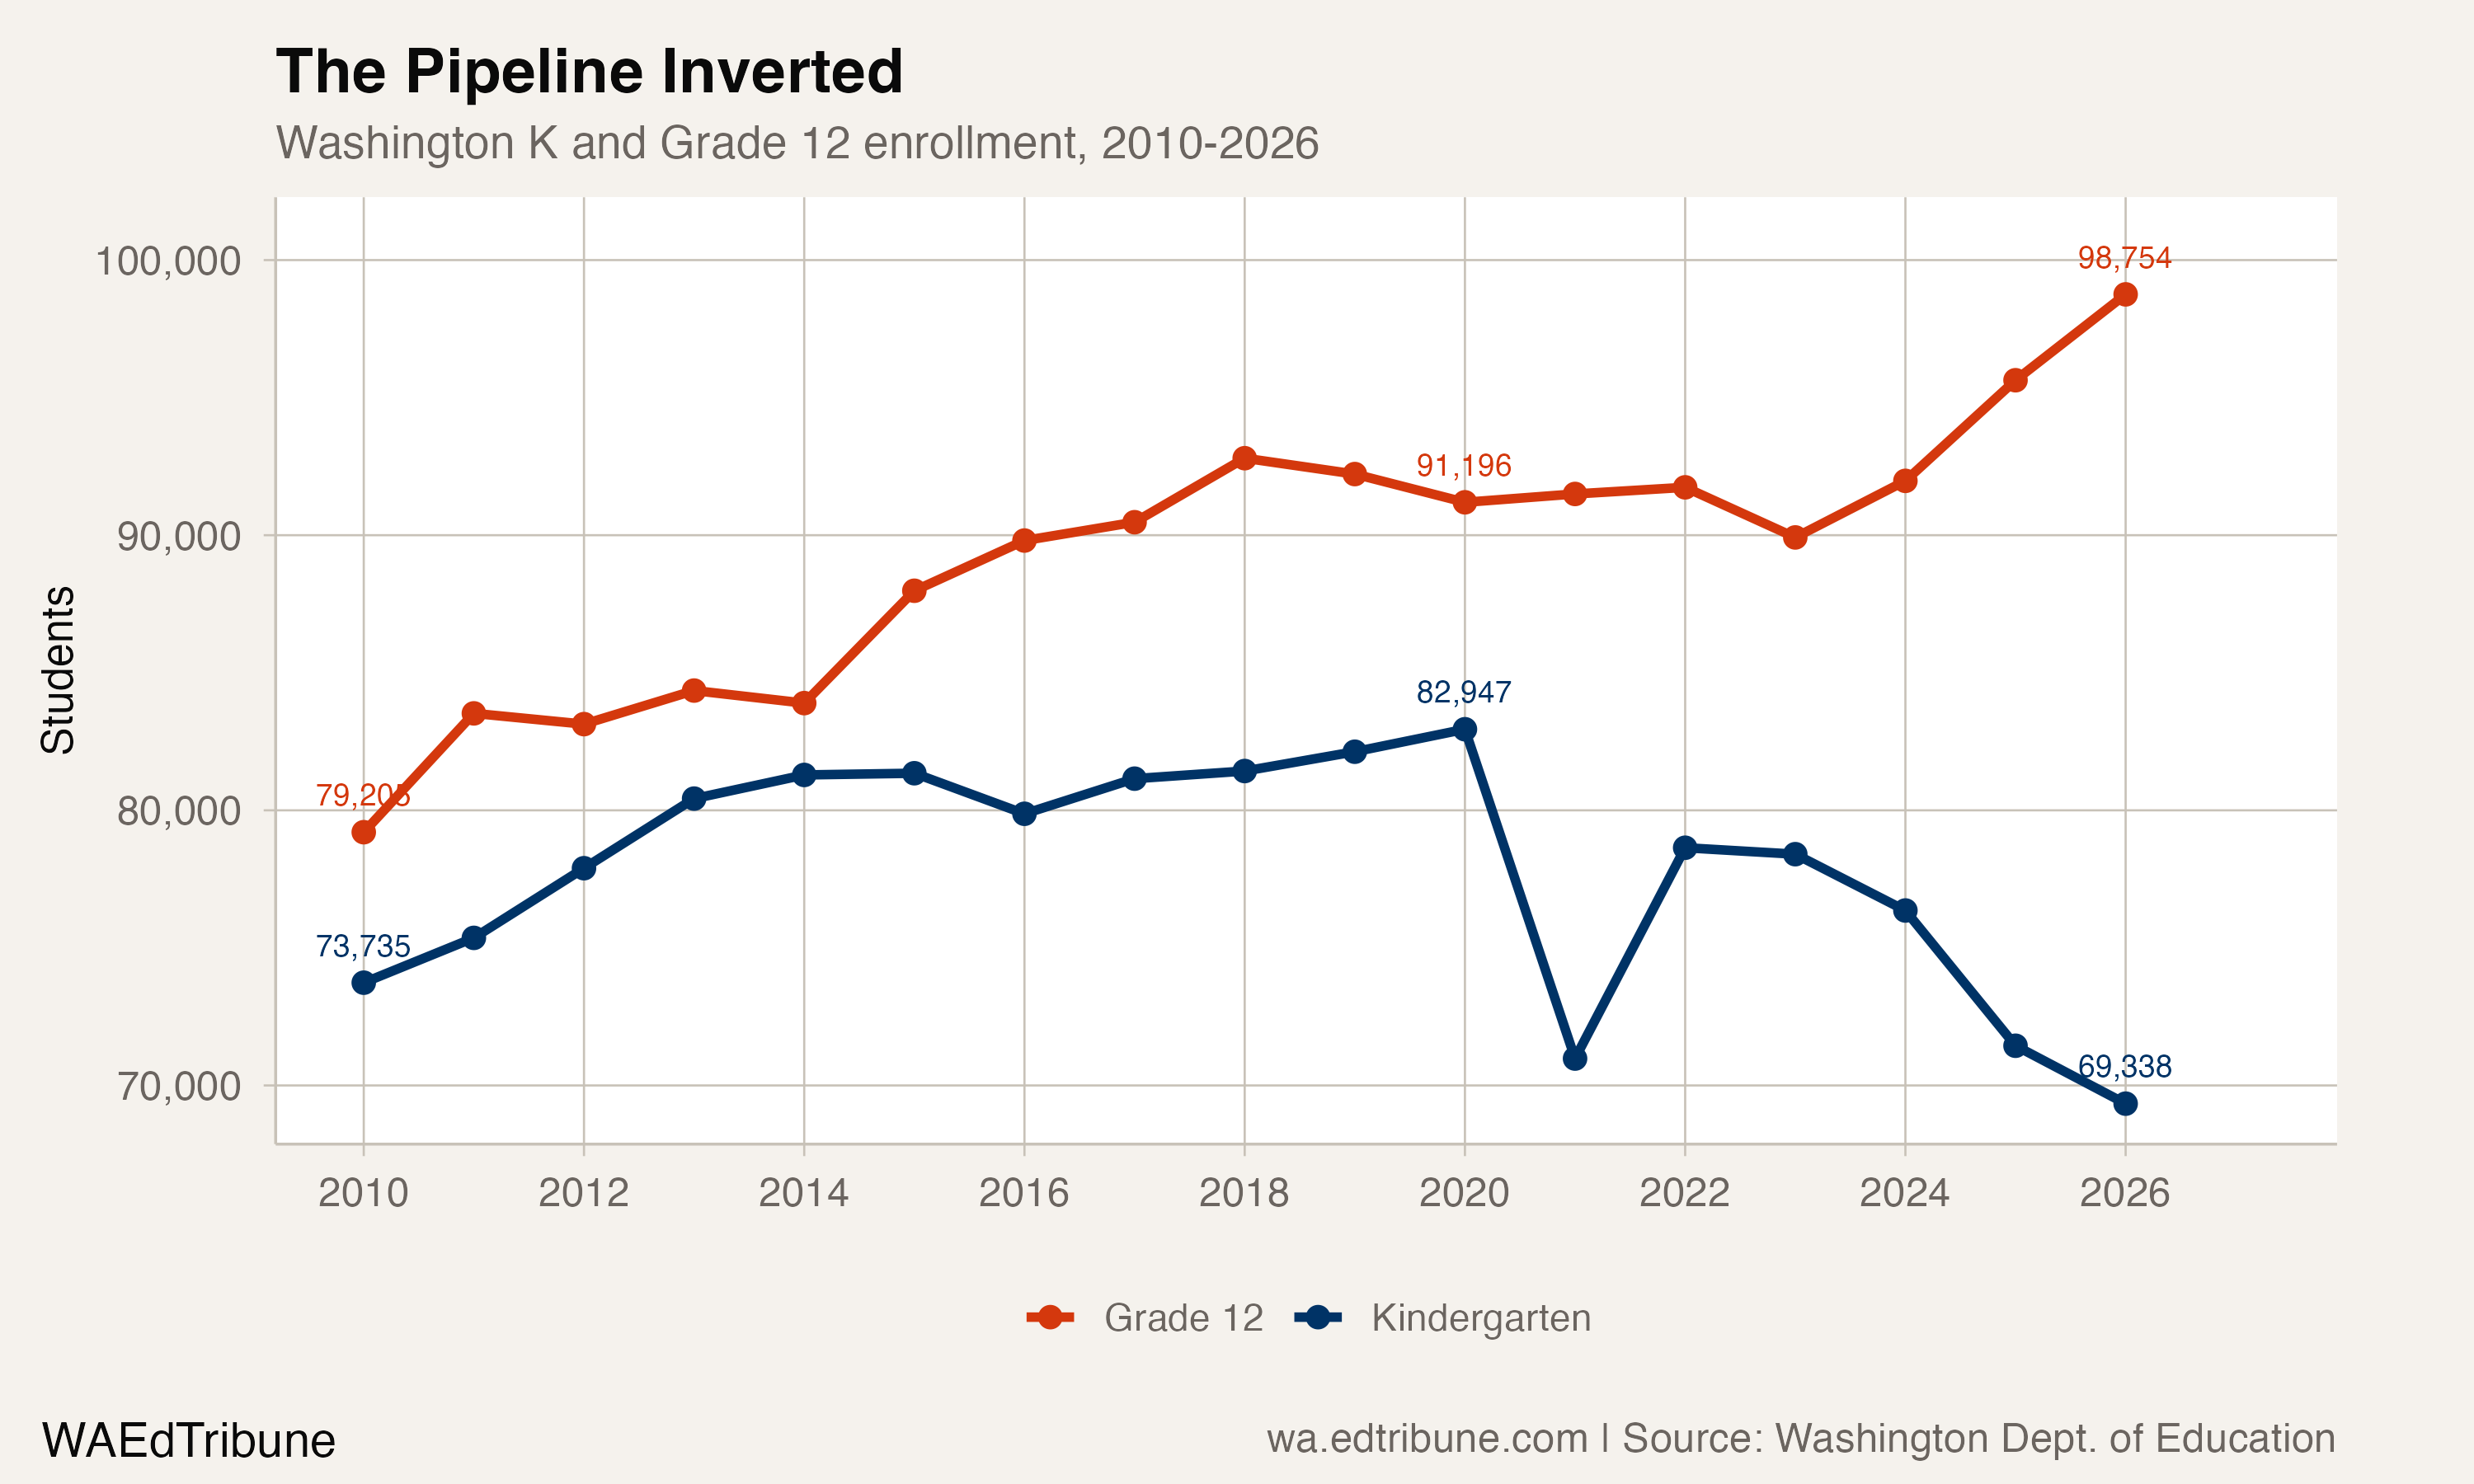
Six years of smaller kindergarten classes
The COVID dip in 2020-21, when kindergarten plunged by 11,970 students in a single year, gets the most attention. But what happened next is the real story. Kindergarten bounced back to 78,640 in 2021-22 as families returned. Then it resumed falling: down 234, then 2,047, then 4,916, then 1,860, for a cumulative loss of 9,057 students (11.5%) over just four years.
The post-bounce decline is not pandemic behavior. It is demographic. Washington's birth rate dropped 22% between 2007 and 2022, from 13.77 to 10.70 births per 1,000 residents. The fertility rate fell to 51.4 per 1,000 women ages 15-44 in 2023. Children born in 2019 and 2020, when births continued their long slide, are the kindergartners of 2025-26. Children born in 2021, when Washington recorded its lowest birth totals in years, will arrive in 2026-27.
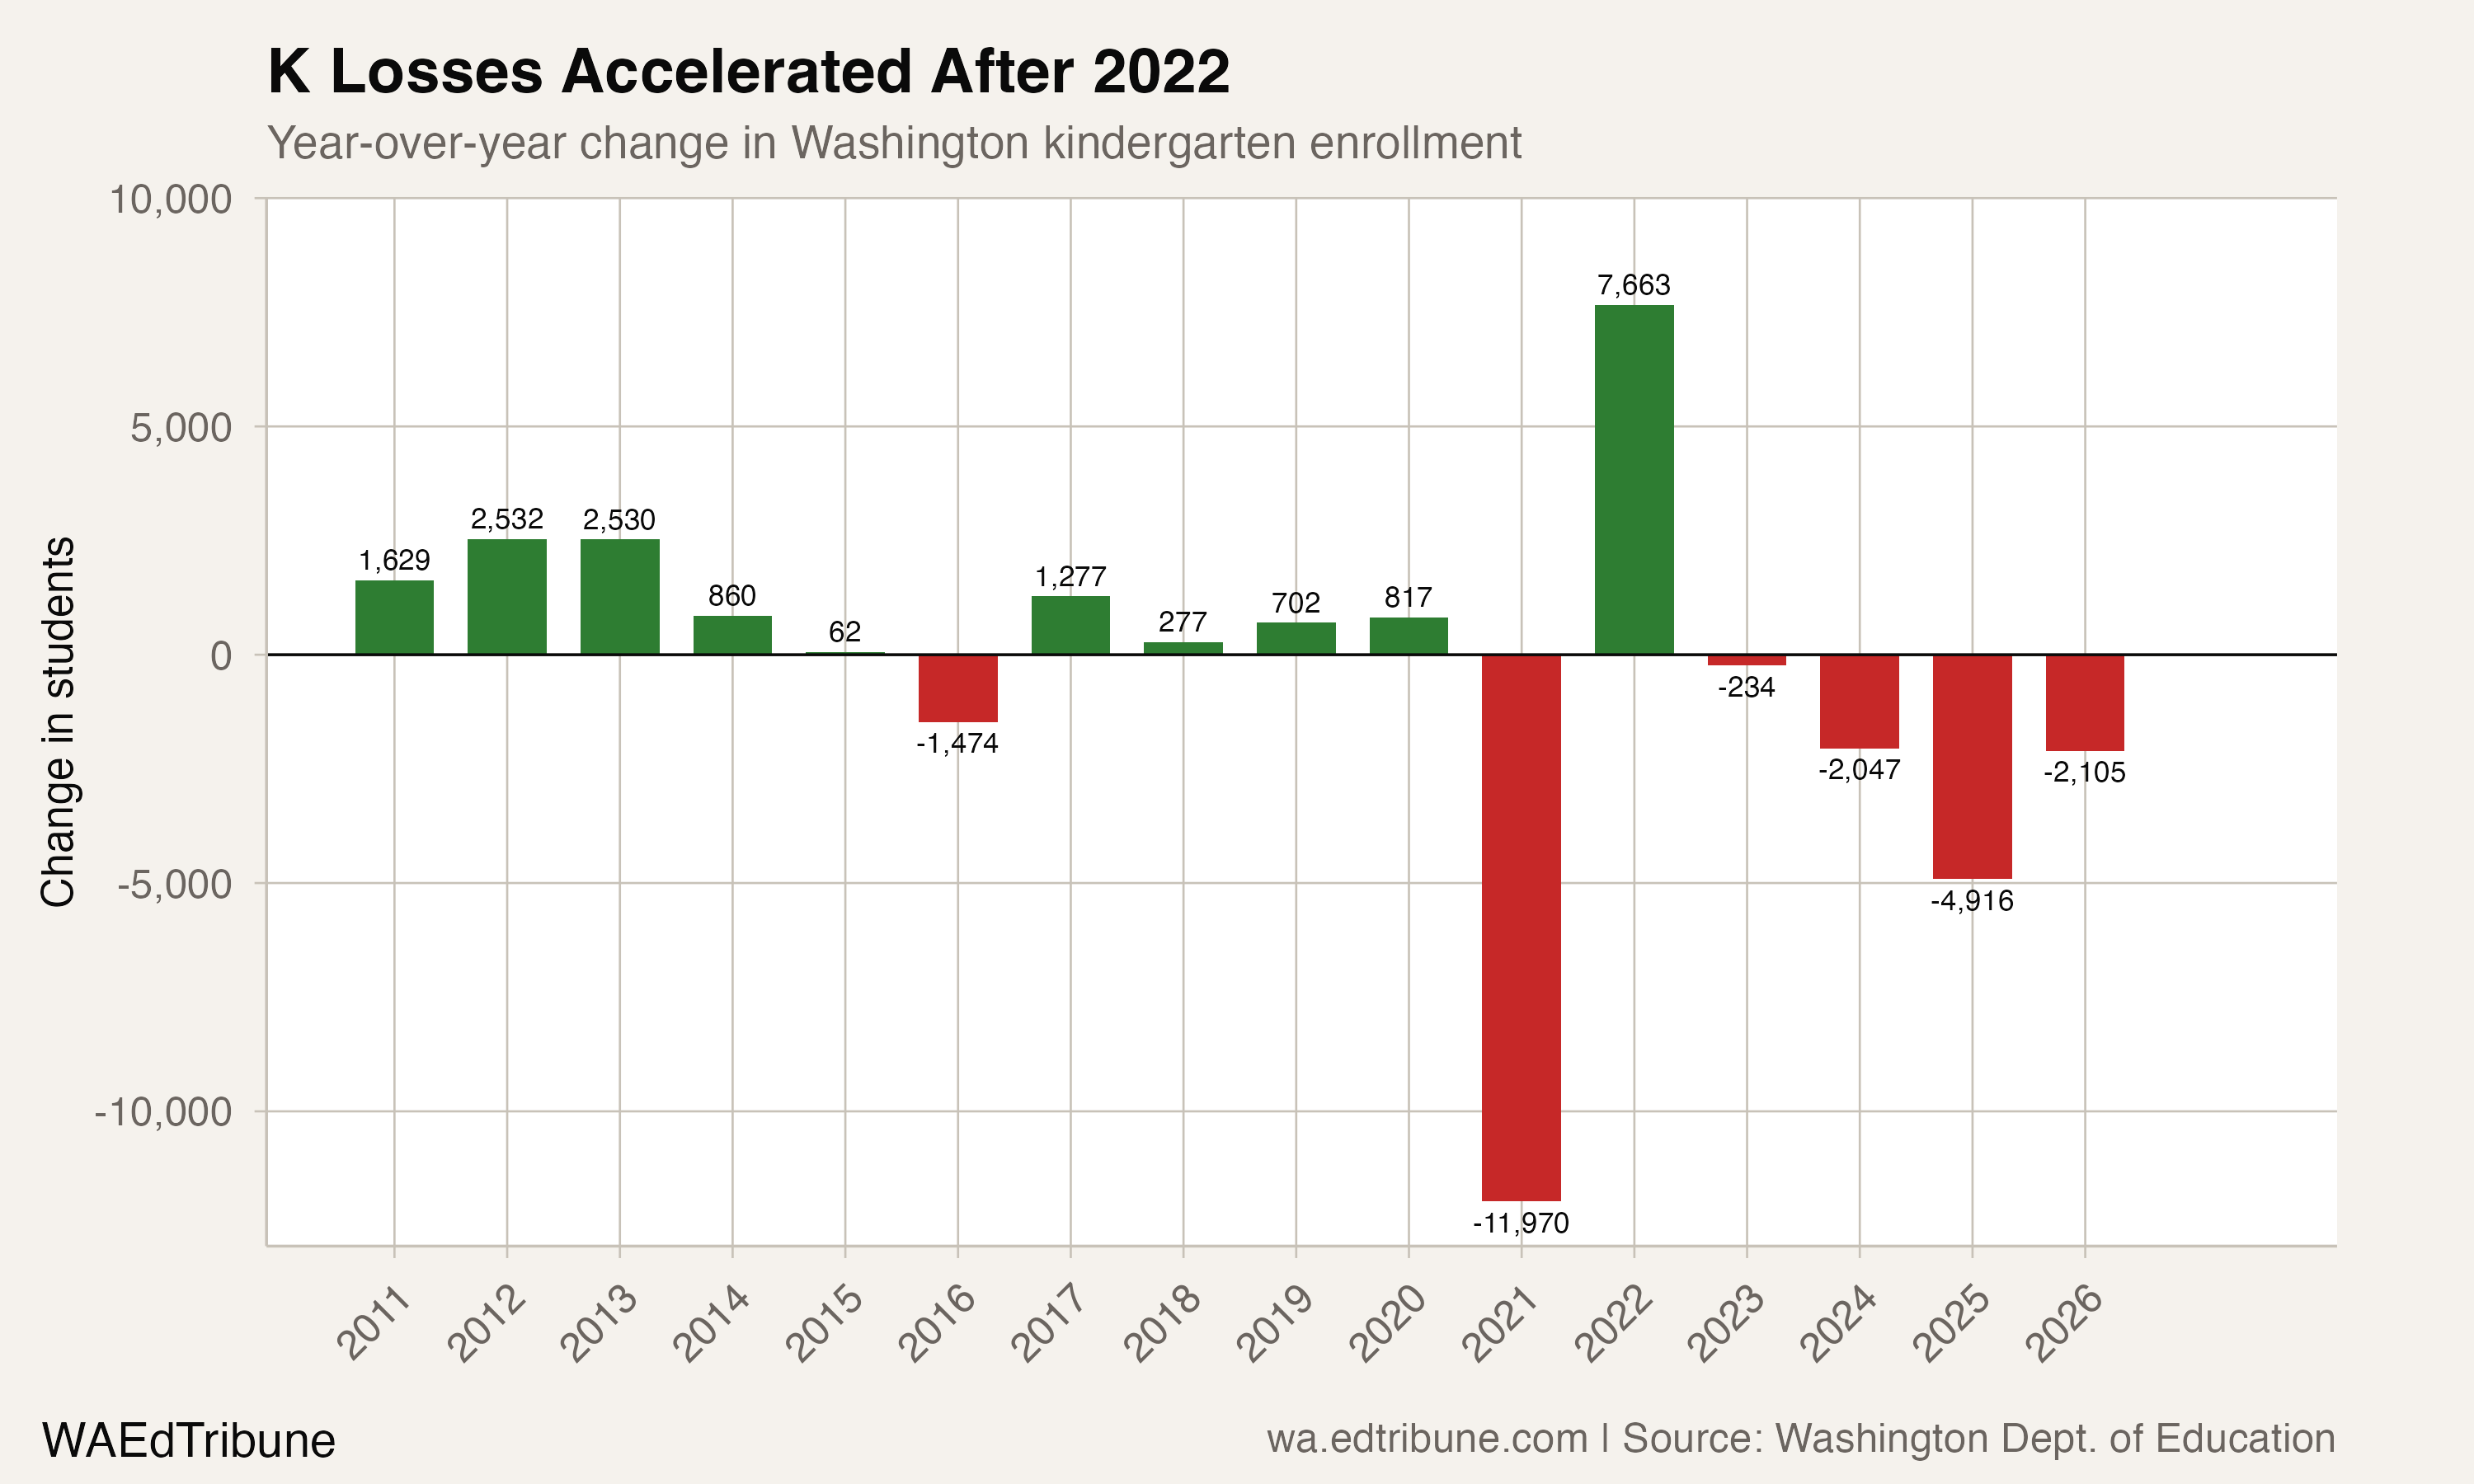
The six kindergarten cohorts from 2021 through 2026 totaled 445,408 students. The six cohorts from 2015 through 2020 totaled 488,878. That is a deficit of 43,470 children who never entered the front door of a Washington elementary school. Each of those smaller classes will move through the system for thirteen years, shrinking every grade it passes through.
The bulge at the top
Senior enrollment tells a different story. It hit 99,231 in 2025-26, up 25.3% from 79,205 in 2009-10. Part of this reflects larger cohorts born before the birth rate decline accelerated. But another factor inflates the count: the ratio of seniors to the prior year's juniors has consistently run between 108% and 112% since 2015, meaning roughly one in ten seniors is spending a fifth year in high school. The 89,157 students counted as 11th graders in 2024-25 became 99,231 seniors in 2025-26, a ratio of 111.3%.
This is not unique to Washington. Extended high school enrollment is common in states that offer Running Start dual-enrollment programs or that have raised graduation requirements. But it means the senior count overstates the size of the underlying birth cohort. The top of the pipeline is genuinely larger than the bottom, but not quite as much as the raw numbers suggest.
A gradient of decline
The shrinkage is not limited to kindergarten. Every grade from K through 5 is below its all-time peak, with the losses tapering as you move up the grades, a clear signature of smaller cohorts rippling through the system year by year.
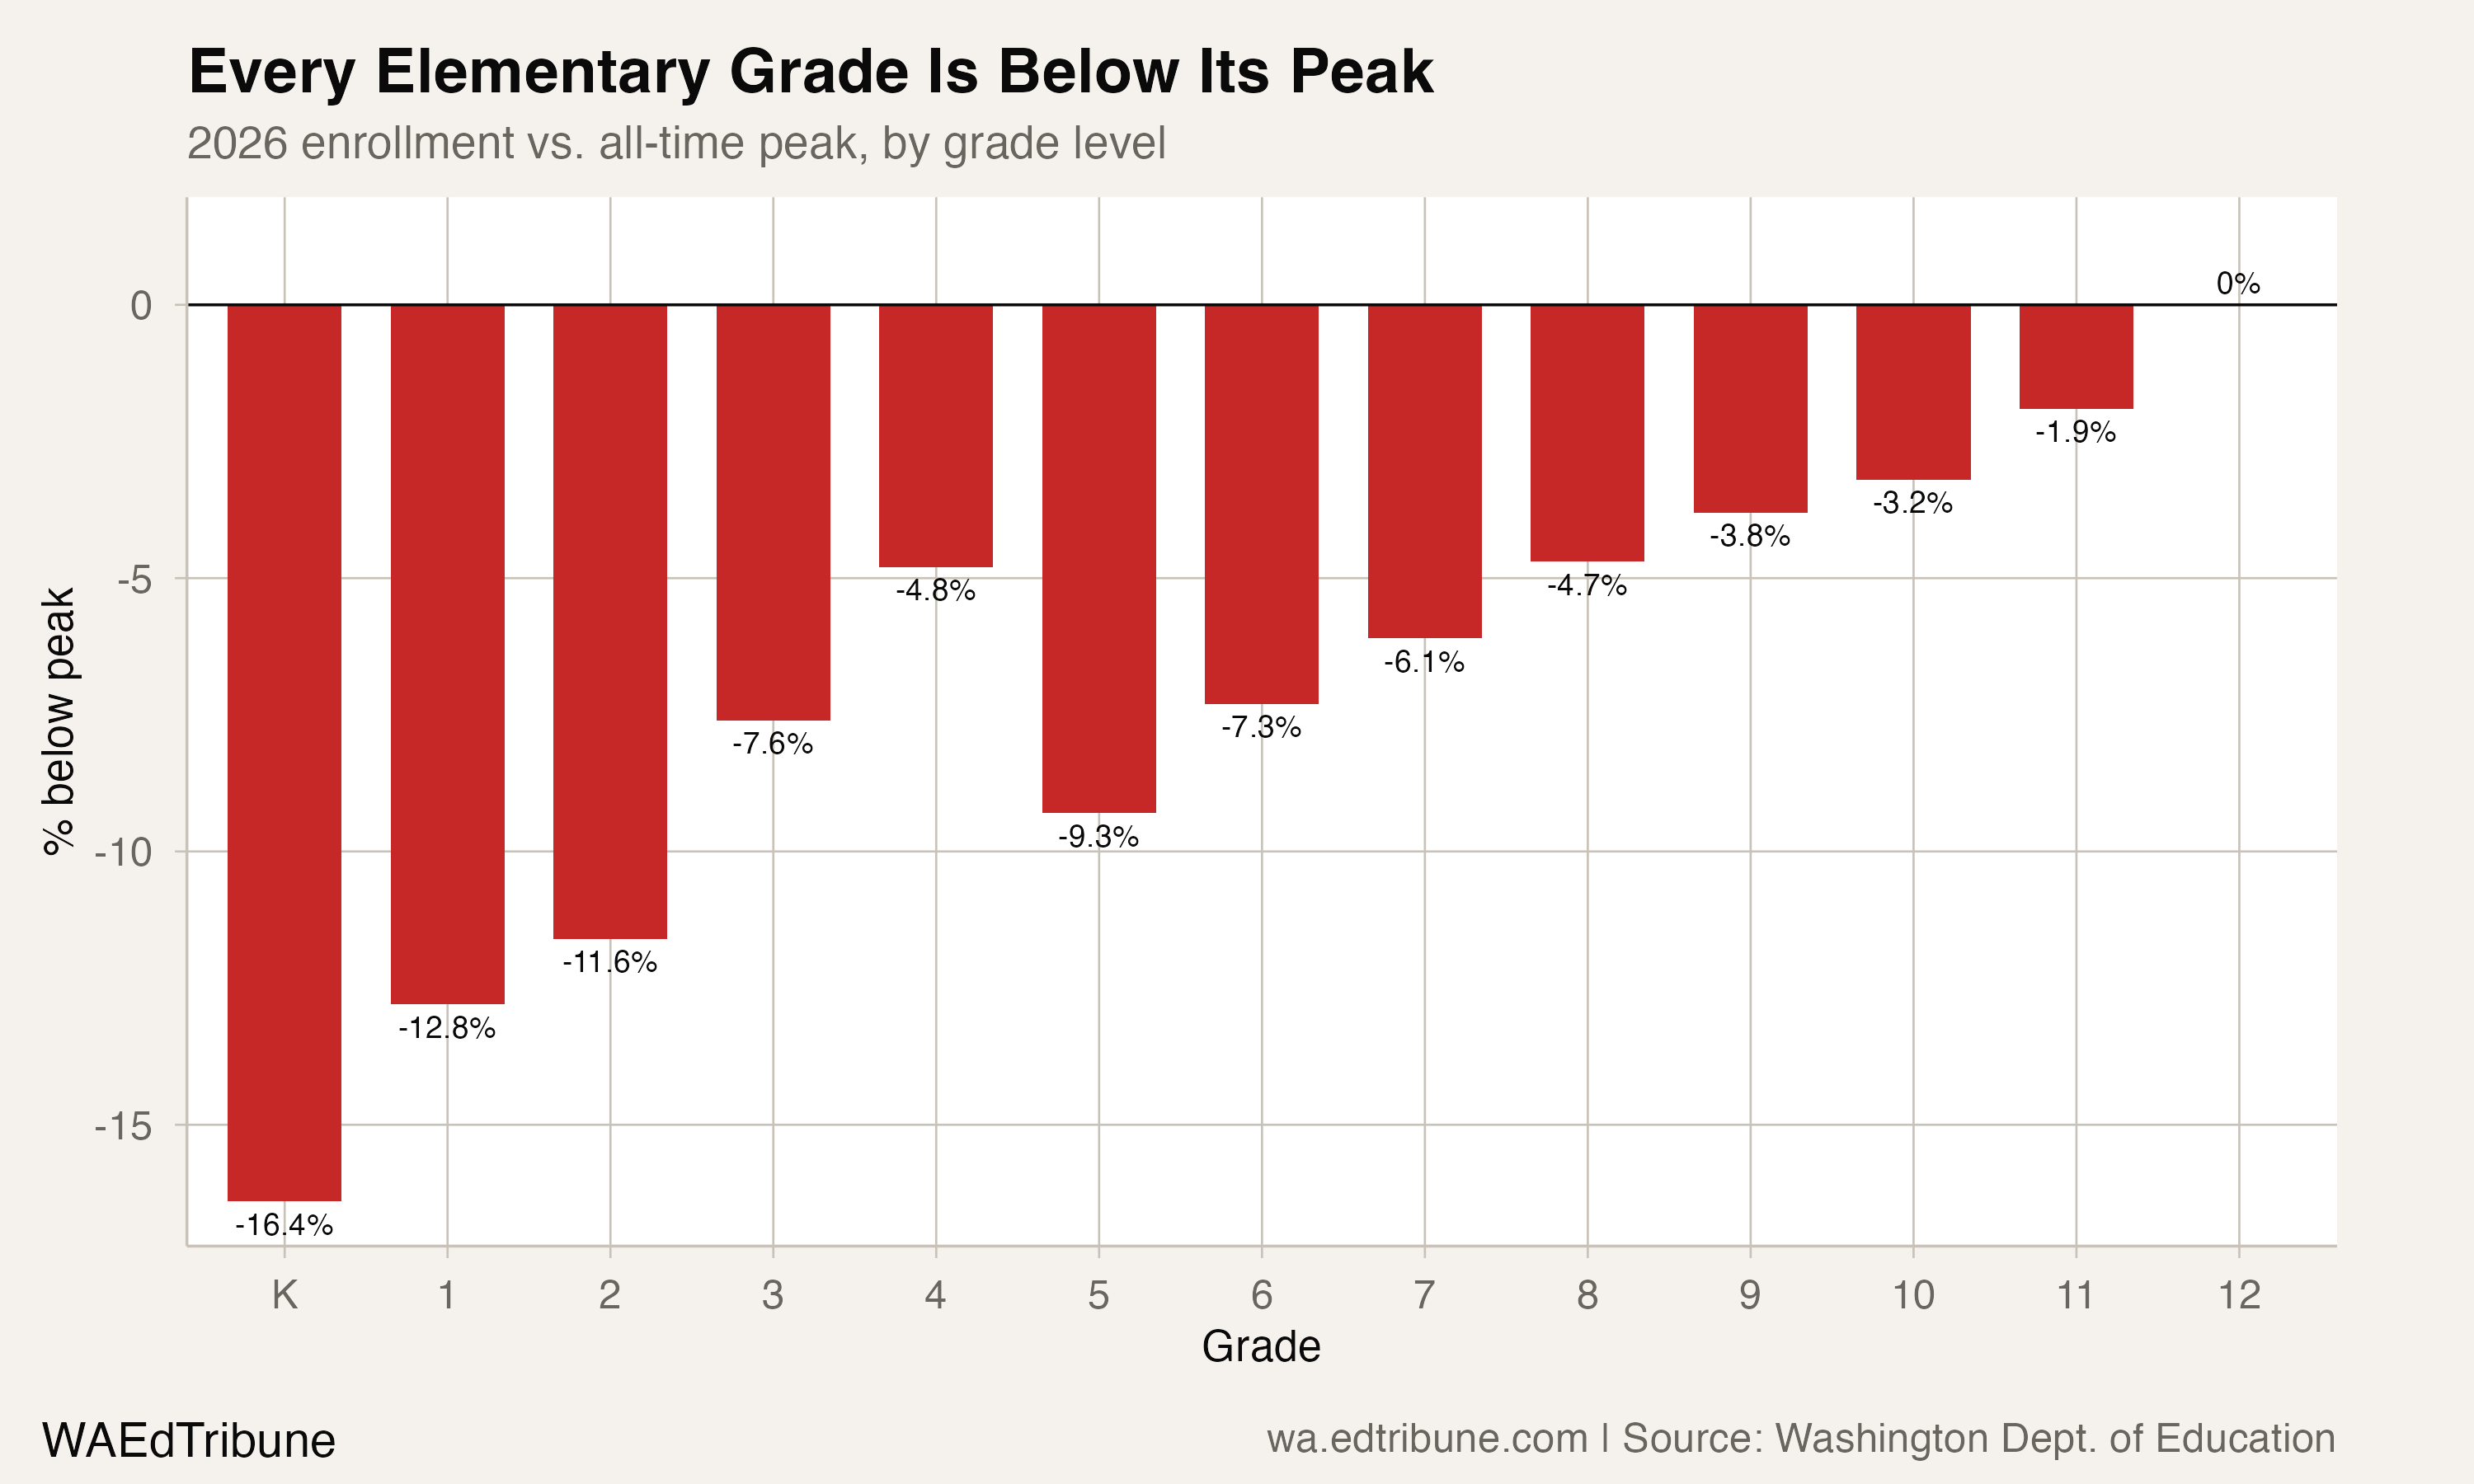
Kindergarten sits 16.1% below peak. First grade is down 12.7%. Second grade, 11.4%. By fourth grade, the deficit narrows to 4.6%. This pattern is precisely what birth-rate-driven decline looks like: the youngest grades are hit first, and the wave moves upward one year at a time. Grades 6 through 8 are now 4.7% to 7.2% below their peaks as the first small post-recession cohorts arrive in middle school. Only the senior class is at its all-time high.
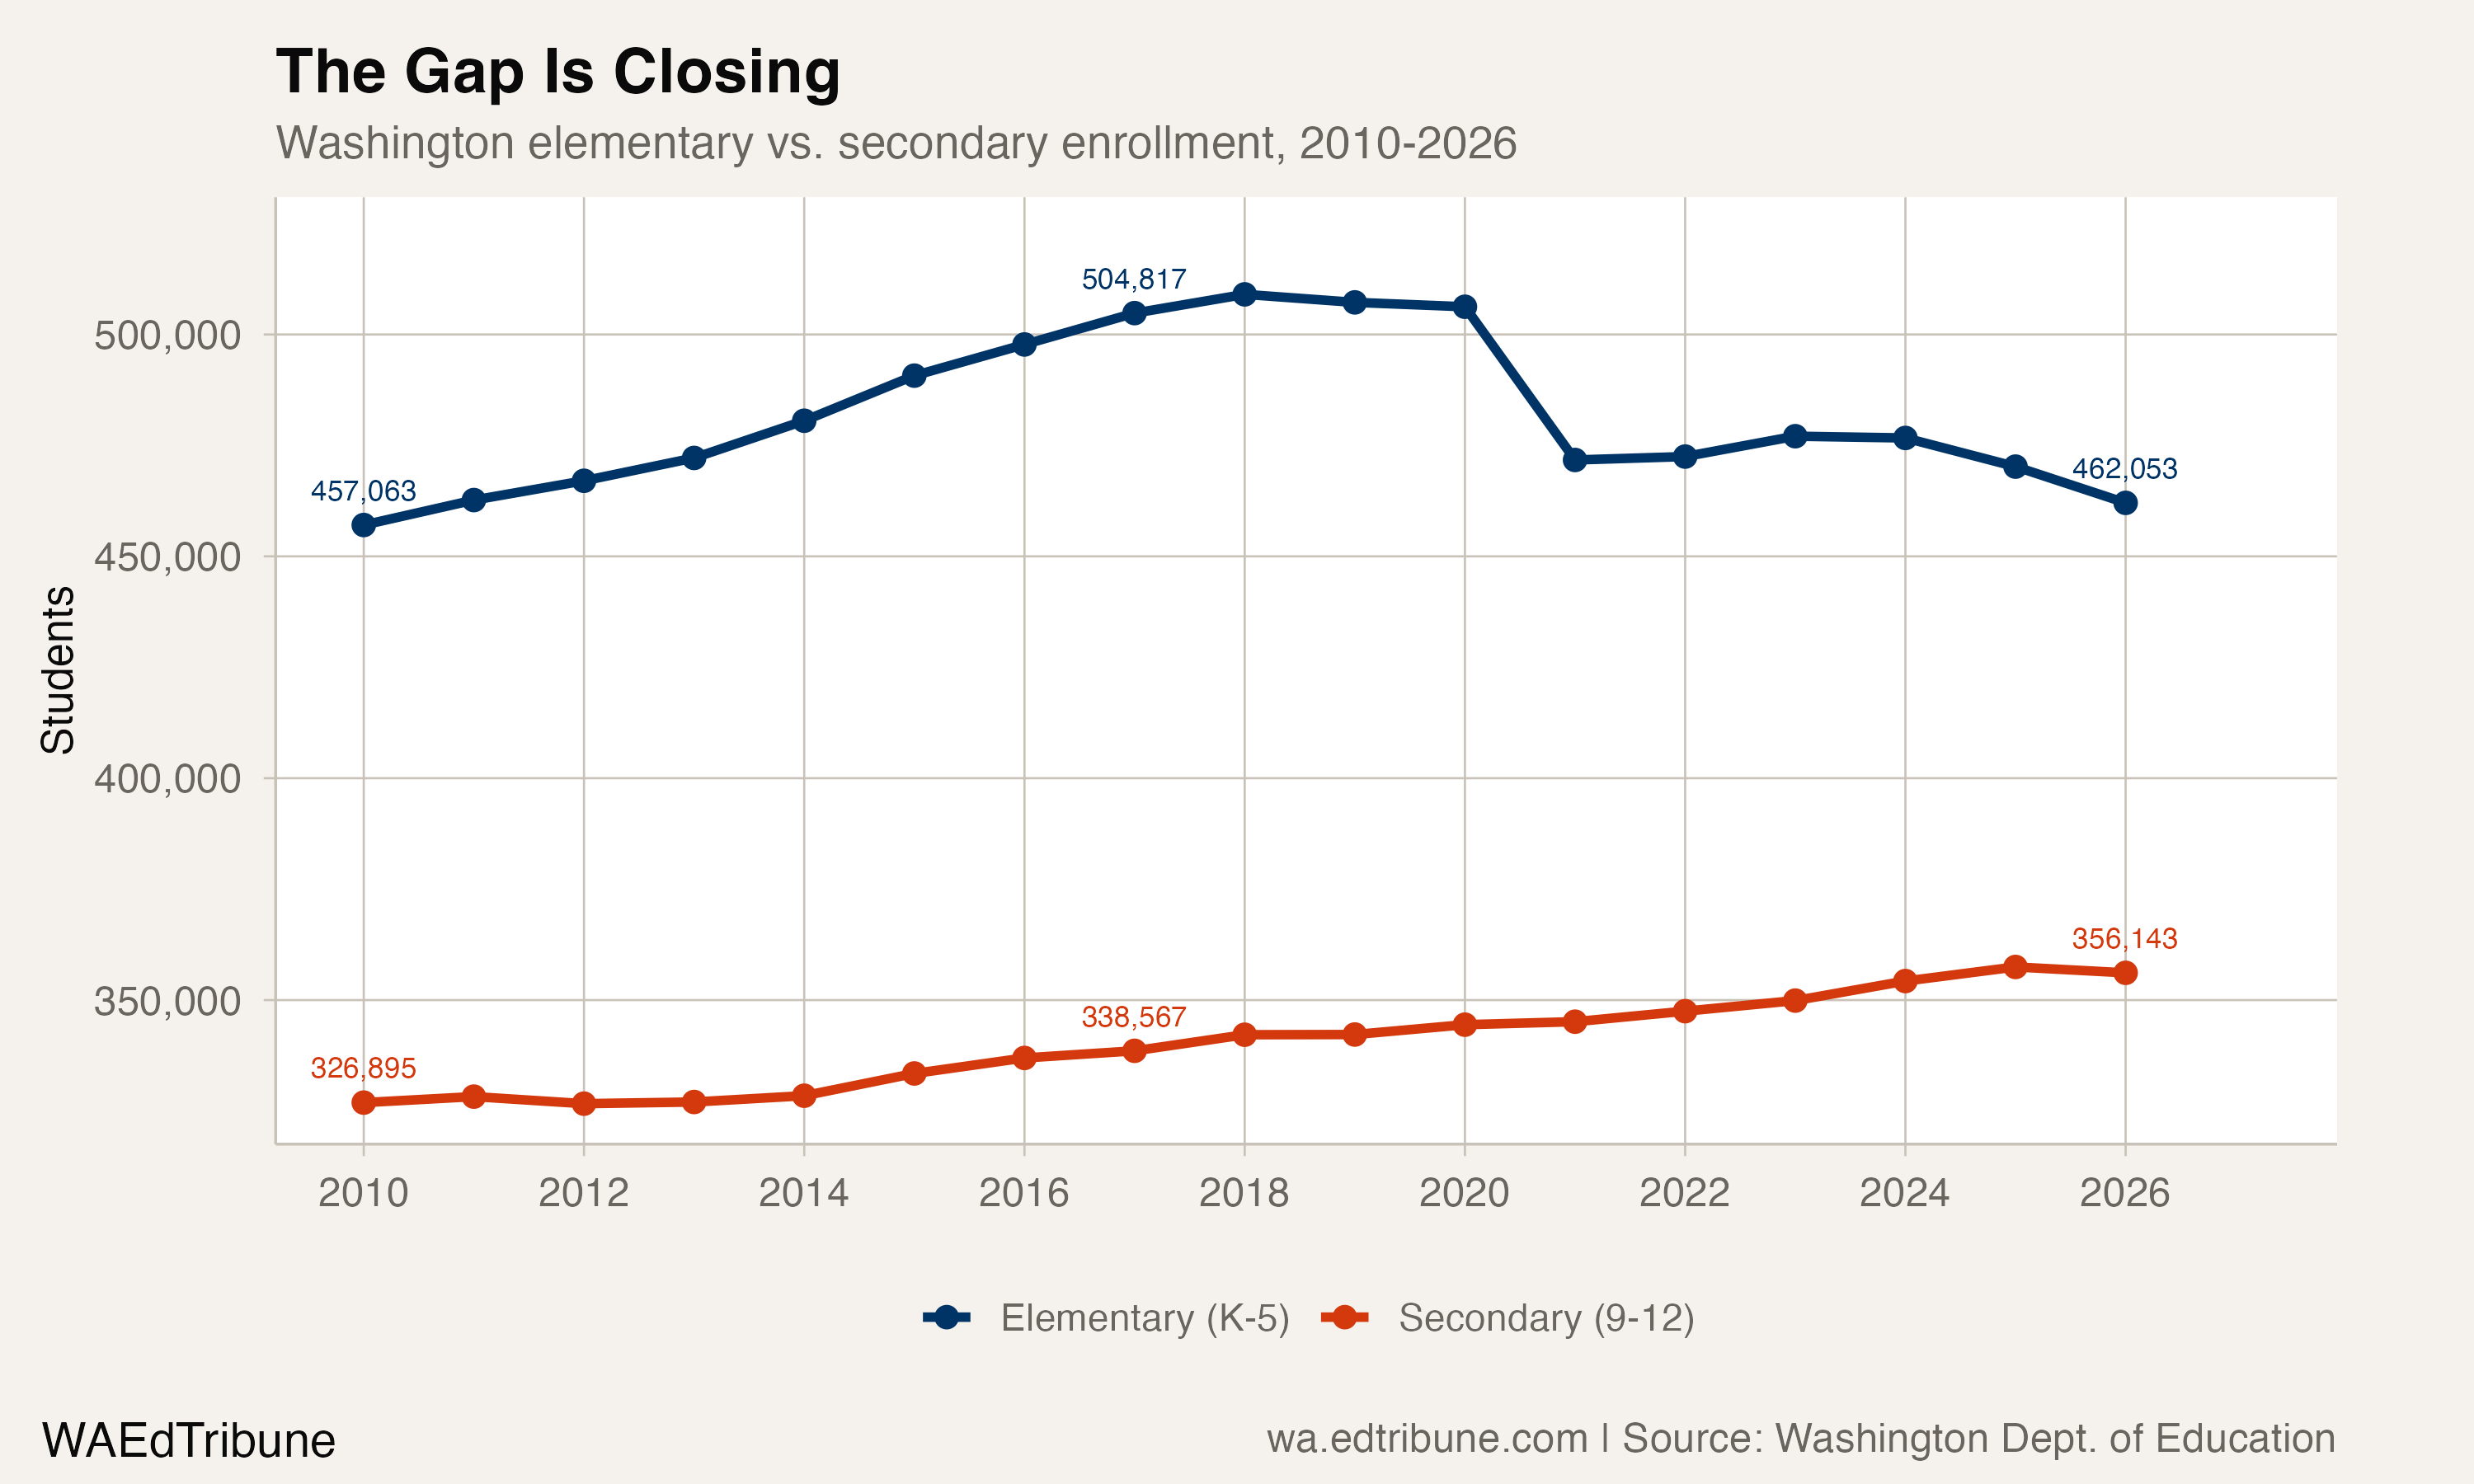
The aggregate picture is equally stark. In 2017, Washington had 504,817 elementary students (K-5) and 338,567 high school students, a ratio of 149.1%. By 2026, that ratio has compressed to 129.7%, with 462,913 elementary students and 356,805 secondary students. The elementary feeder system has shrunk by 41,904 students while the secondary system grew by 18,238.
Where the smallest classes are
The losses are not evenly distributed. Seattle lost 918 kindergartners between 2020 and 2026, a 19.7% decline, the largest absolute drop in the state. Lake Washington lost 593 (25.2%), Issaquah lost 426 (29.2%), and Spokane lost 435 (17.8%). The Eastside suburbs, where housing costs have pushed young families outward, saw some of the steepest percentage declines. Olympia's kindergarten class shrank 31.6%.
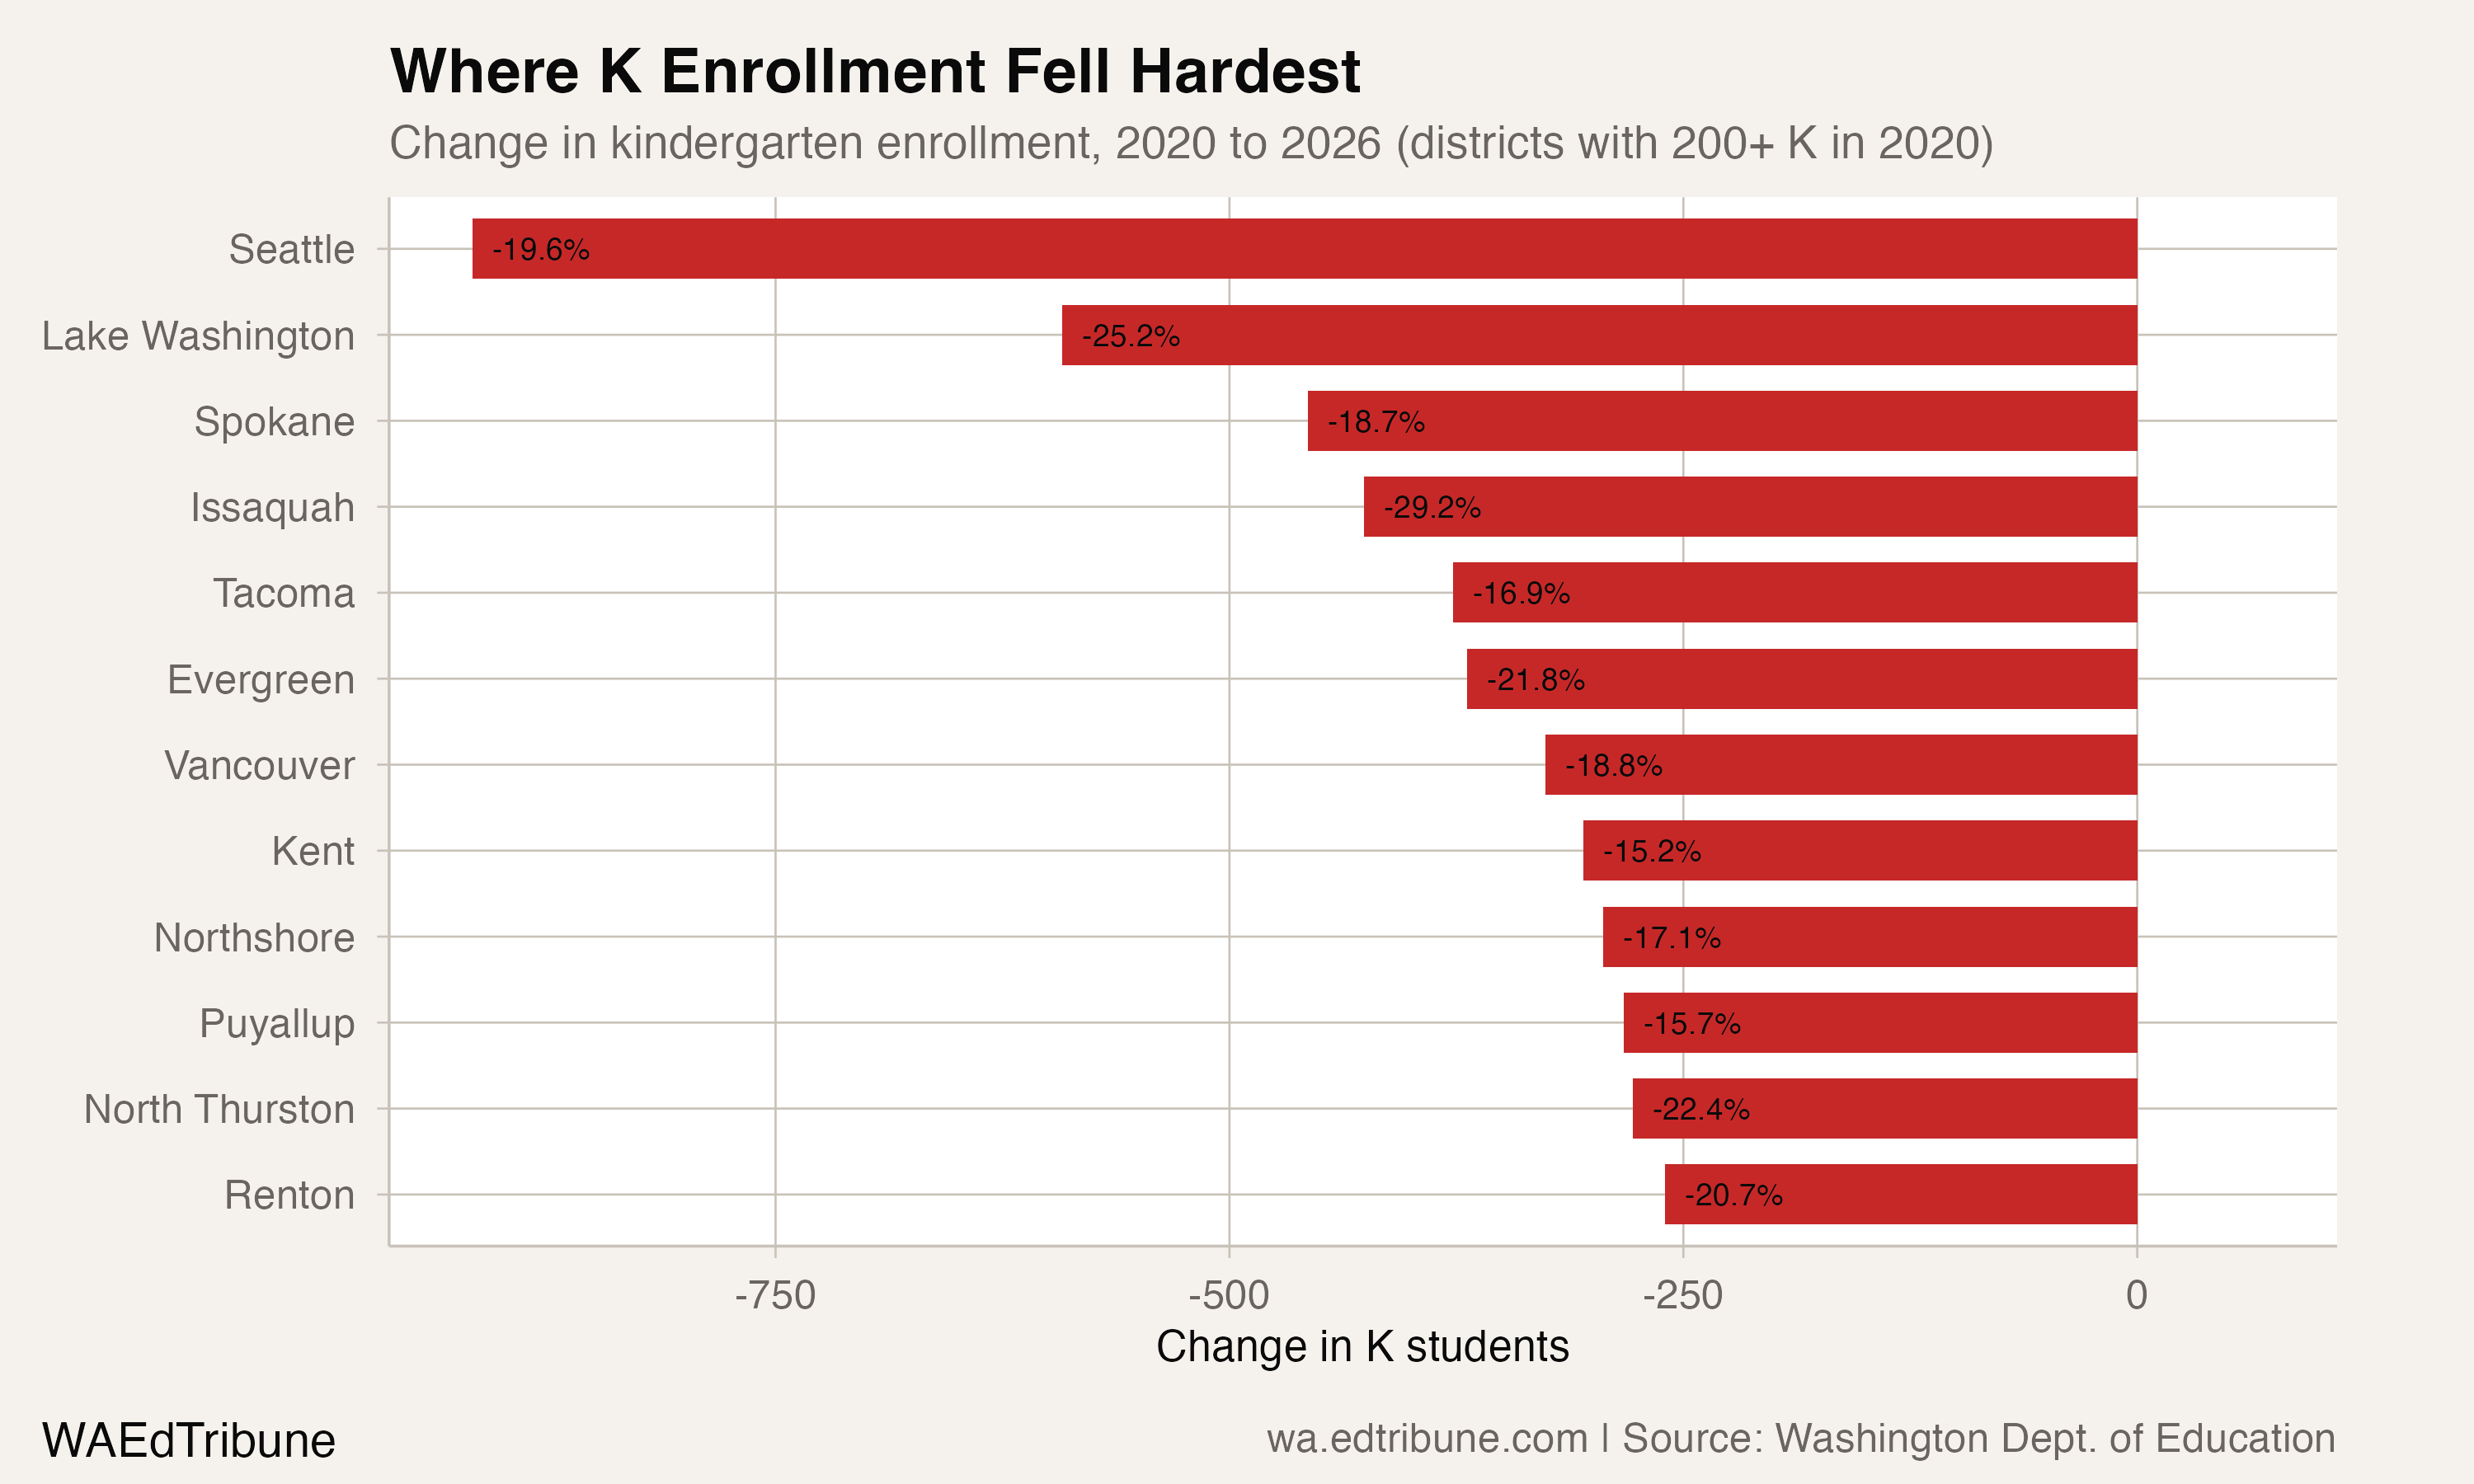
Nearly every district that enrolled at least two hundred kindergartners in 2020 lost ground. Only 3 gained: Pullman, Enumclaw, and Ridgefield, a fast-growing suburb near Vancouver that added 26 kindergartners over six years.
Closing schools that children no longer fill
The operational consequences are already arriving. Bellingham Public Schools has lost roughly 600 students since 2019-20 and is studying whether to close one or more elementary schools. A district demographer projects enrollment declines through 2035. Chief Operations Officer Jessica Sankey framed the scale:
"If in the next five years, the district is down another 600 elementary students across the district, that's about two elementary schools' worth of students." (Cascadia Daily News, Feb. 2026)
State Superintendent Chris Reykdal has acknowledged the structural mismatch publicly: "We have roughly 85,000 kids who are in their junior year and senior year each year. We have far fewer five-year-olds coming into the system."
The fiscal pressure is immediate. Washington's prototypical school funding model allocates resources based on enrollment. As Reykdal has noted, state funding formulas "immediately drive money away from districts as enrollments go down." Districts with half-empty elementary buildings still carry the same maintenance, utility, and administrative costs. Bellevue closed Wilburton and Eastgate elementaries in 2023-24 after its first grade class fell to 70% the size of its 12th grade class. Seattle Public Schools proposed closing roughly 20 elementary schools before ultimately pulling back. Marysville faces a $25 million budget shortfall.
Increased homeschooling compounds the enrollment picture. Washington had roughly 29,467 registered homeschool students in 2024, up 76% from 16,722 in 2012. While the pandemic peak of 39,000 has receded, the settled level is still significantly above pre-pandemic norms of around 20,000.
What a 69,583-student kindergarten class means for 2032
The 2025-26 kindergarten class of 69,583 will, if the retention pattern of the last four cohorts holds, produce a 6th grade class of roughly 68,000 to 70,000 in 2031-32 and a graduating class around 2037-38. That is a projection, not a count. Compare it to the current 6th grade class of 82,157 or the current senior class of 99,231. The buildings, staffing models, and transportation routes built for the larger cohorts will have to be restructured for classes that are 15% to 30% smaller.
The question for Washington superintendents is not whether to consolidate elementary schools. It is whether to do it now, while the fiscal cushion from larger high school cohorts still exists, or later, after the small cohorts reach high school and shrink every building in the system at once. The 2020 kindergarten class of 82,947 will graduate in 2033. The class of 69,583 behind it will not.
Detailed code that reproduces the analysis and figures in this article is available exclusively to EdTribune subscribers.
Discussion
Sign in to join the discussion.
Loading comments...